SLIDE LAYOUT FINDER

Editable Consulting PowerPoint Layouts

See how a consultant would lay out your slide. Paste a screenshot to find matching structures, or browse editable templates.

Try three free PPTX templates · no sign-up required

Not sure which shape to use? Choose a layout for your message

+

Paste a screenshot to start

⌘ VorCtrl V

or drop an image here

Choose image

Search is free · PNG, JPG, WebP

Try an example

From a rough draft to a finished layout
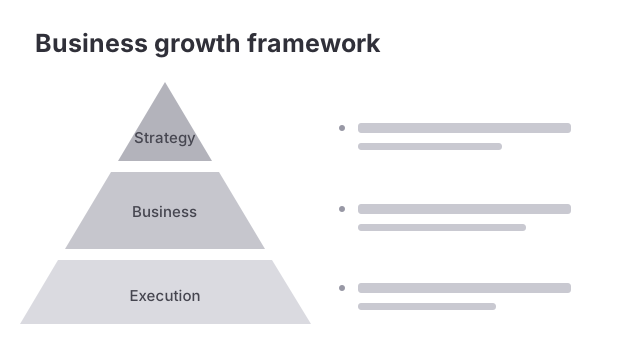
Example draft: a three-level growth pyramid
A rough draft
Library layout: strategy house with goal, three pillars and a foundation bar
Editable layout from the library

Good layouts
don't start from zero.

The library · 221 editable slide layouts

Every layout is redrawn from scratch with fictional sample data, and comes as a native PowerPoint file: real shapes and text boxes you can edit, recolor and resize.
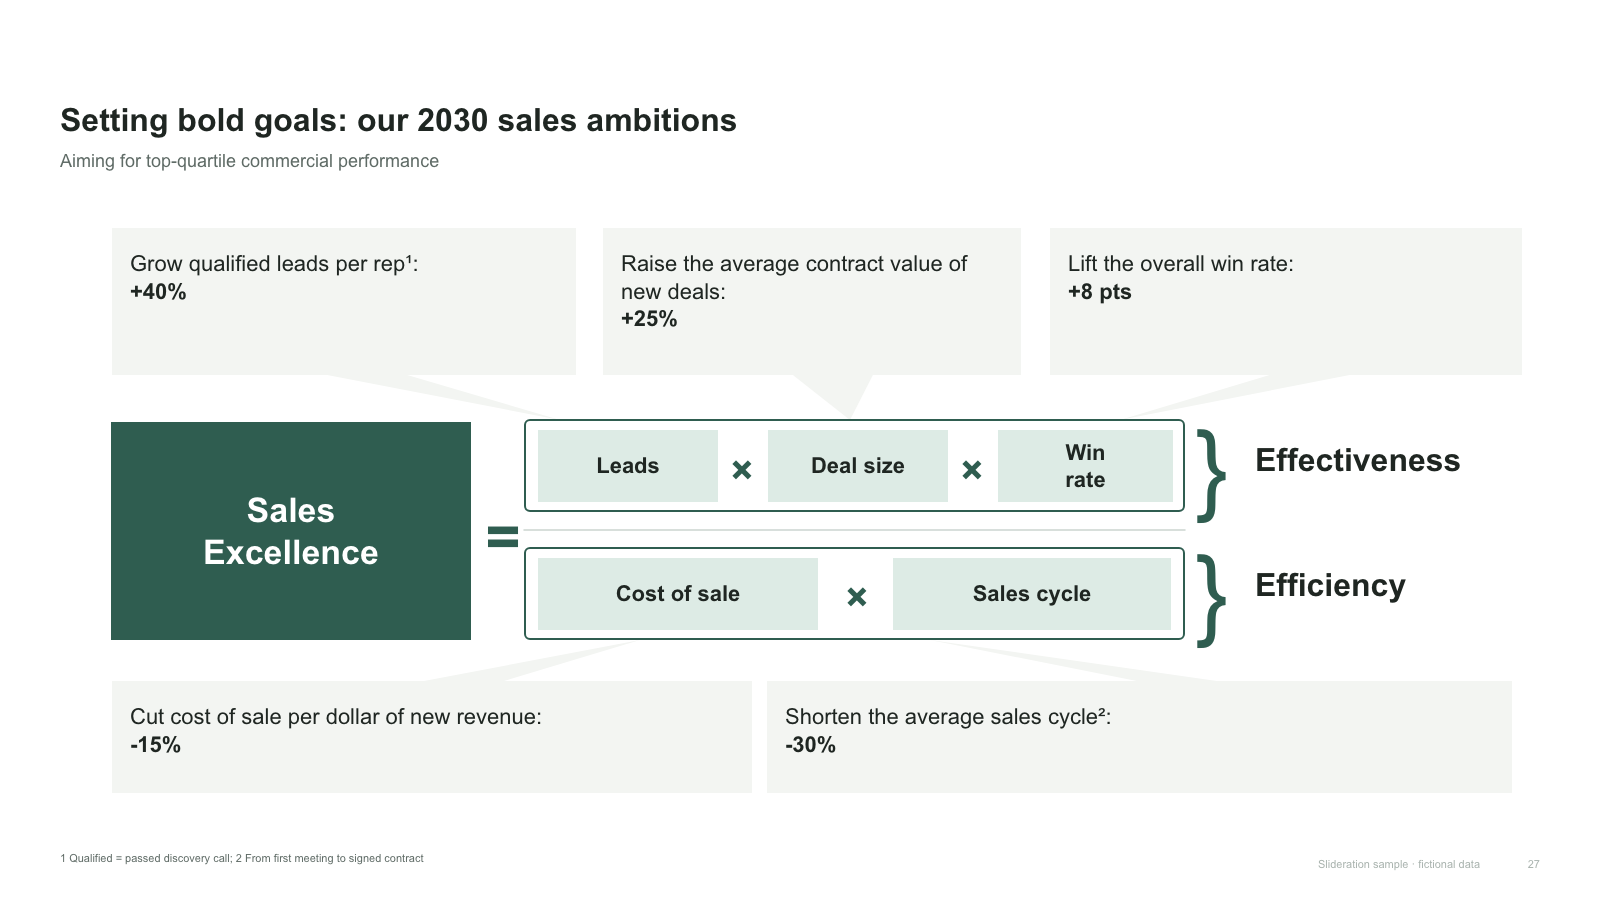
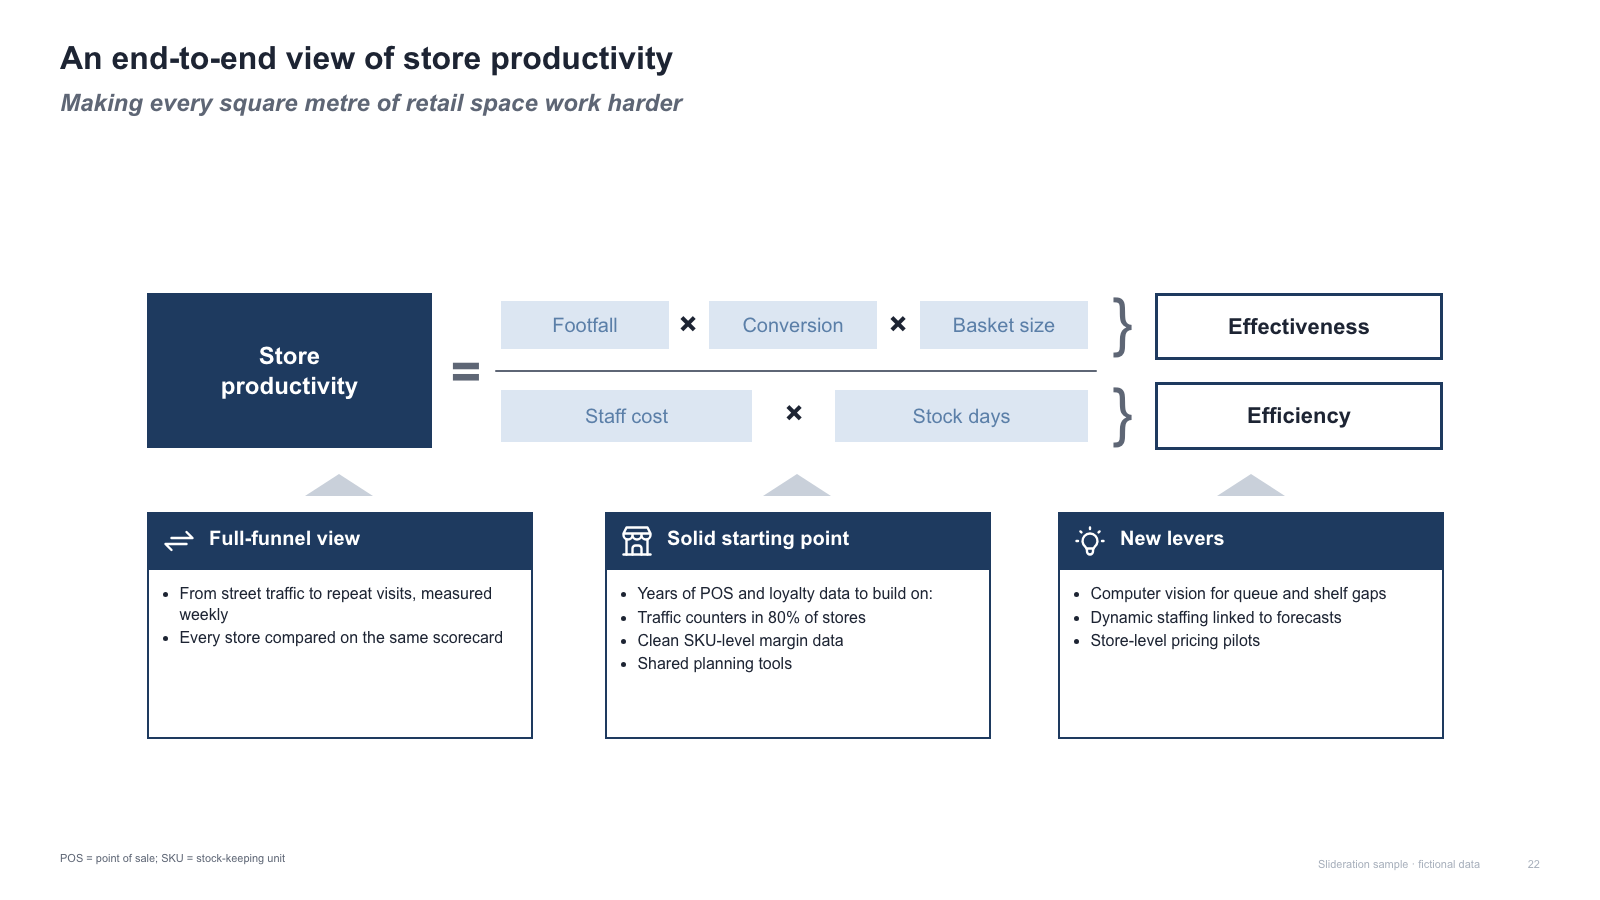
Driver-tree equation with effectiveness/efficiency brackets and three supporting boxes

Driver-tree equation with effectiveness/efficiency brackets and three supporting boxes

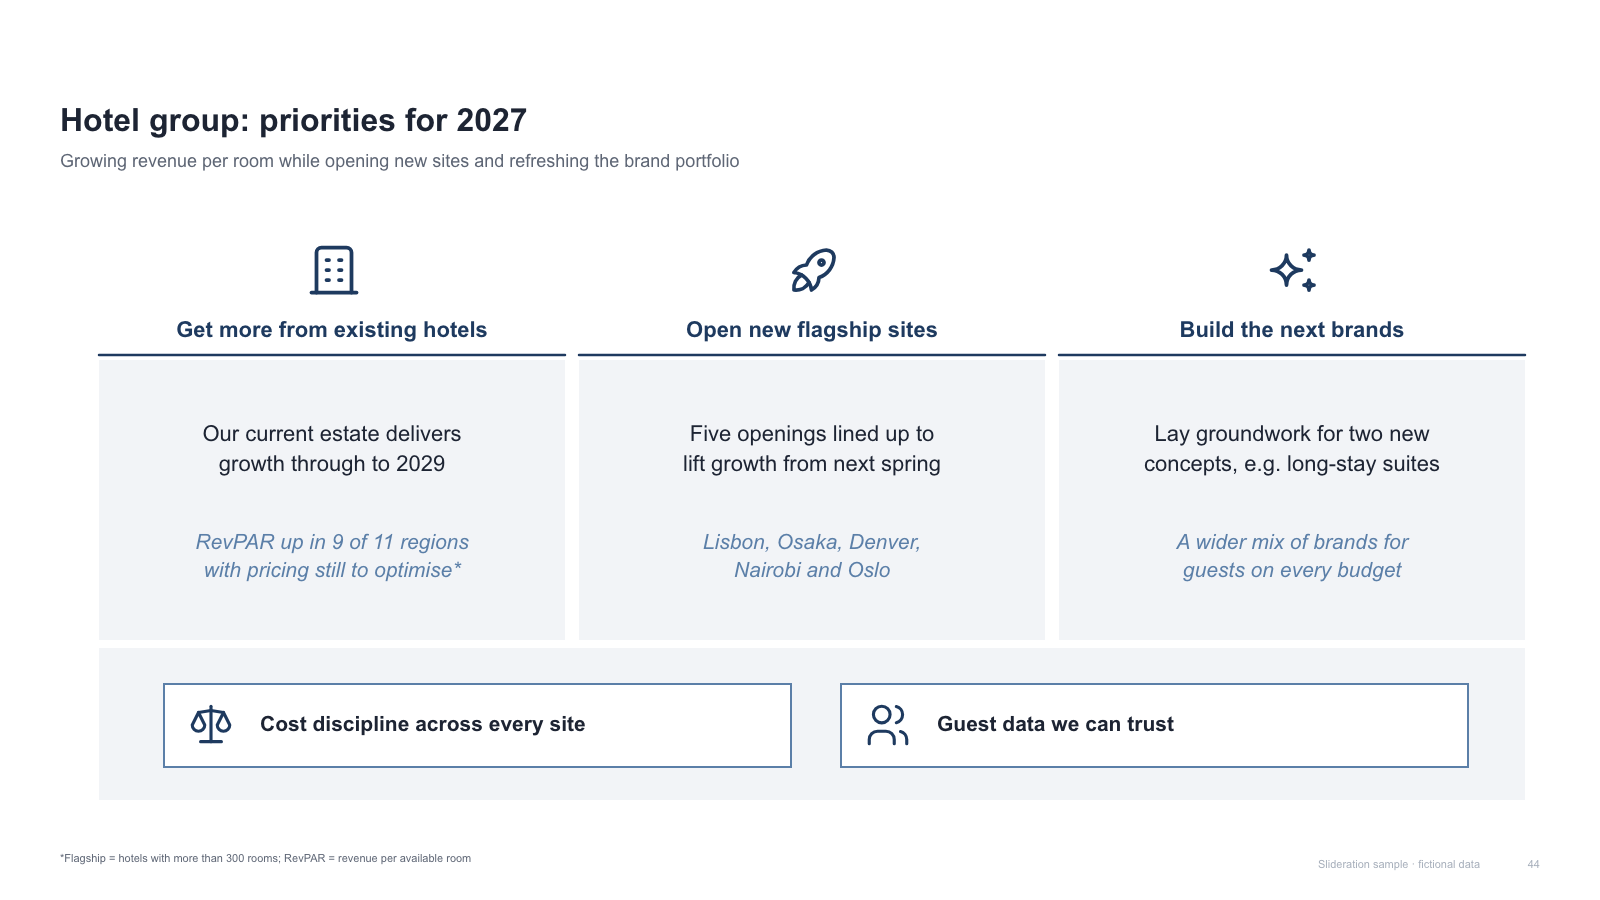
Three icon-topped priority columns with grey panels and a two-principle footer strip

Three icon-topped priority columns with grey panels and a two-principle footer strip

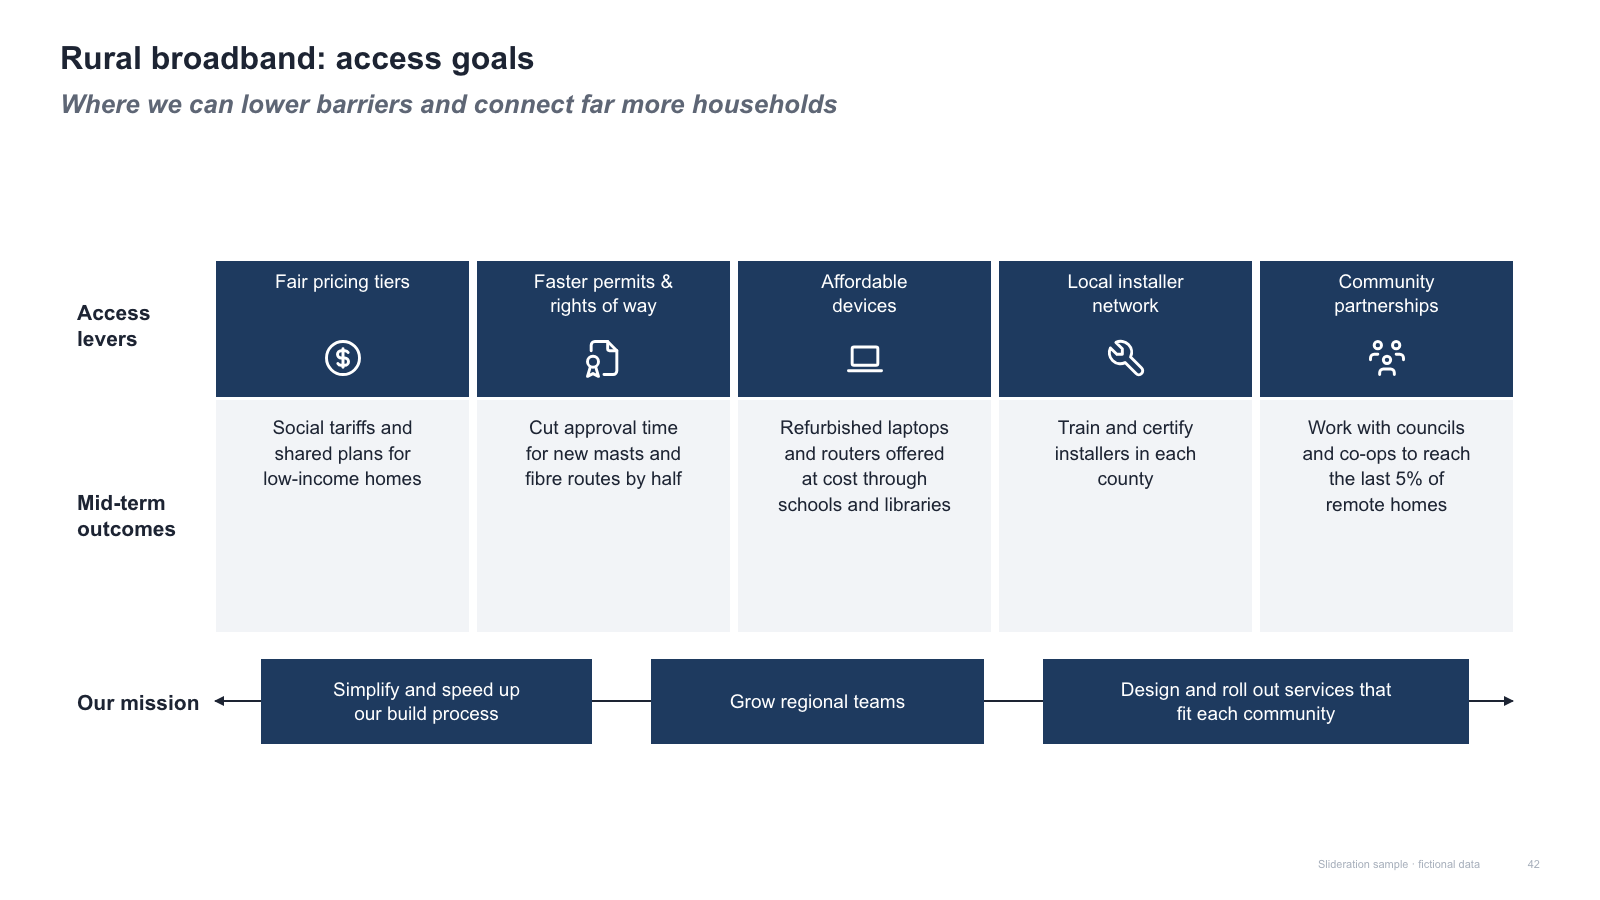
Five-column levers matrix with row labels and a mission arrow of three boxes

Five-column levers matrix with row labels and a mission arrow of three boxes

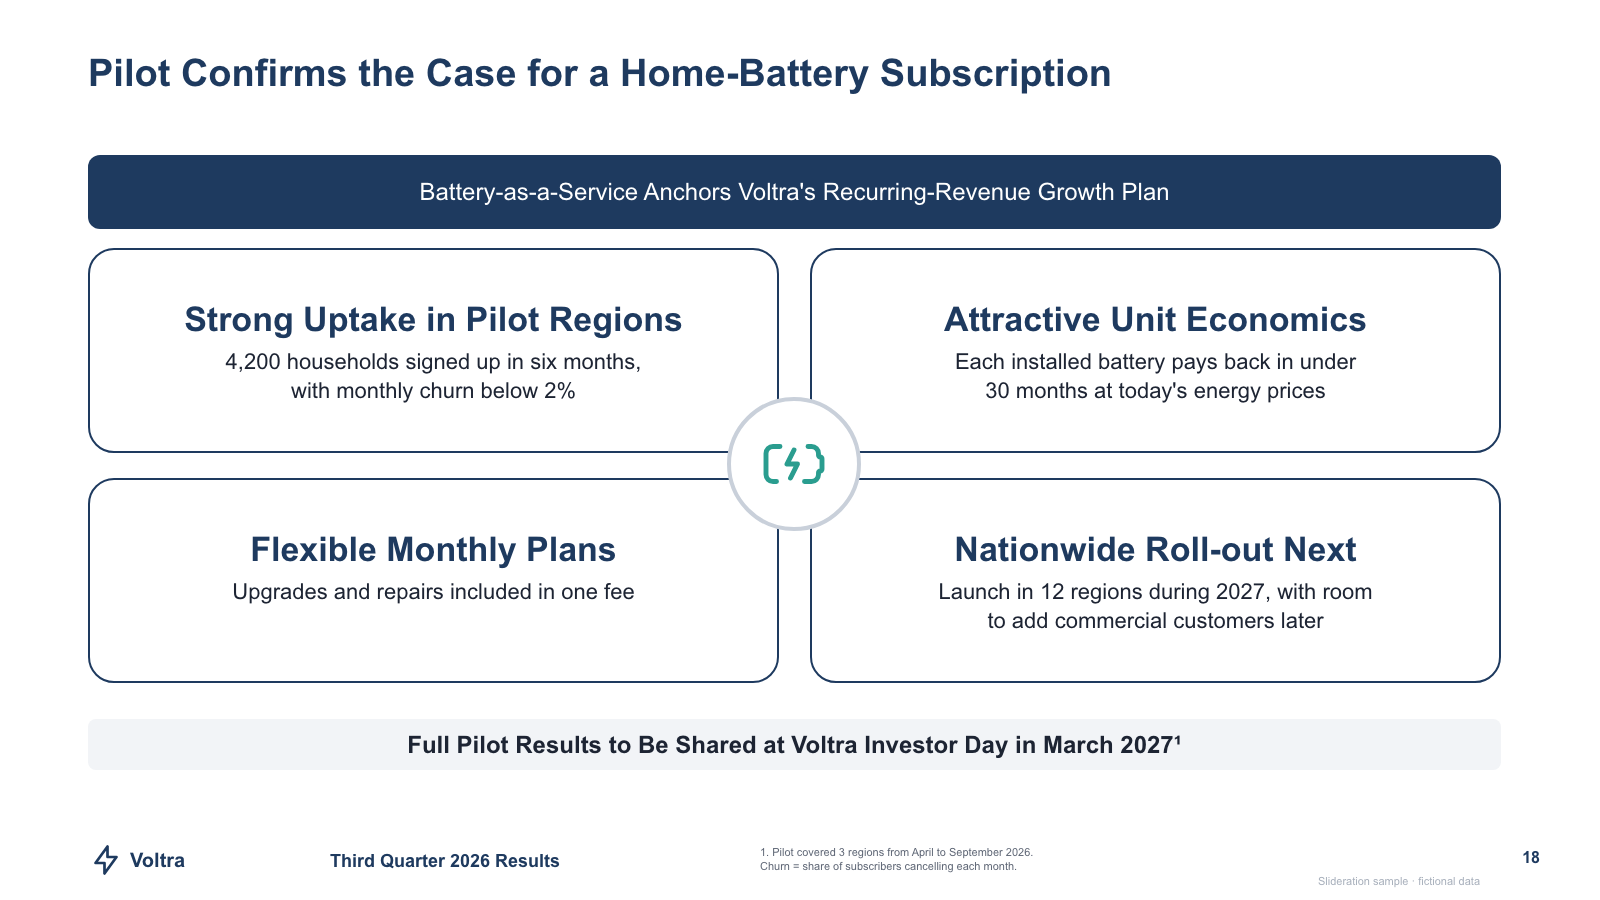
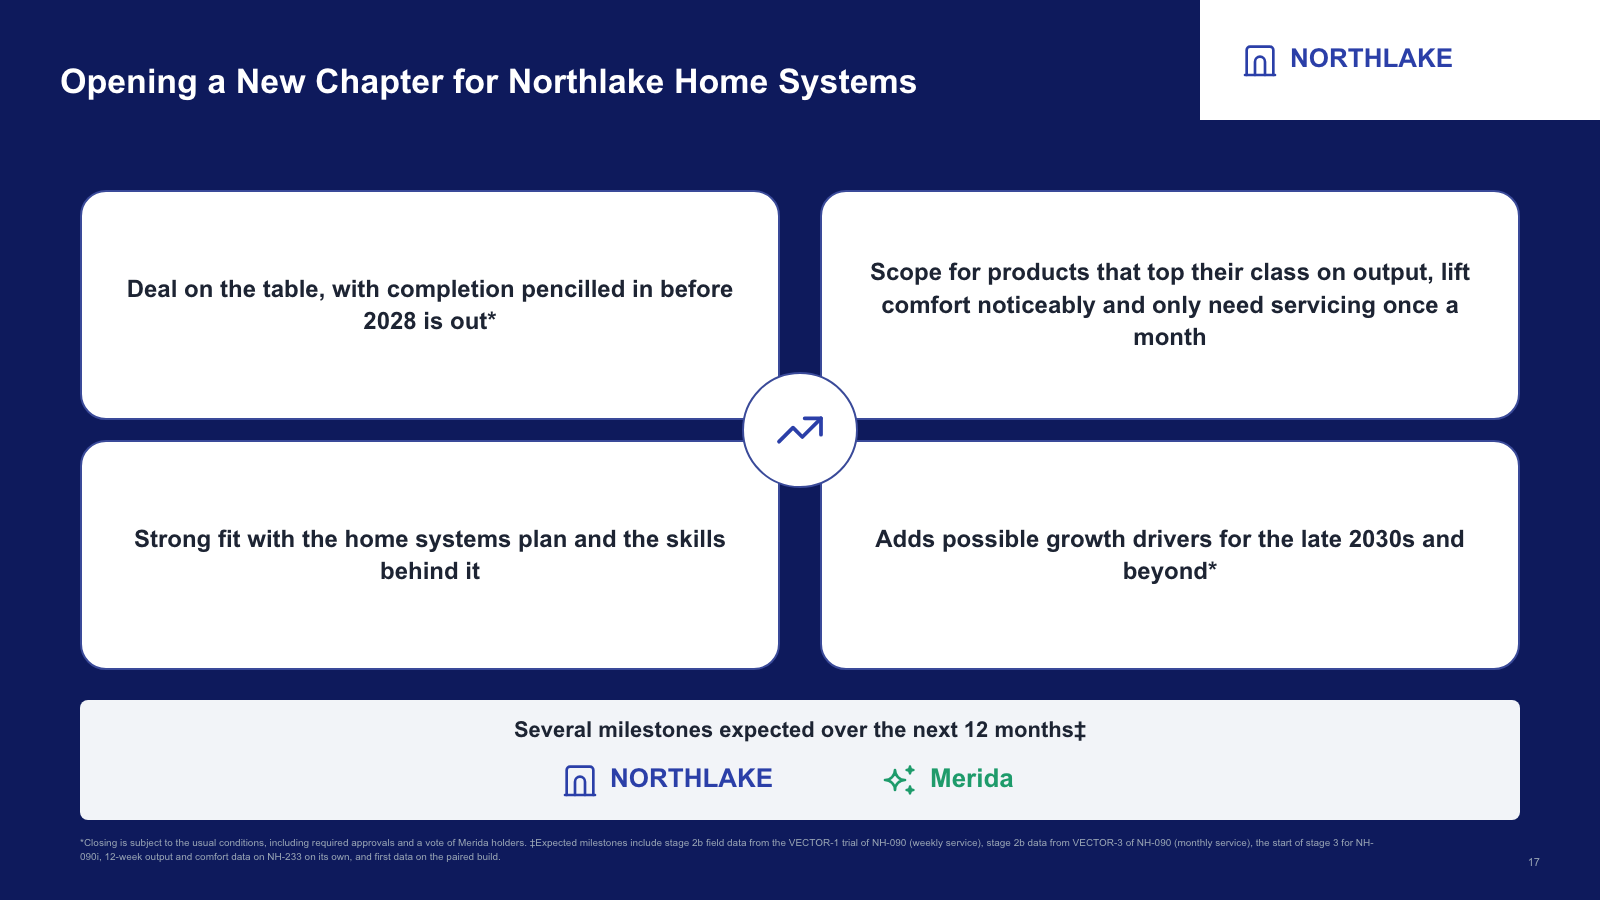
Banner over a 2x2 grid of rounded message boxes joined by a central badge, with a closing bar

Banner over a 2x2 grid of rounded message boxes joined by a central badge, with a closing bar

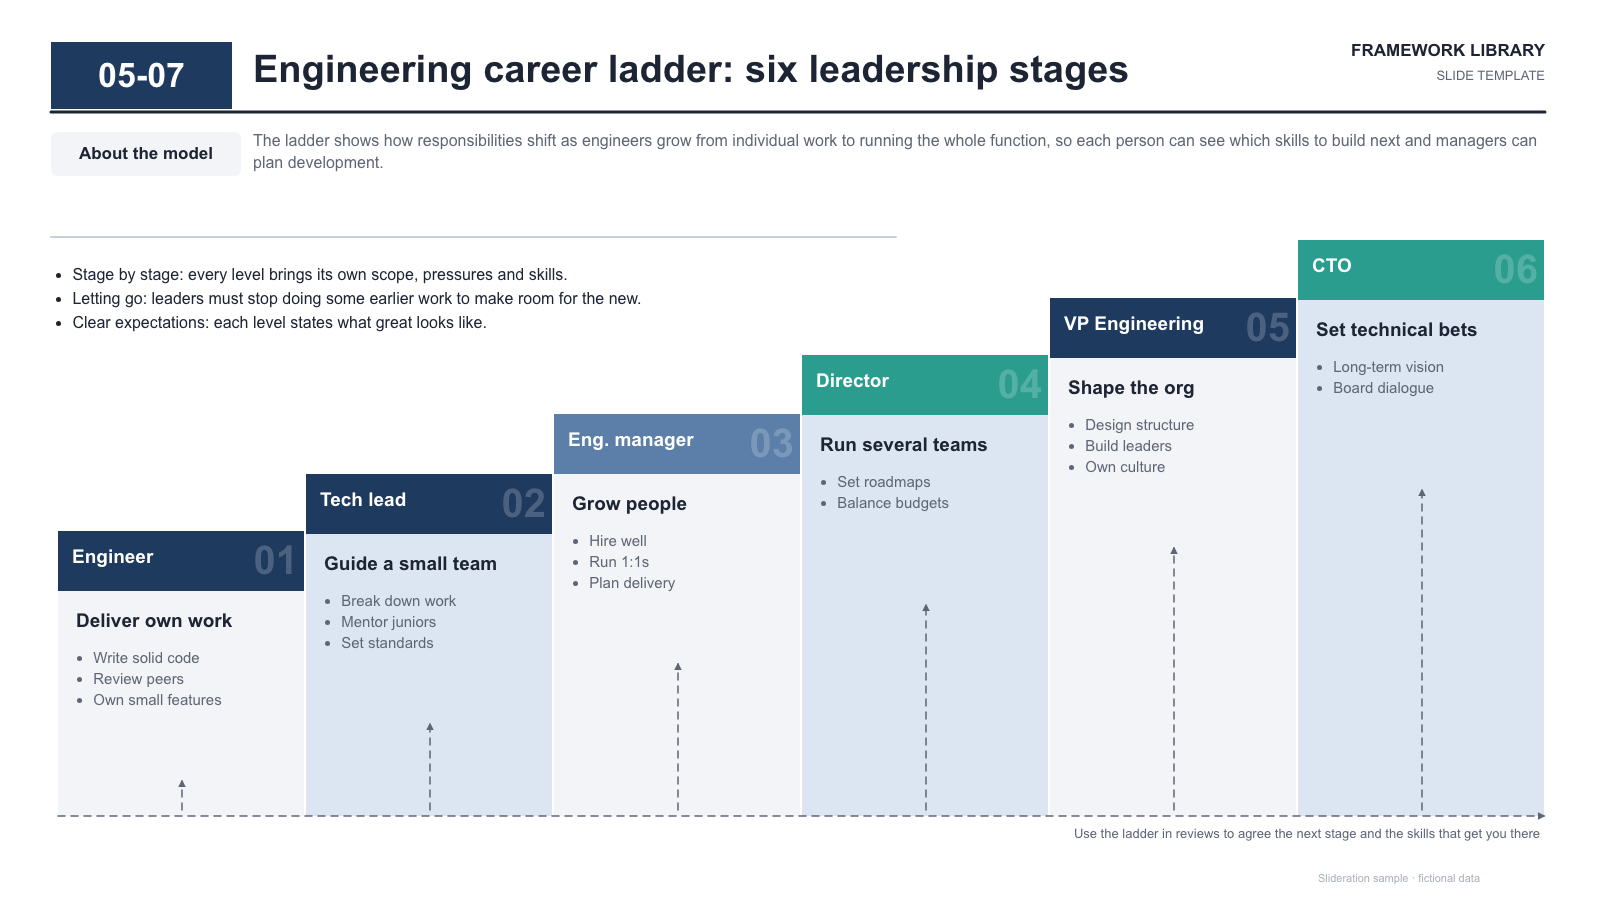
Six-step staircase of leadership stages with headers, focus lines and dashed growth arrows

Six-step staircase of leadership stages with headers, focus lines and dashed growth arrows

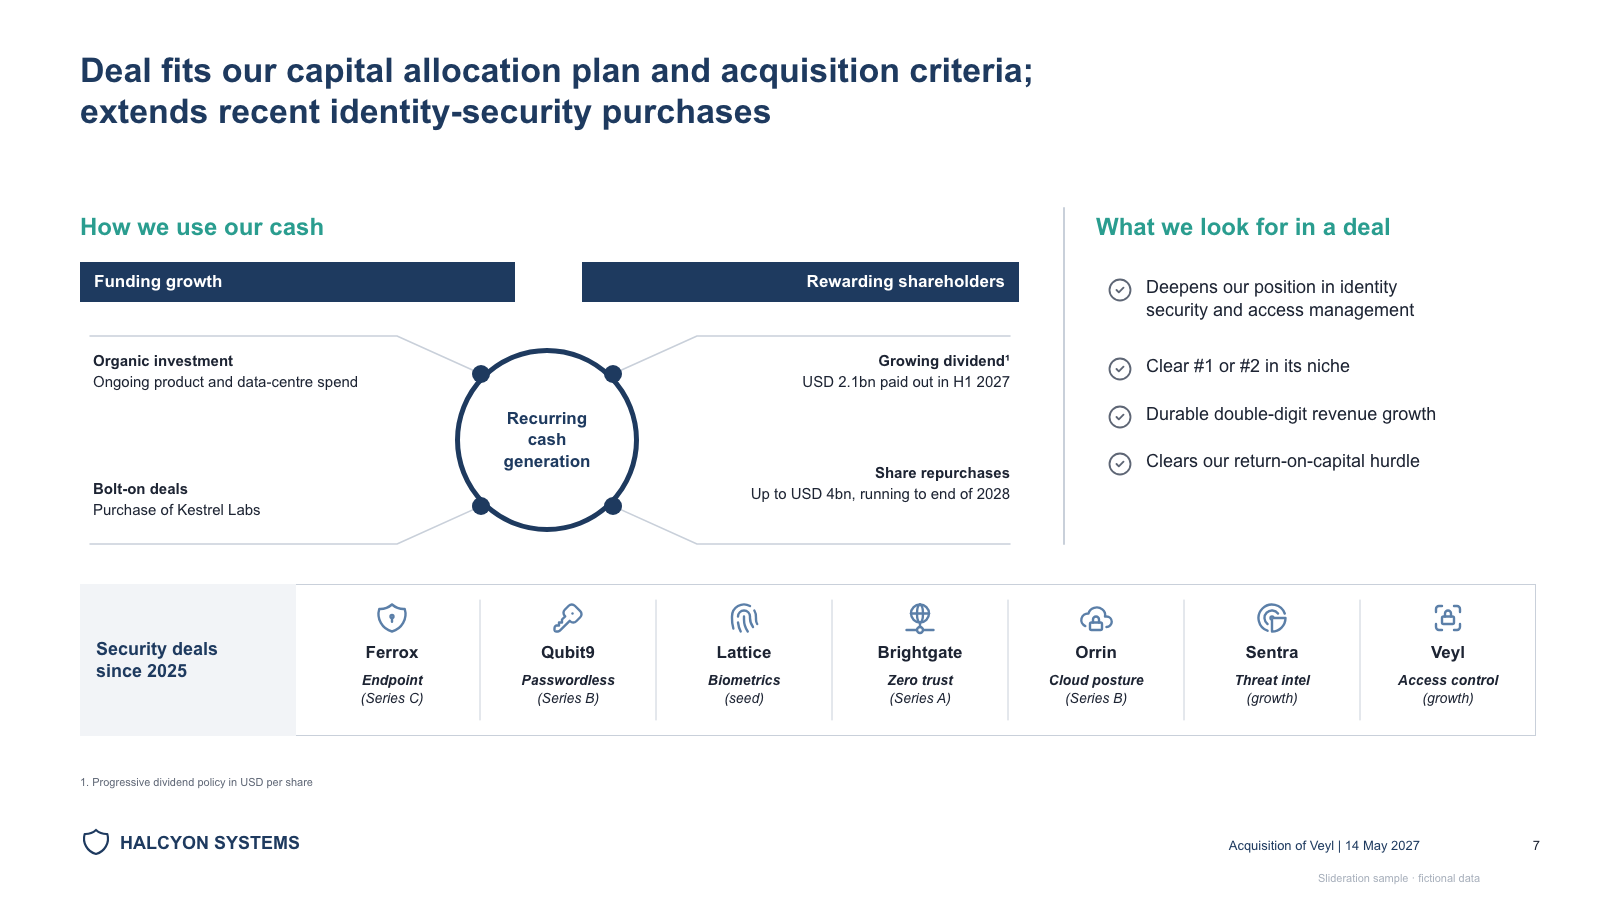
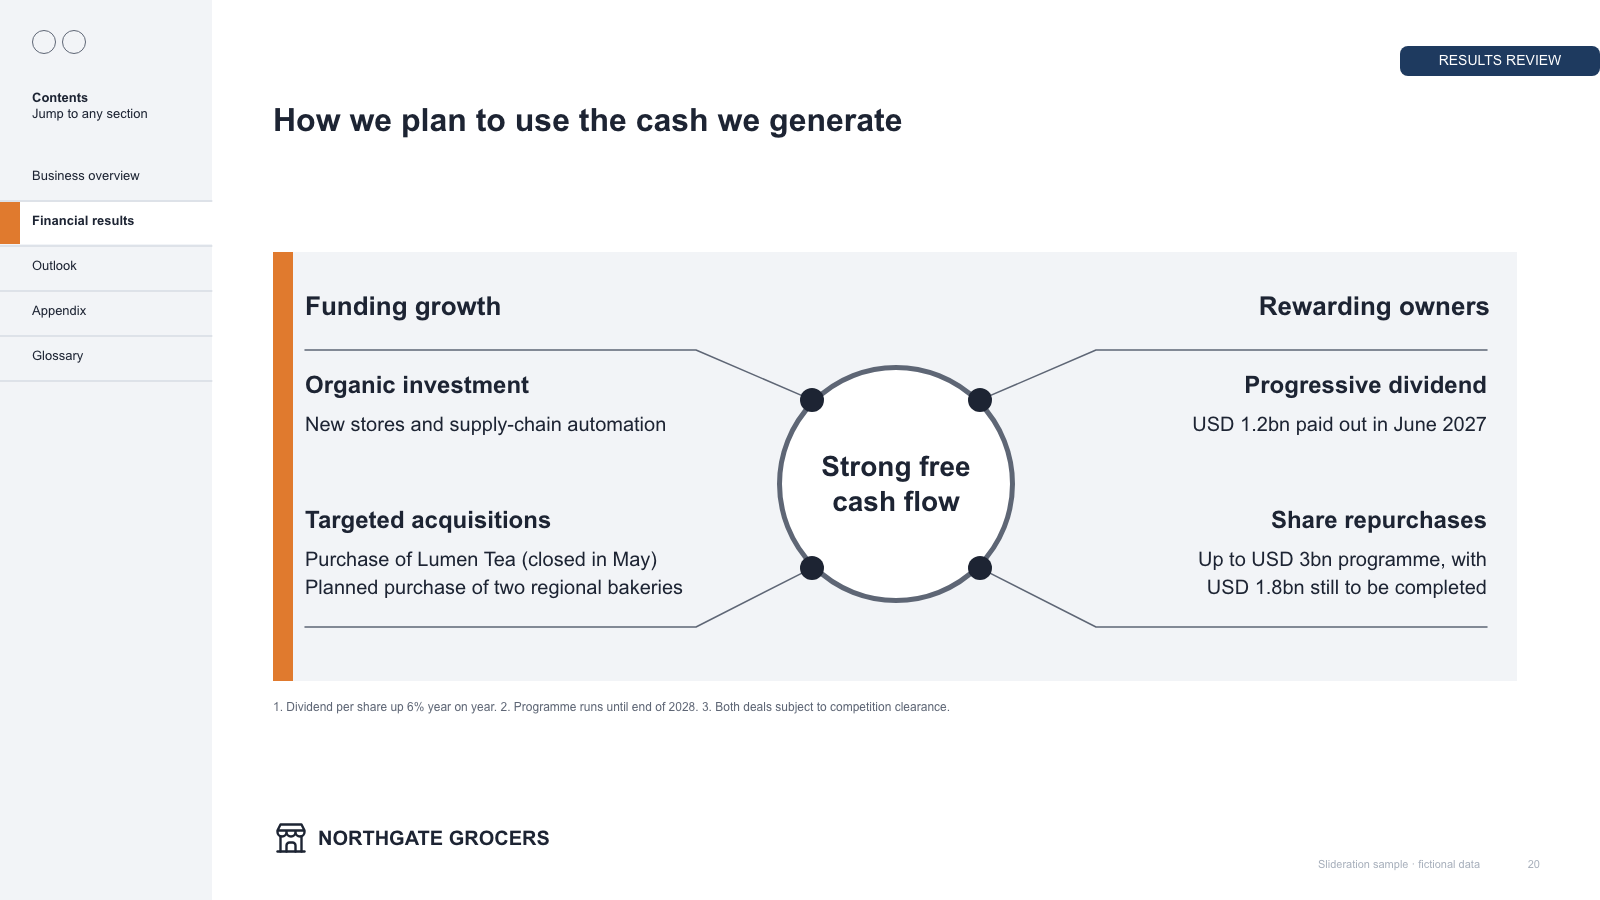
Capital-allocation hub with four connected notes, criteria checklist and a deal strip

Capital-allocation hub with four connected notes, criteria checklist and a deal strip

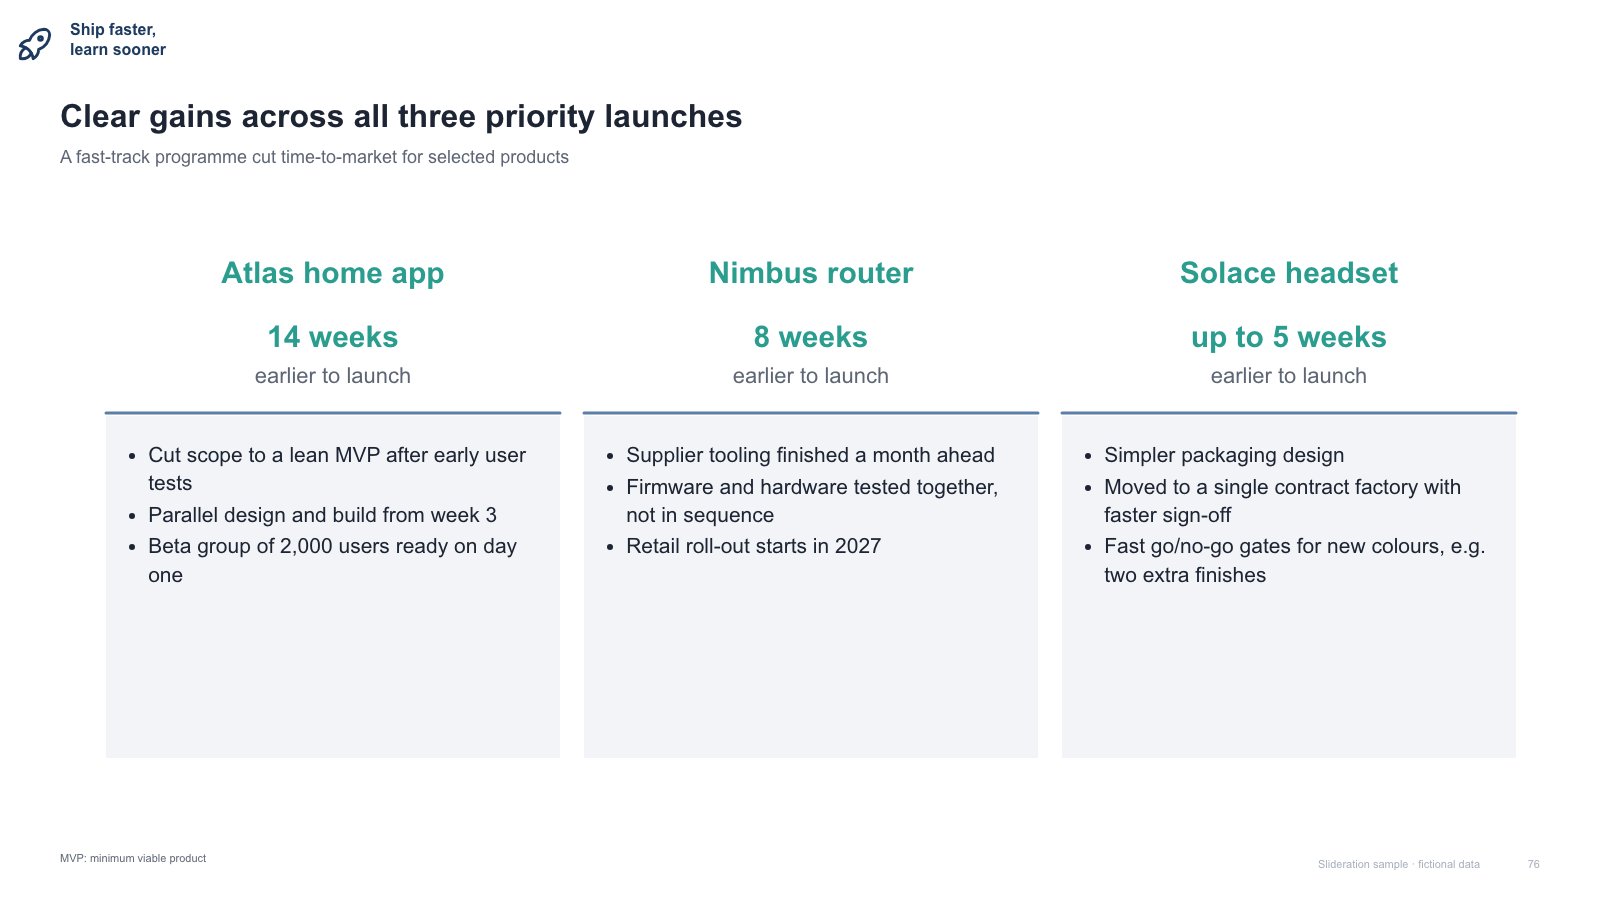
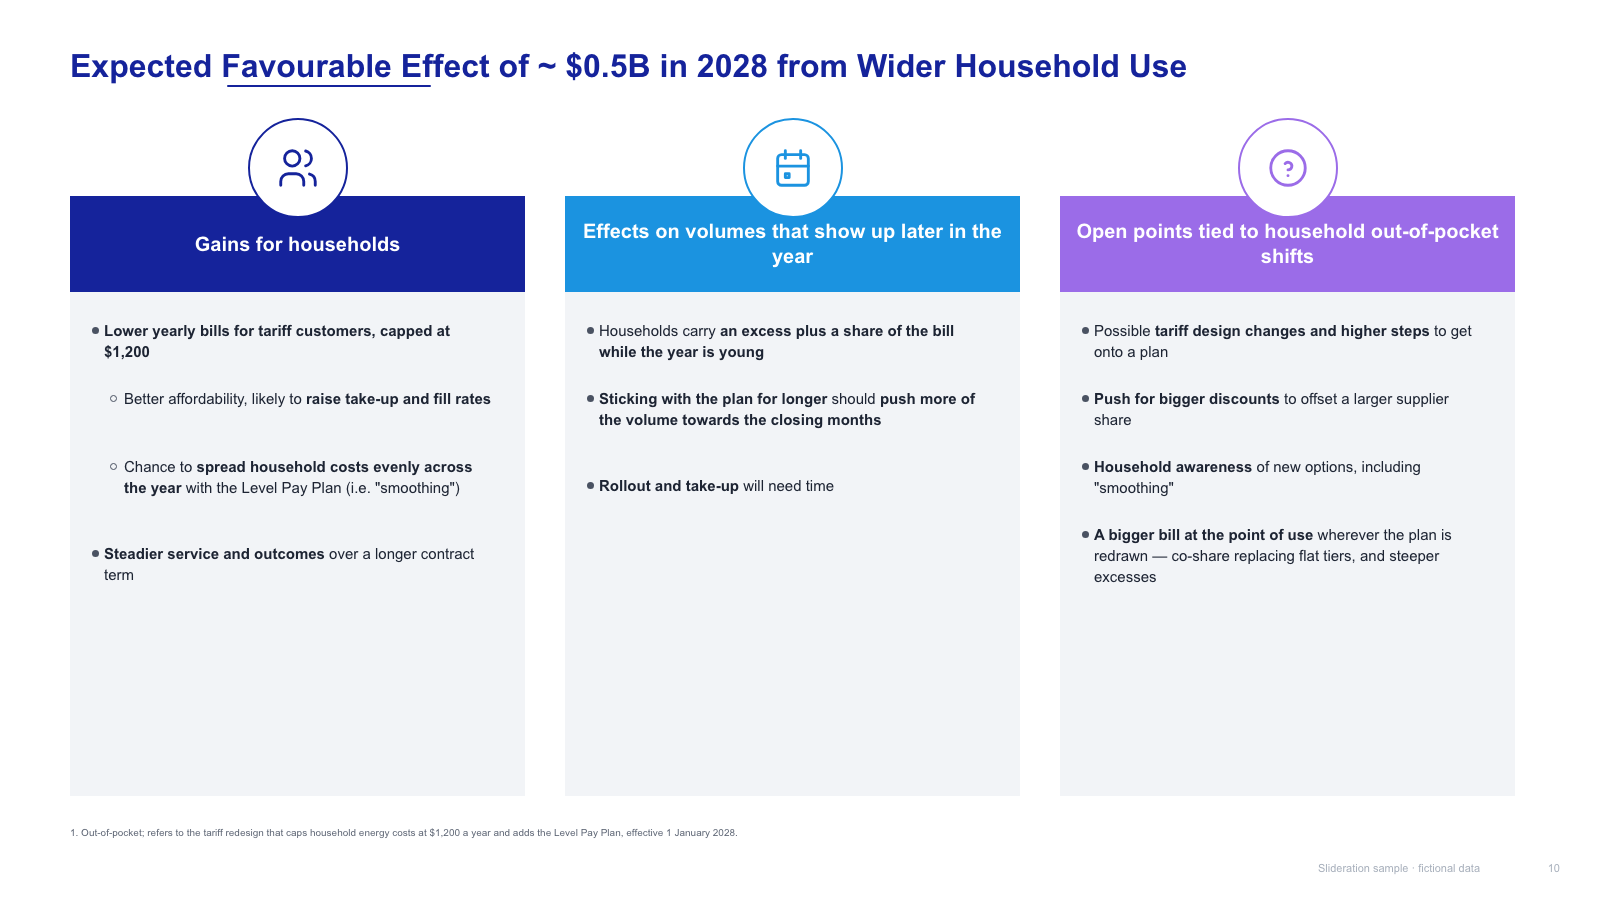
Three result columns with headline metric, underline and grey bullet panels

Three result columns with headline metric, underline and grey bullet panels

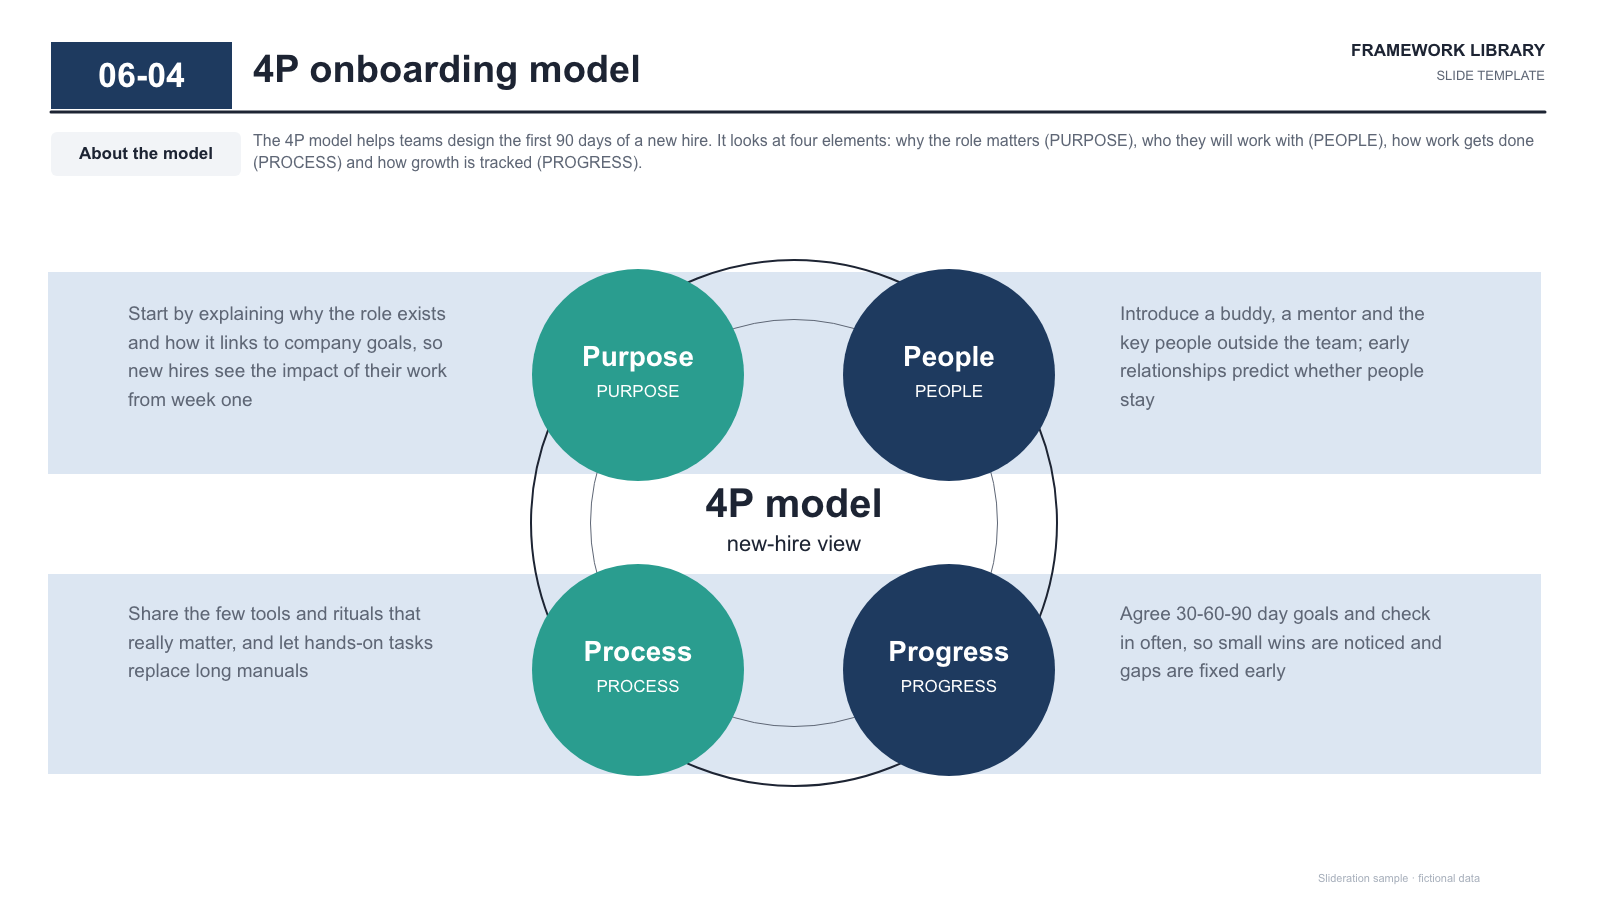
Four circles around a central label on two horizontal bands with side descriptions

Four circles around a central label on two horizontal bands with side descriptions

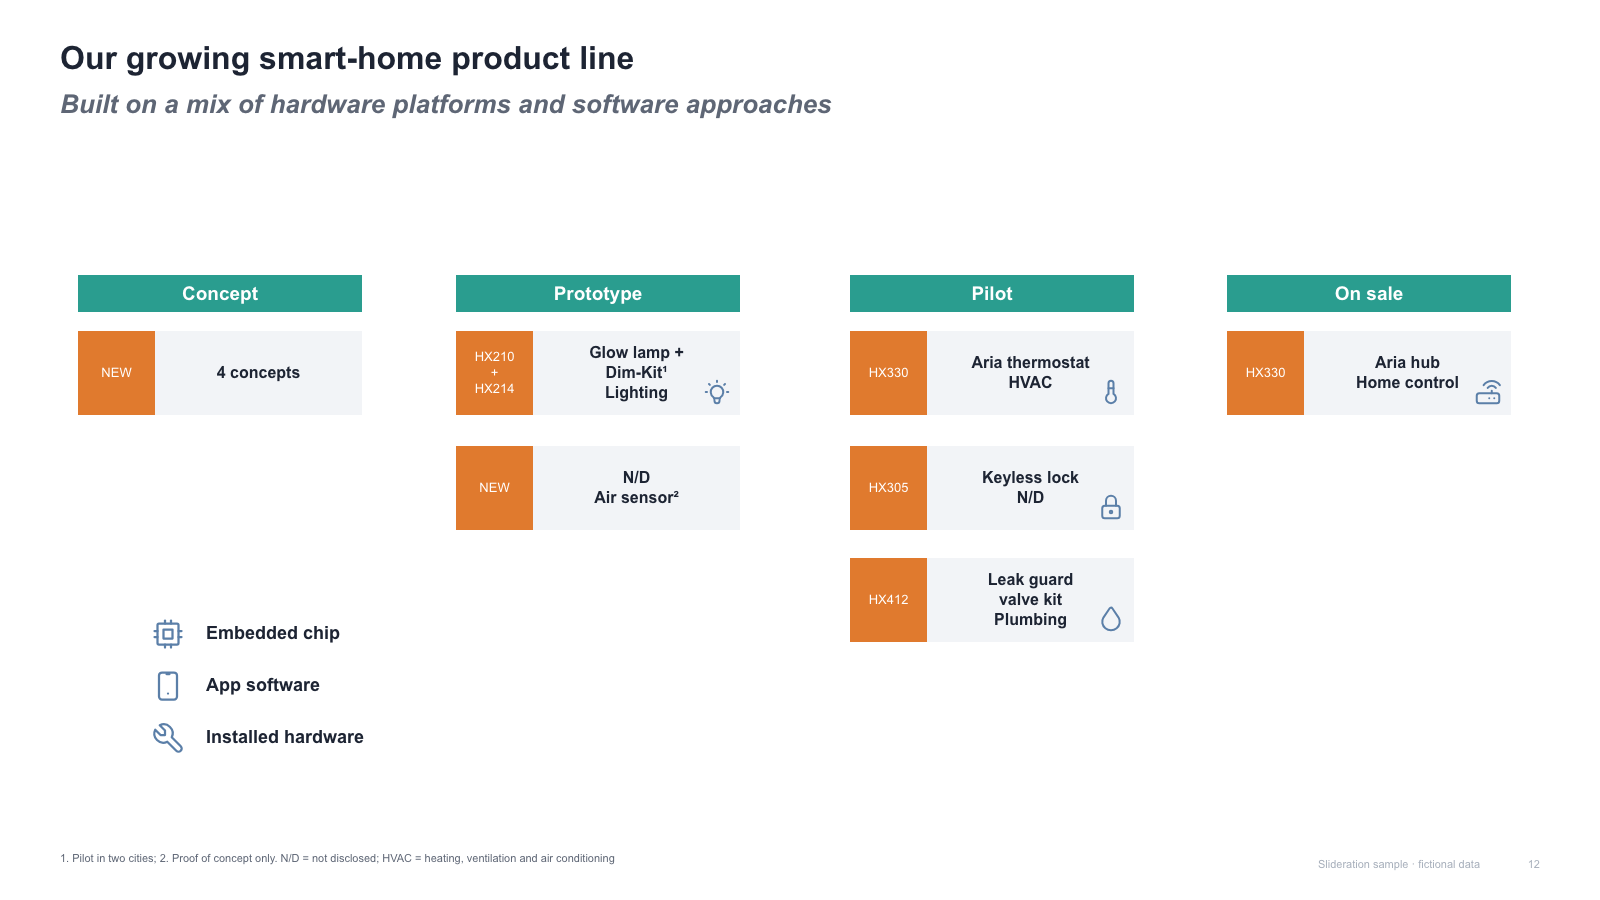
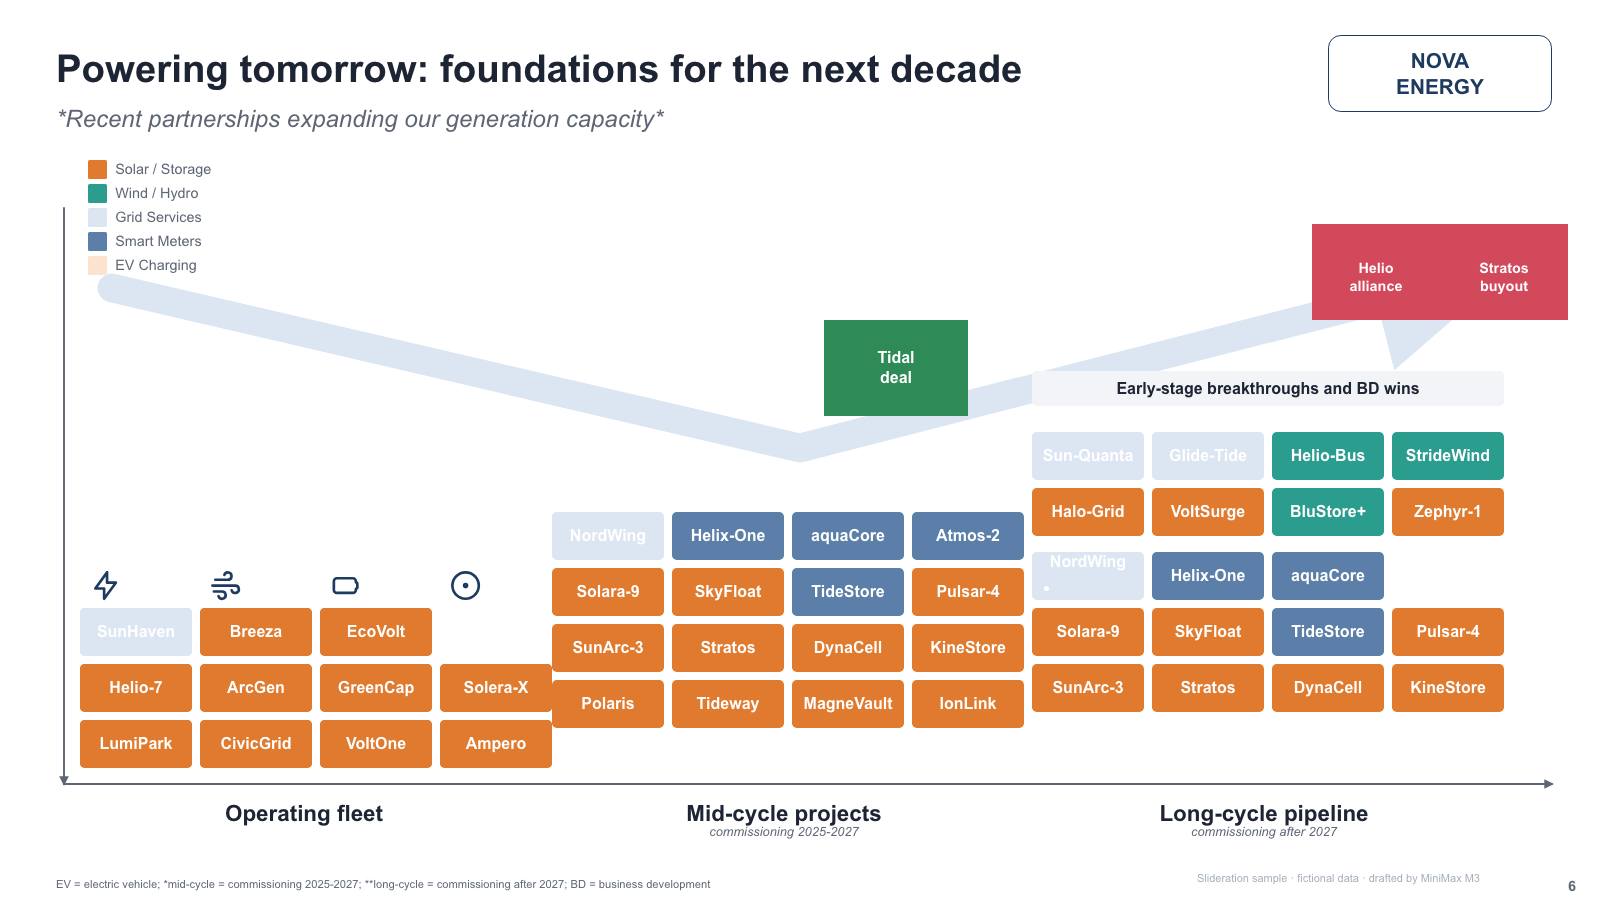
Four-stage pipeline columns with coded item cards and a small legend

Four-stage pipeline columns with coded item cards and a small legend

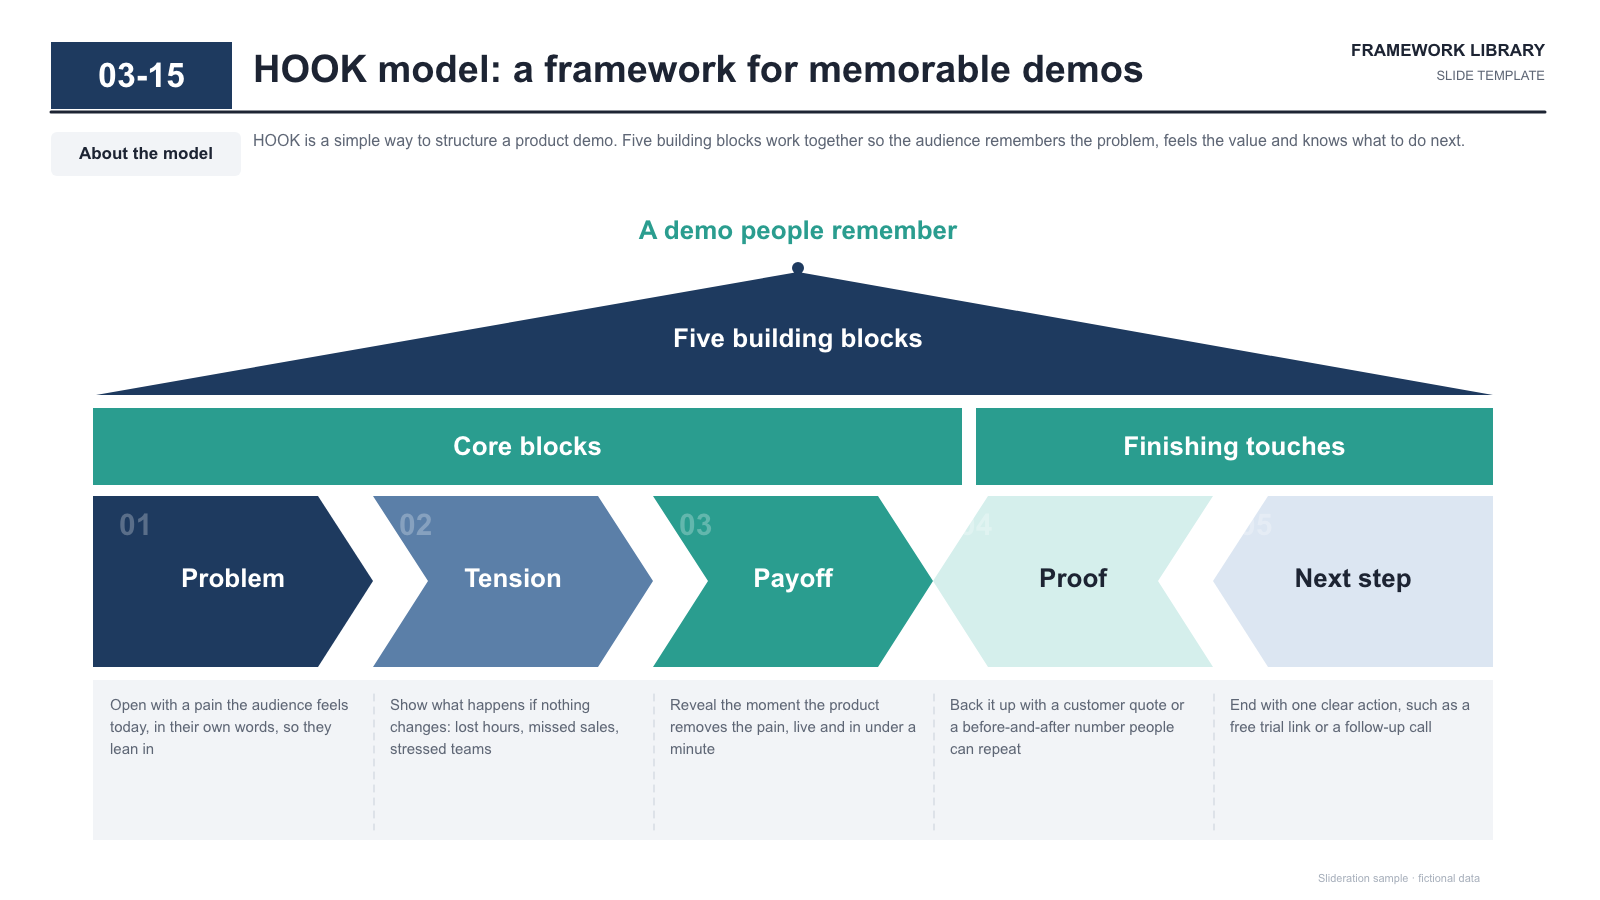
Roof triangle over two grouped bars, five chevrons (three right, two left) and description columns

Roof triangle over two grouped bars, five chevrons (three right, two left) and description columns

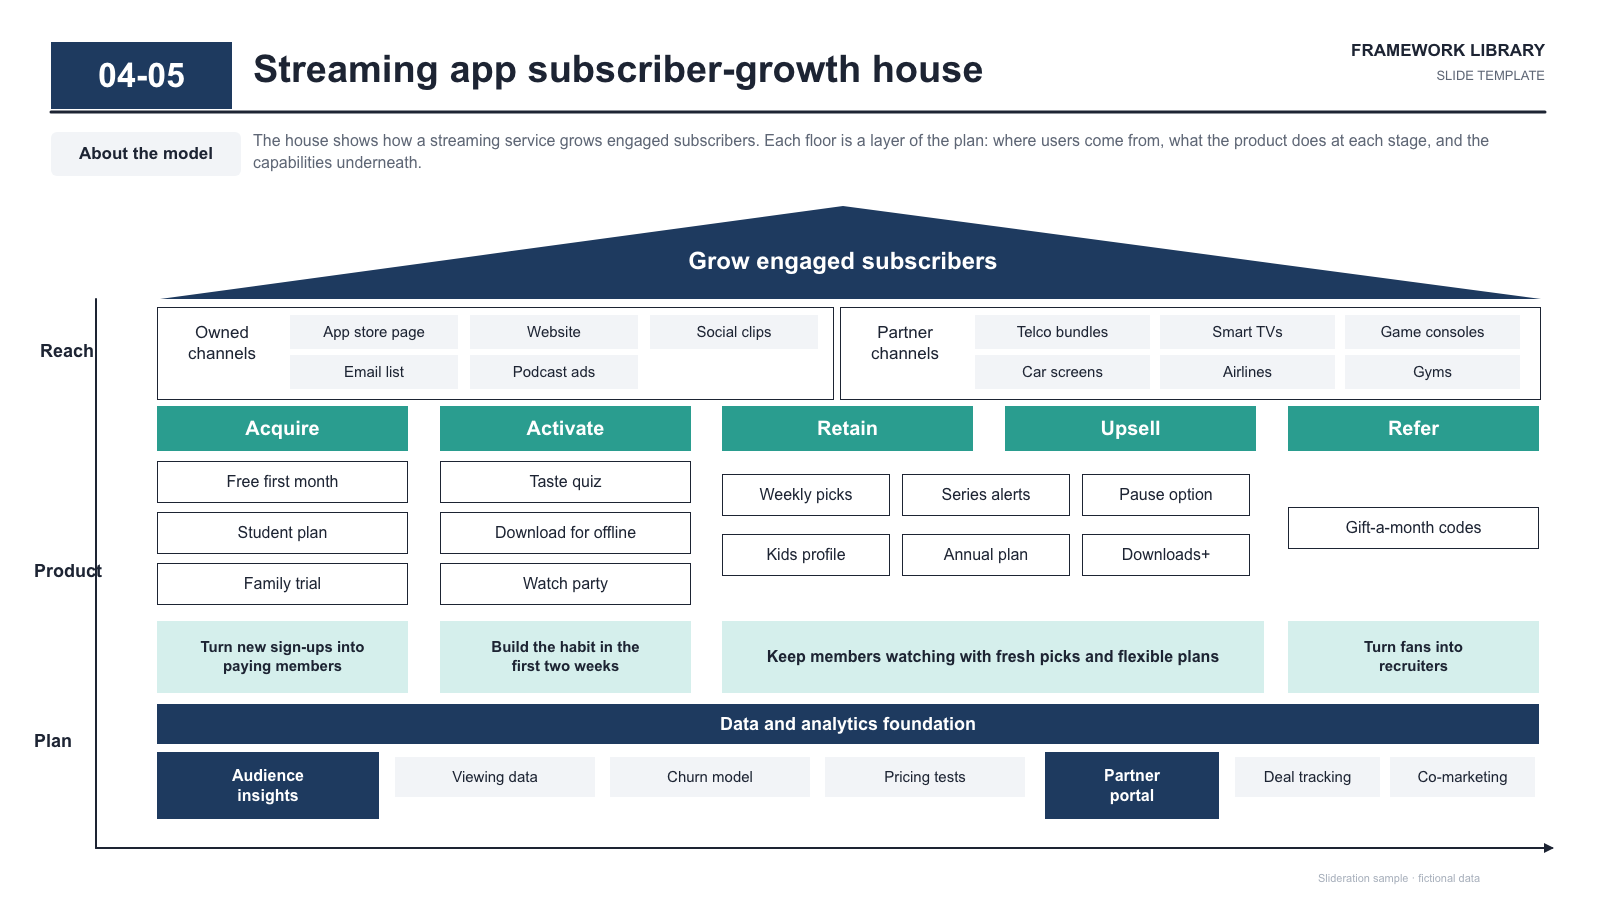
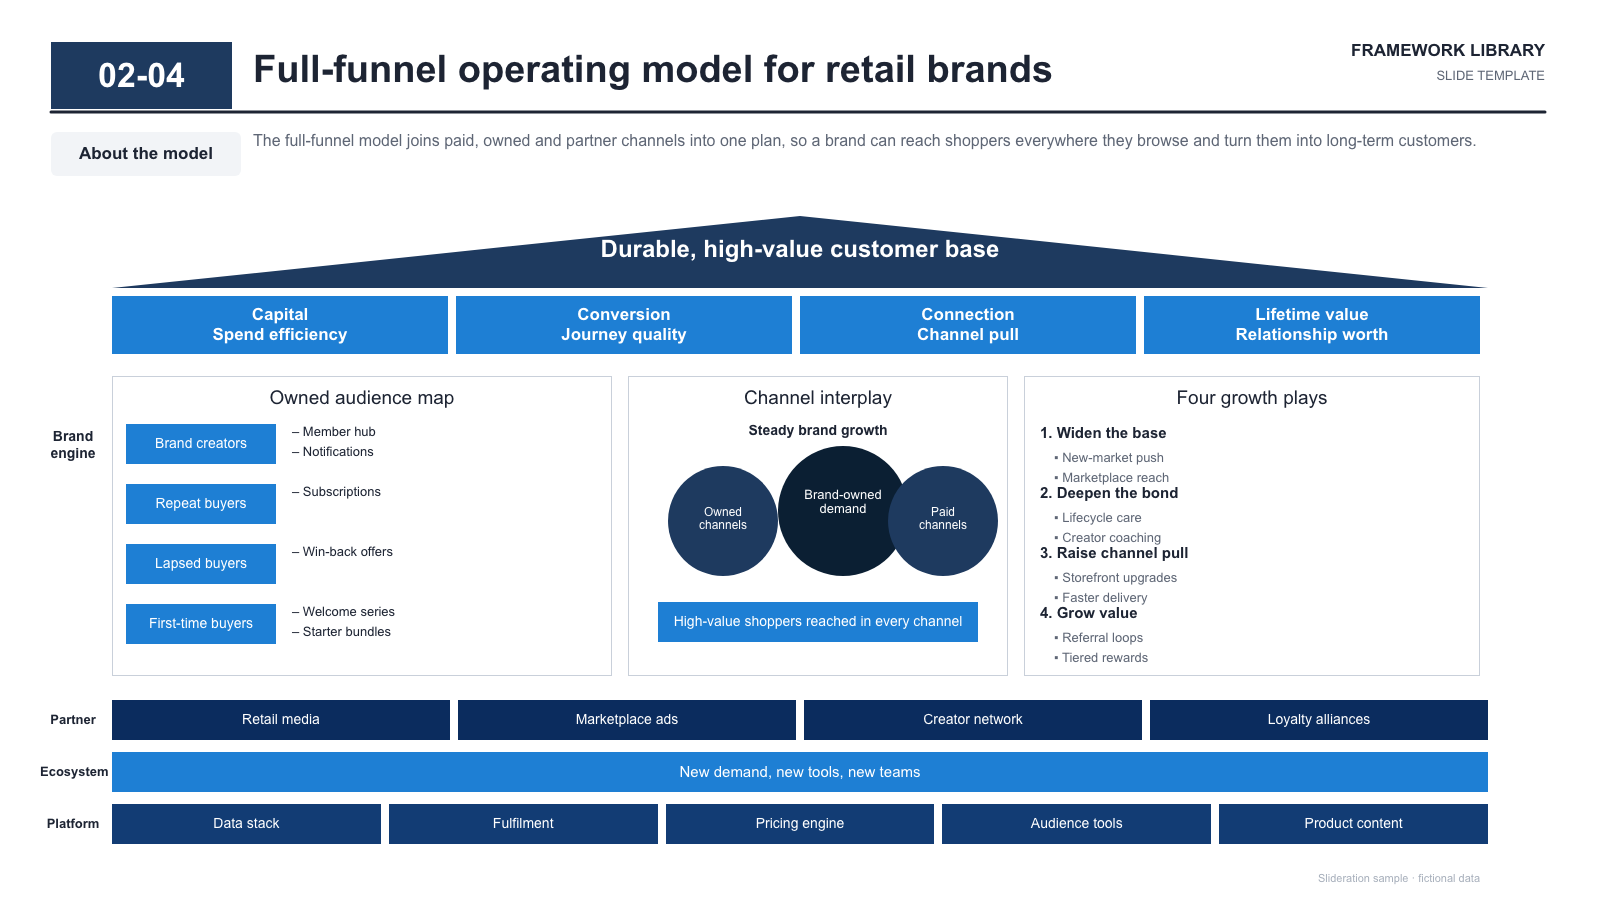
Strategy house with channel layer, five funnel stages, tactic grid, strategy row and foundation

Strategy house with channel layer, five funnel stages, tactic grid, strategy row and foundation

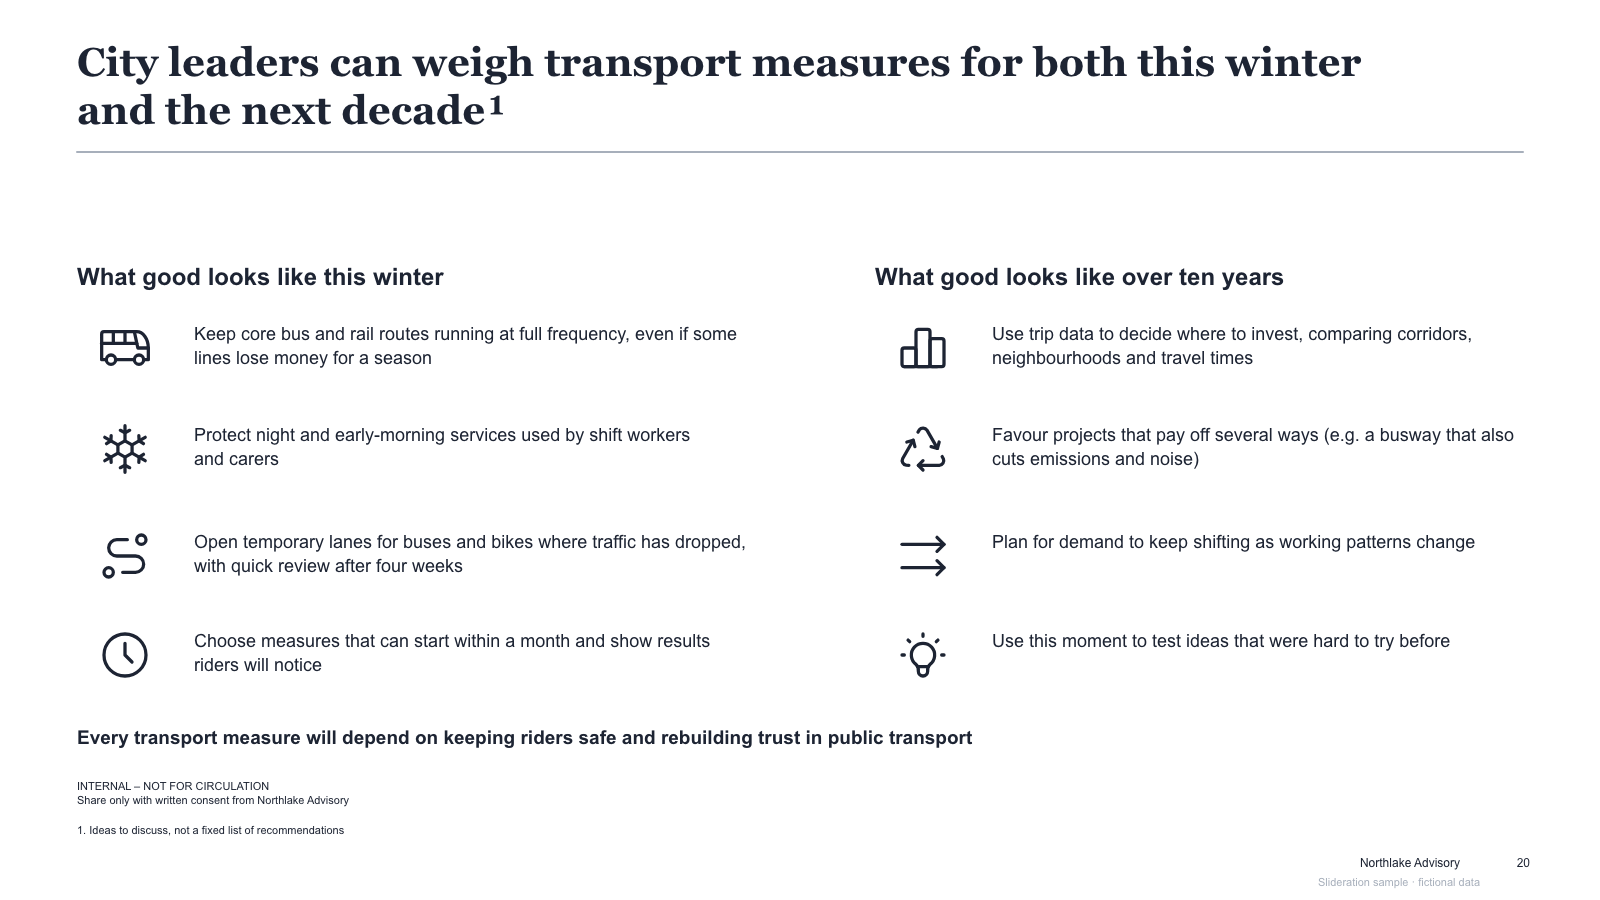
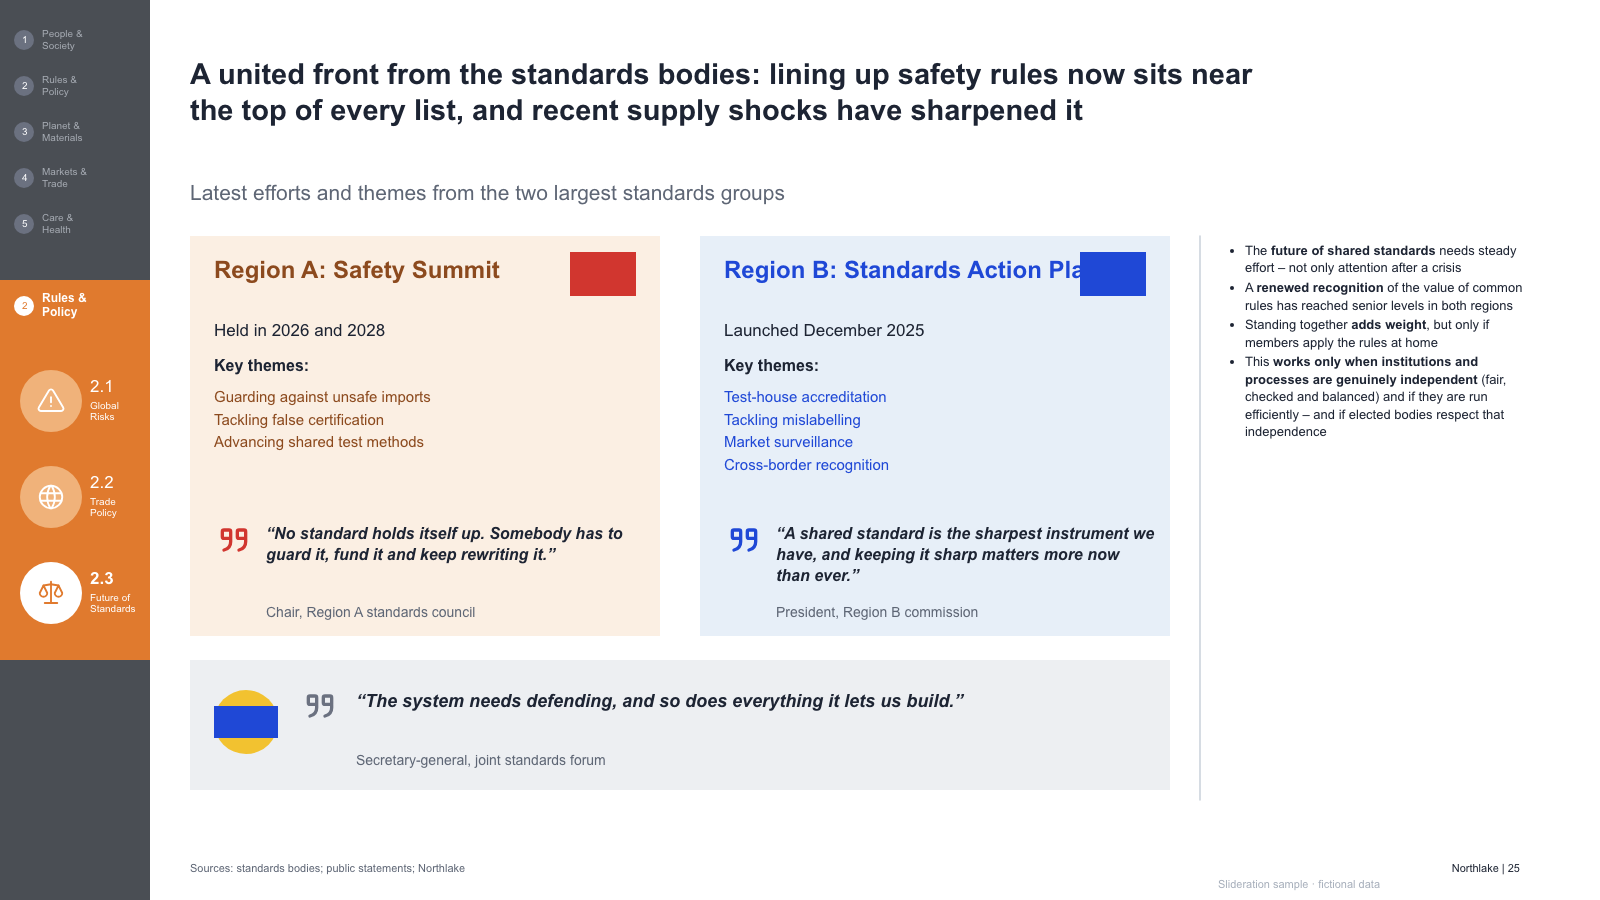
Serif headline, two columns of icon-led principles and a bold concluding line

Serif headline, two columns of icon-led principles and a bold concluding line

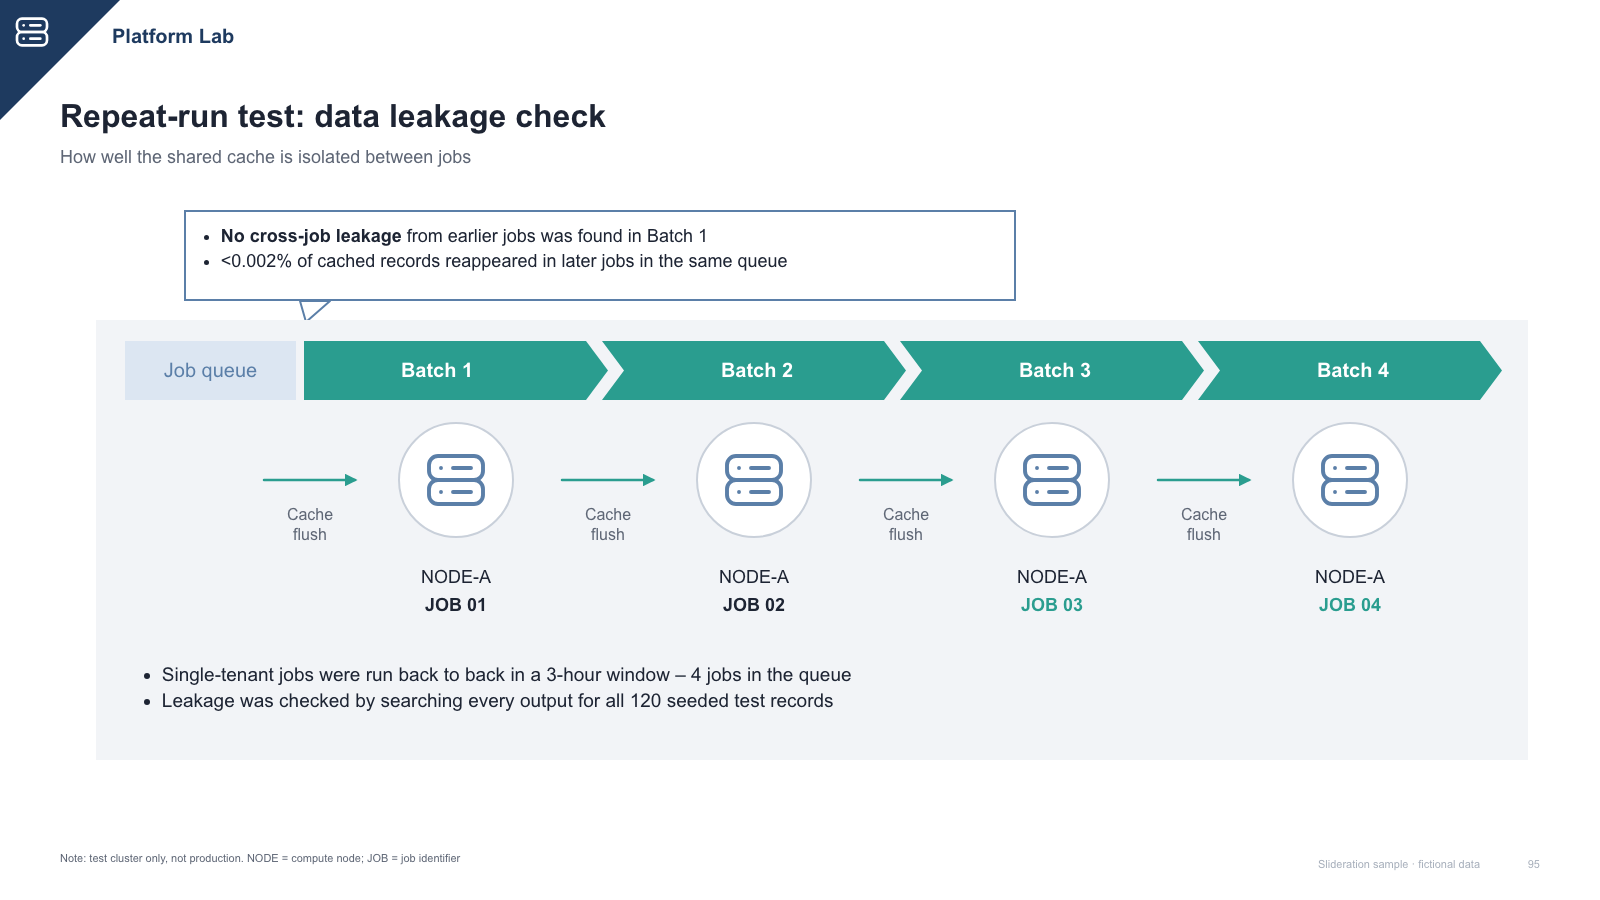
Callout over a process run strip (queue + four chevrons) with device icons, arrows and notes

Callout over a process run strip (queue + four chevrons) with device icons, arrows and notes

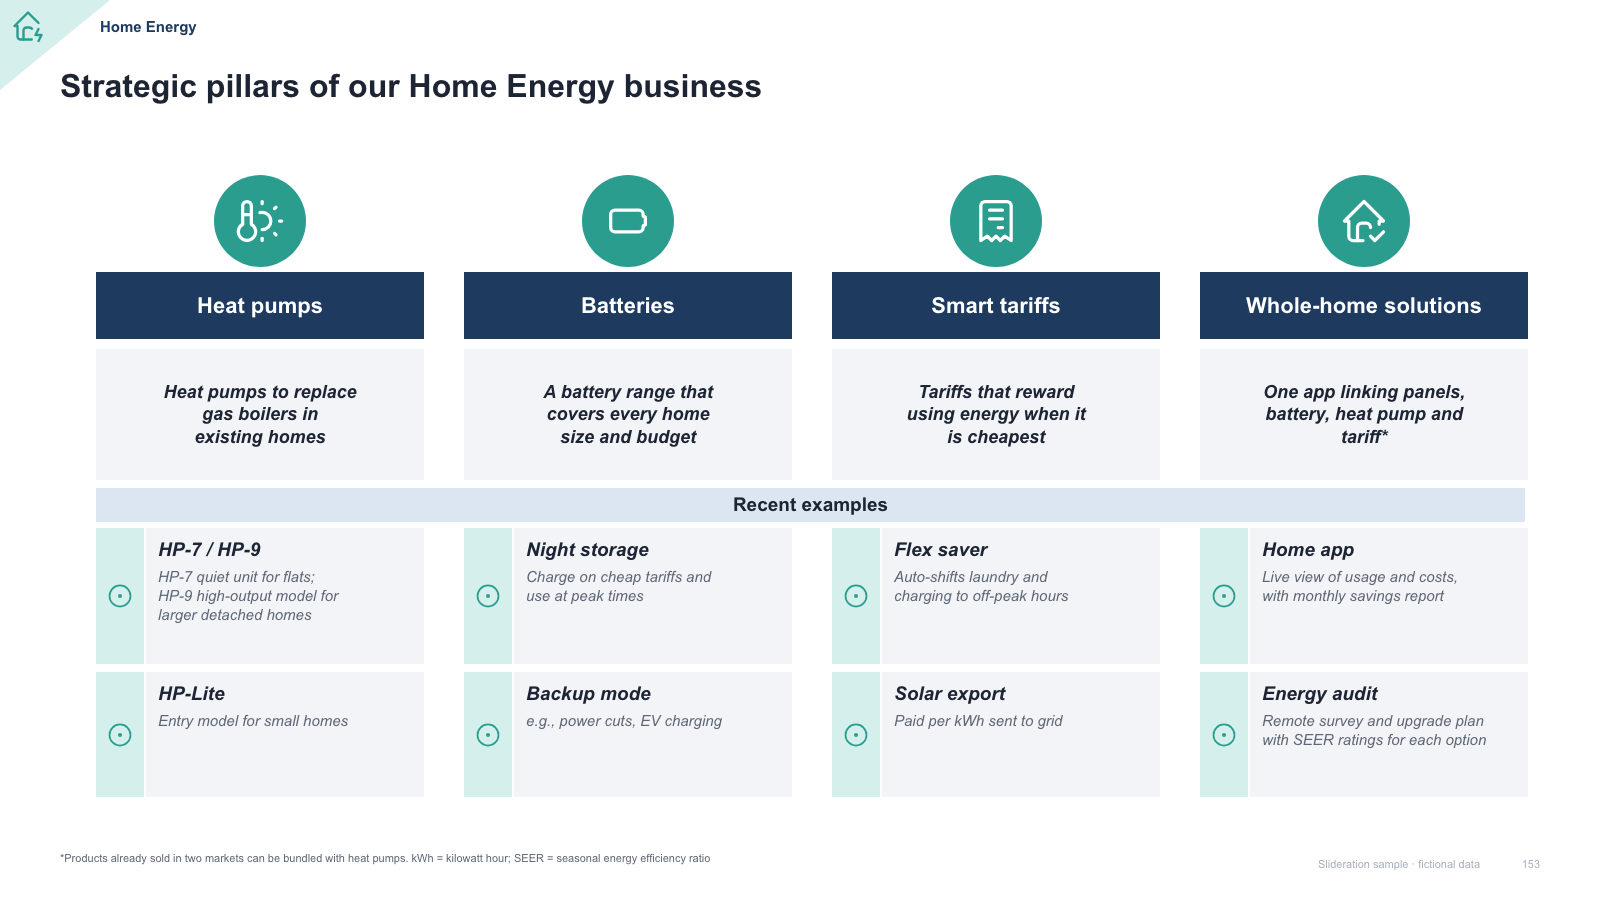
Four pillars with icon badges, headers, italic statements and a two-row example grid

Four pillars with icon badges, headers, italic statements and a two-row example grid

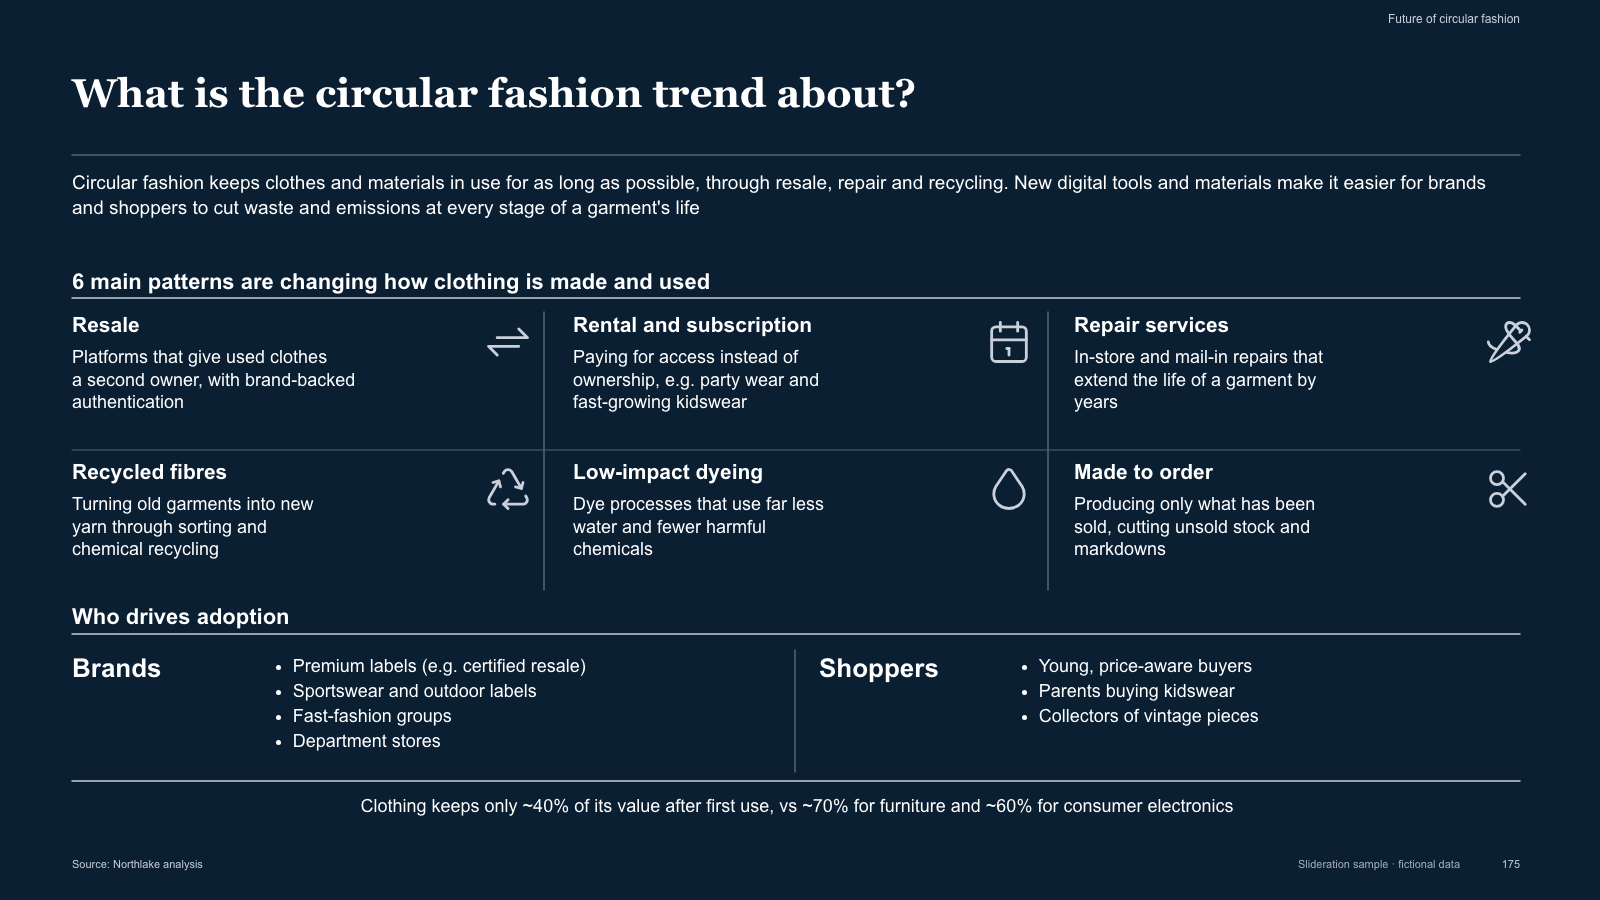
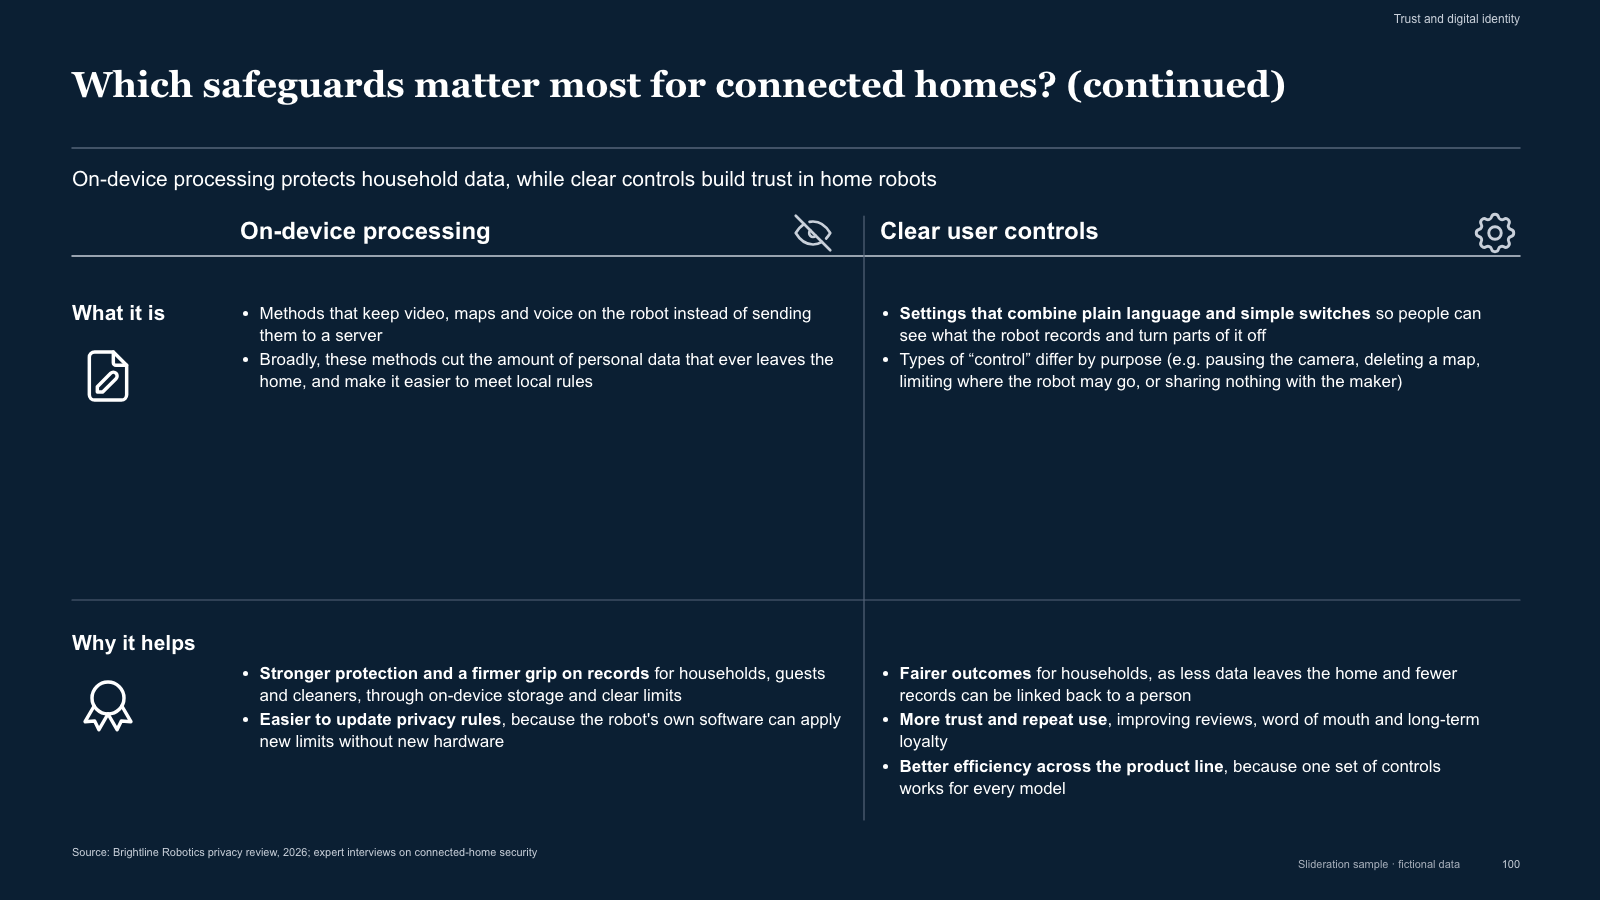
Dark explainer — intro, 3x2 pattern grid with icons, two-column type lists and summary line

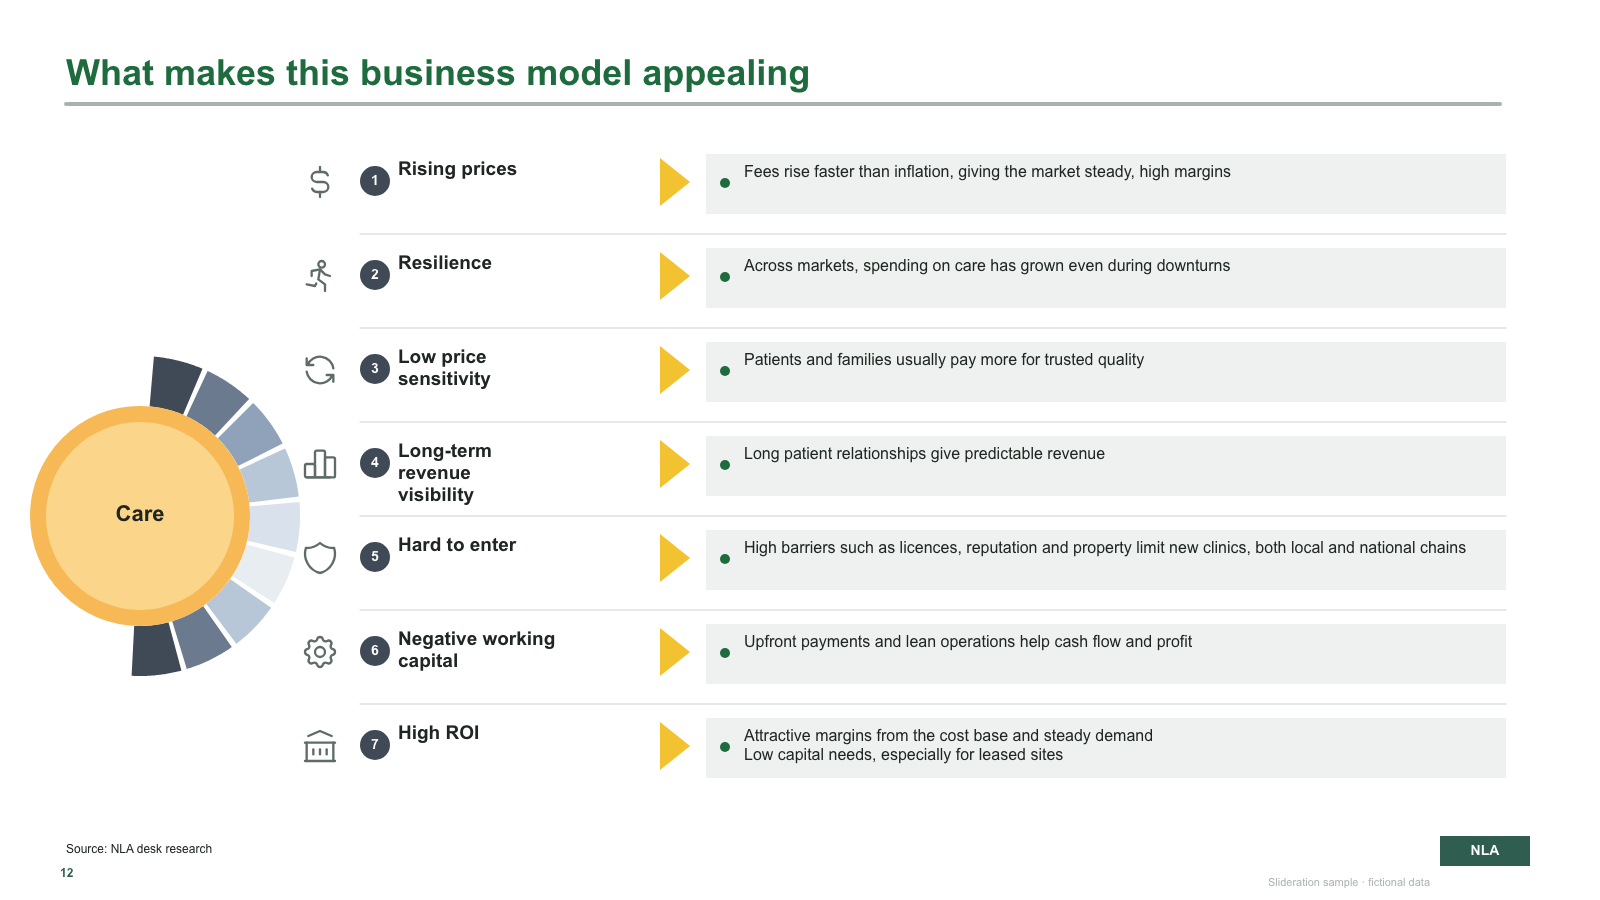
Dark explainer — intro, 3x2 pattern grid with icons, two-column type lists and summary line

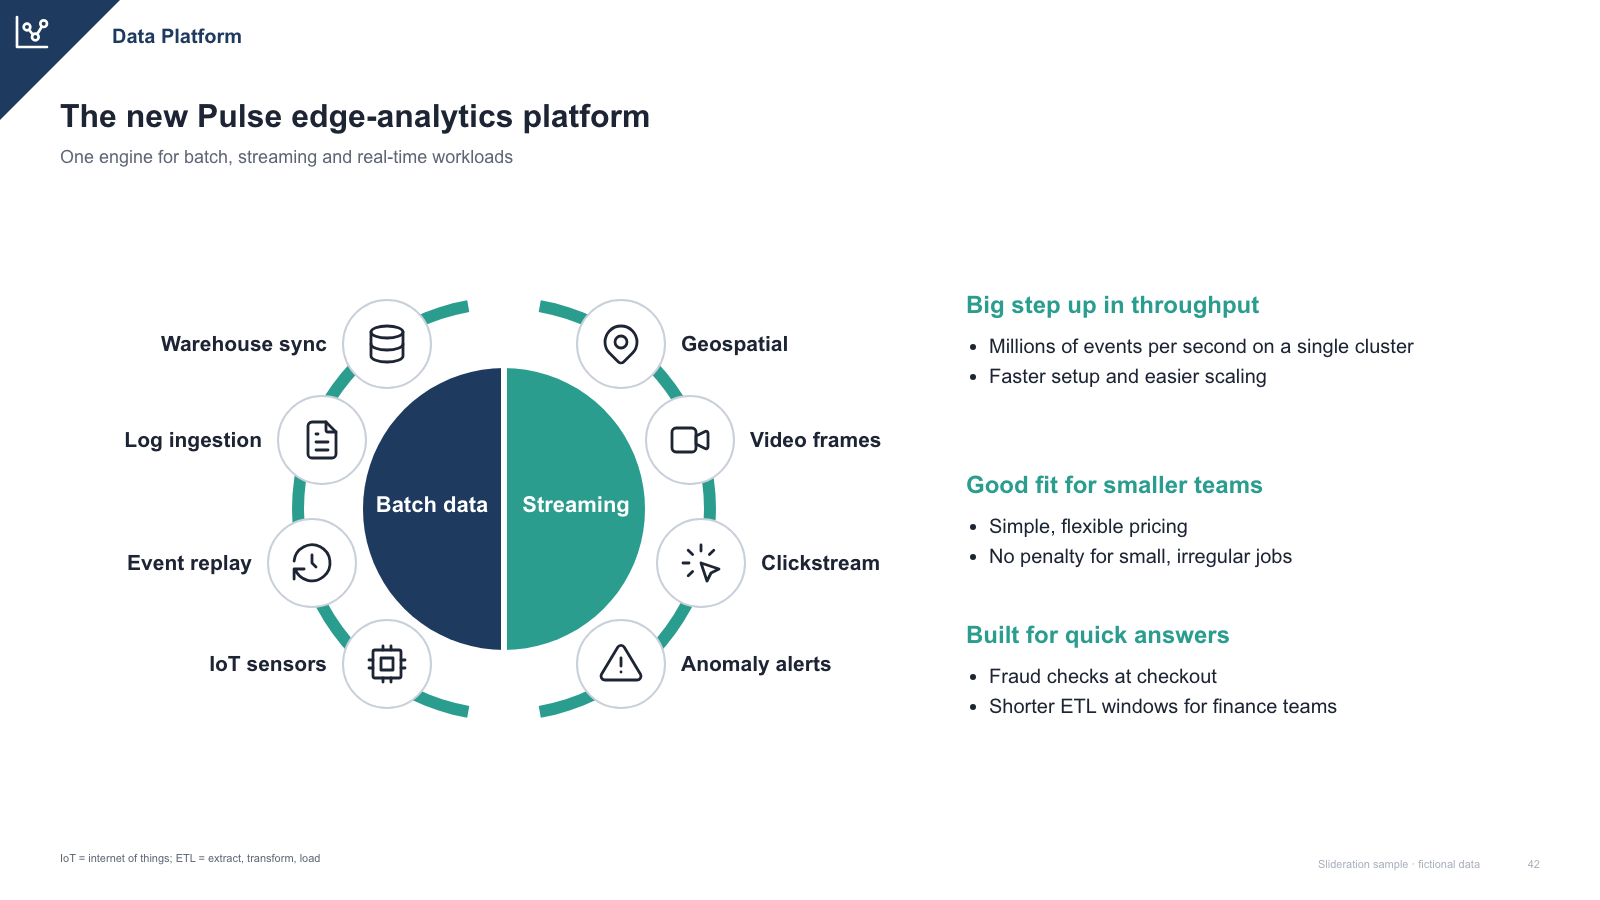
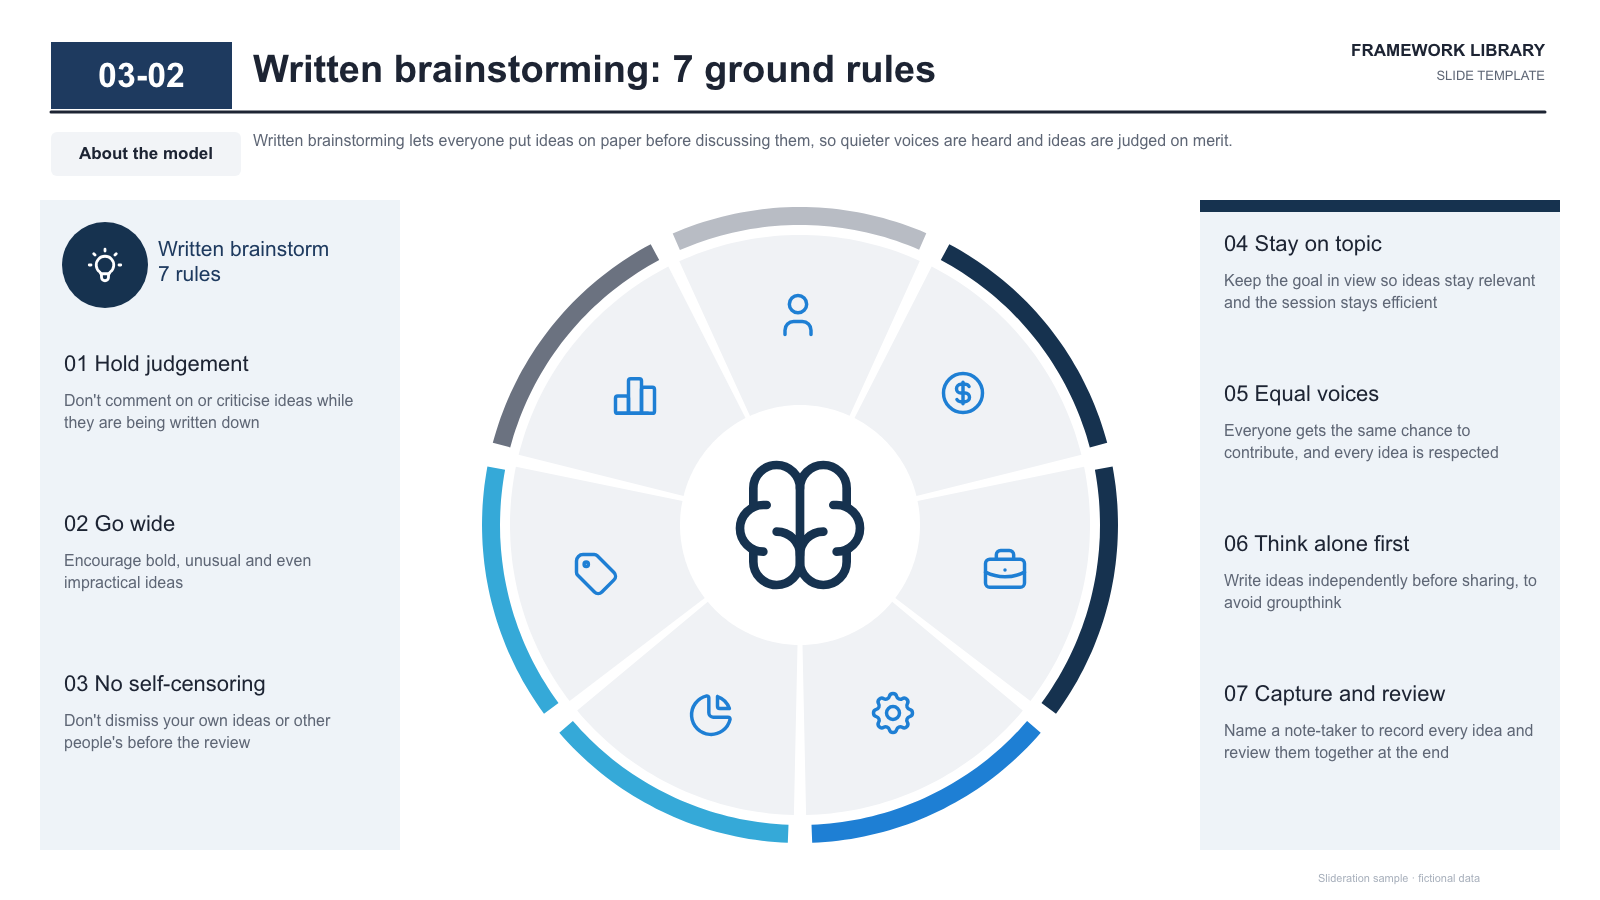
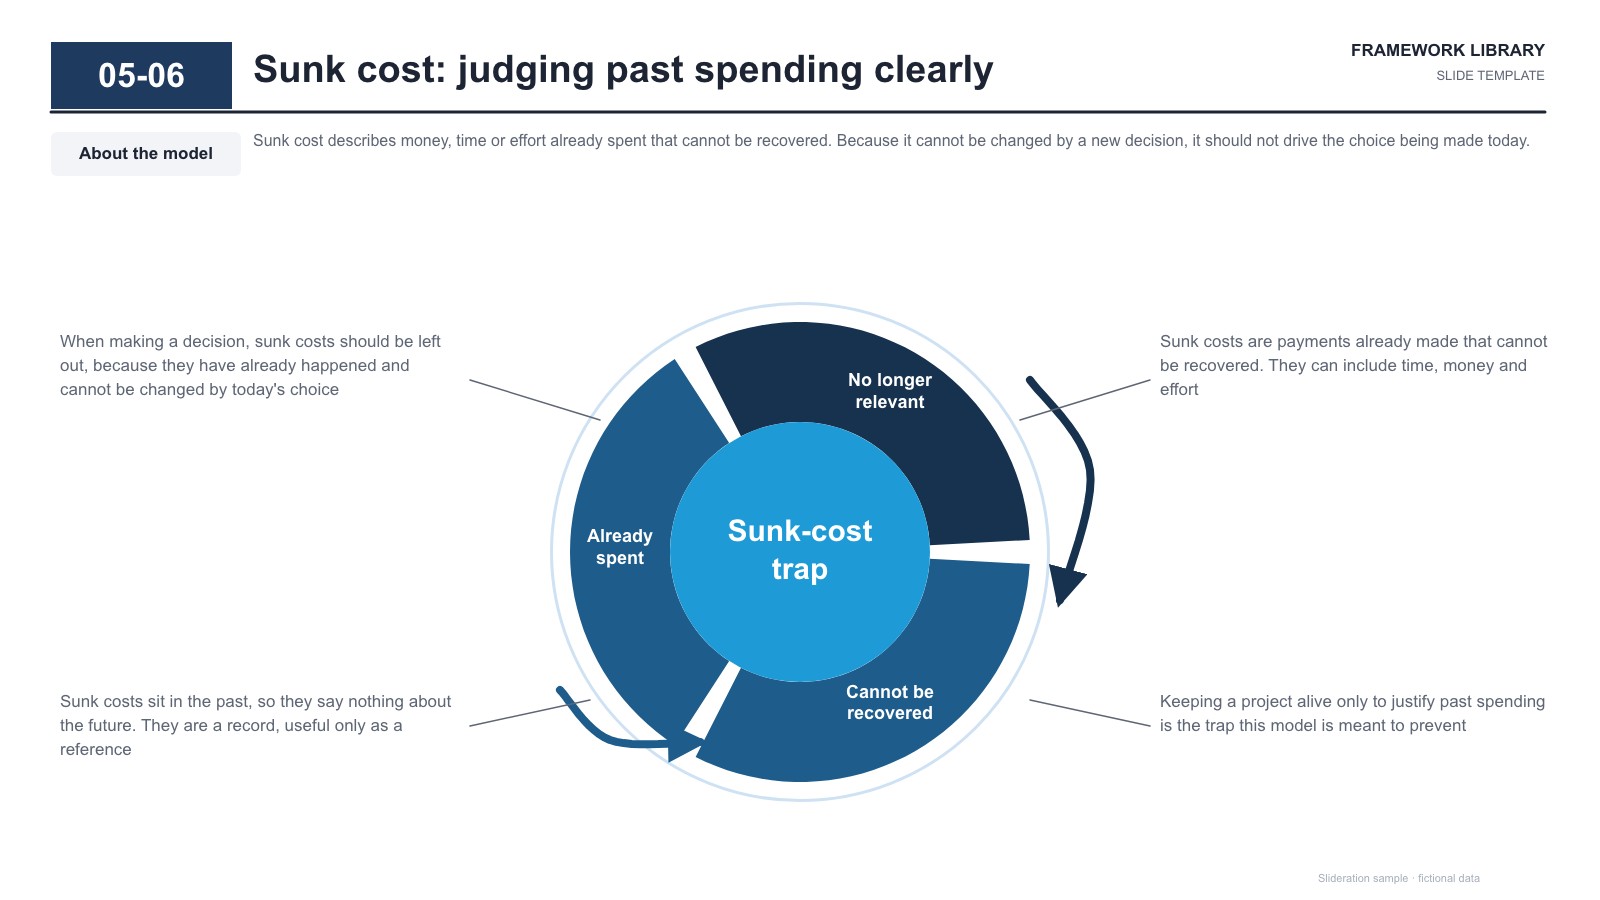
Split circle core with a ring of eight icon nodes and labels, plus three right-hand bullet groups

Split circle core with a ring of eight icon nodes and labels, plus three right-hand bullet groups

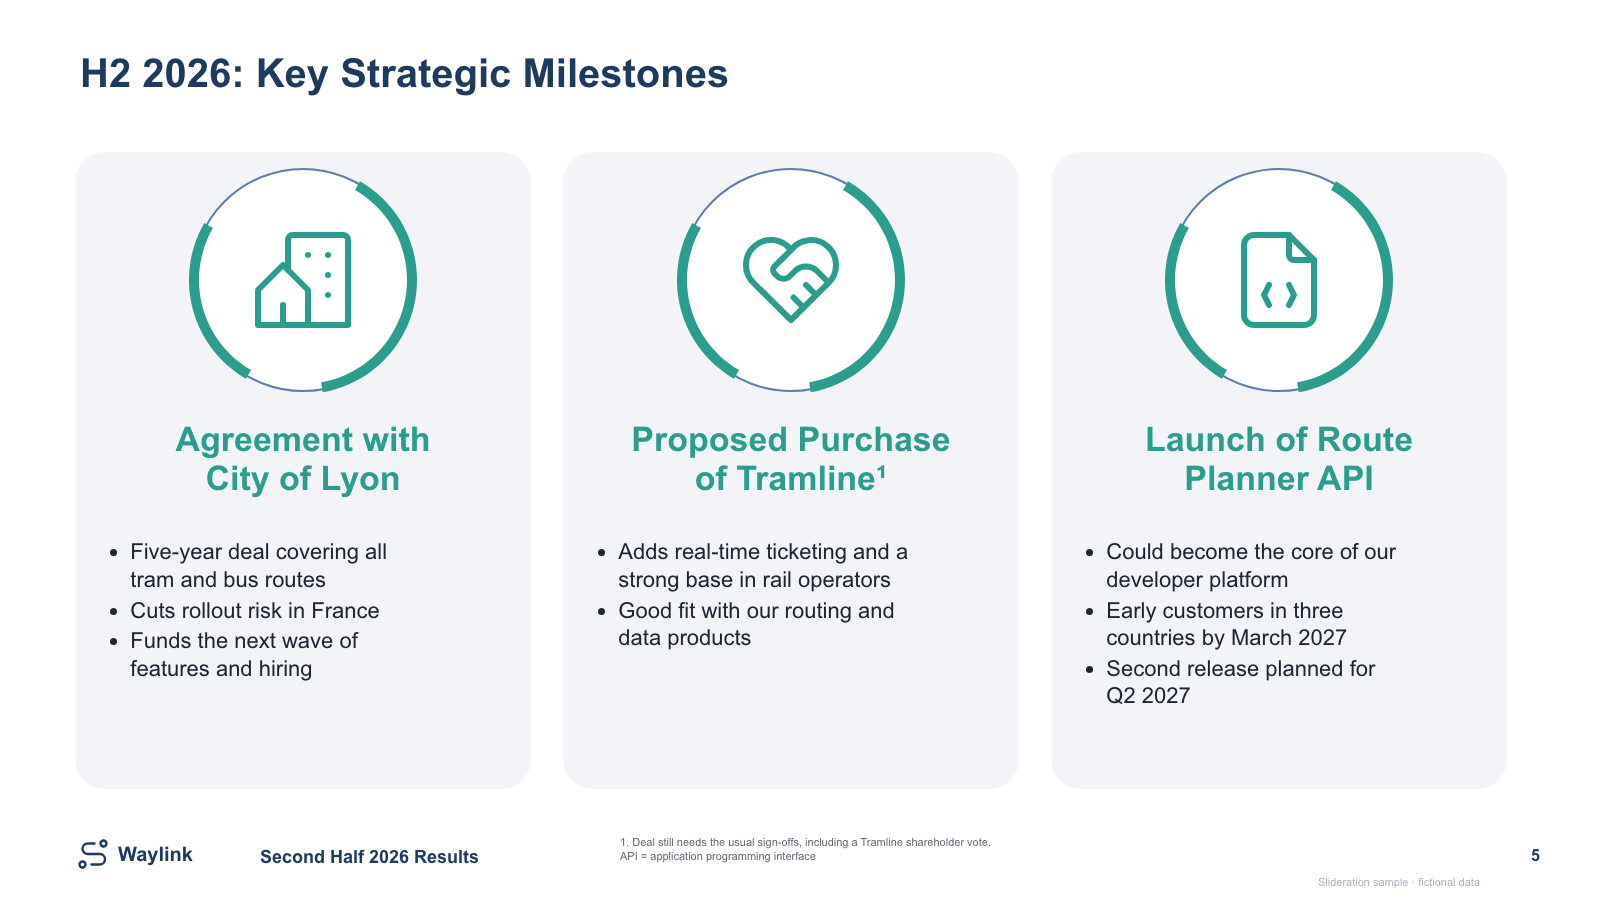
Three rounded milestone cards with ringed icon badges, two-line headers and bullets

Three rounded milestone cards with ringed icon badges, two-line headers and bullets

Free PPTX
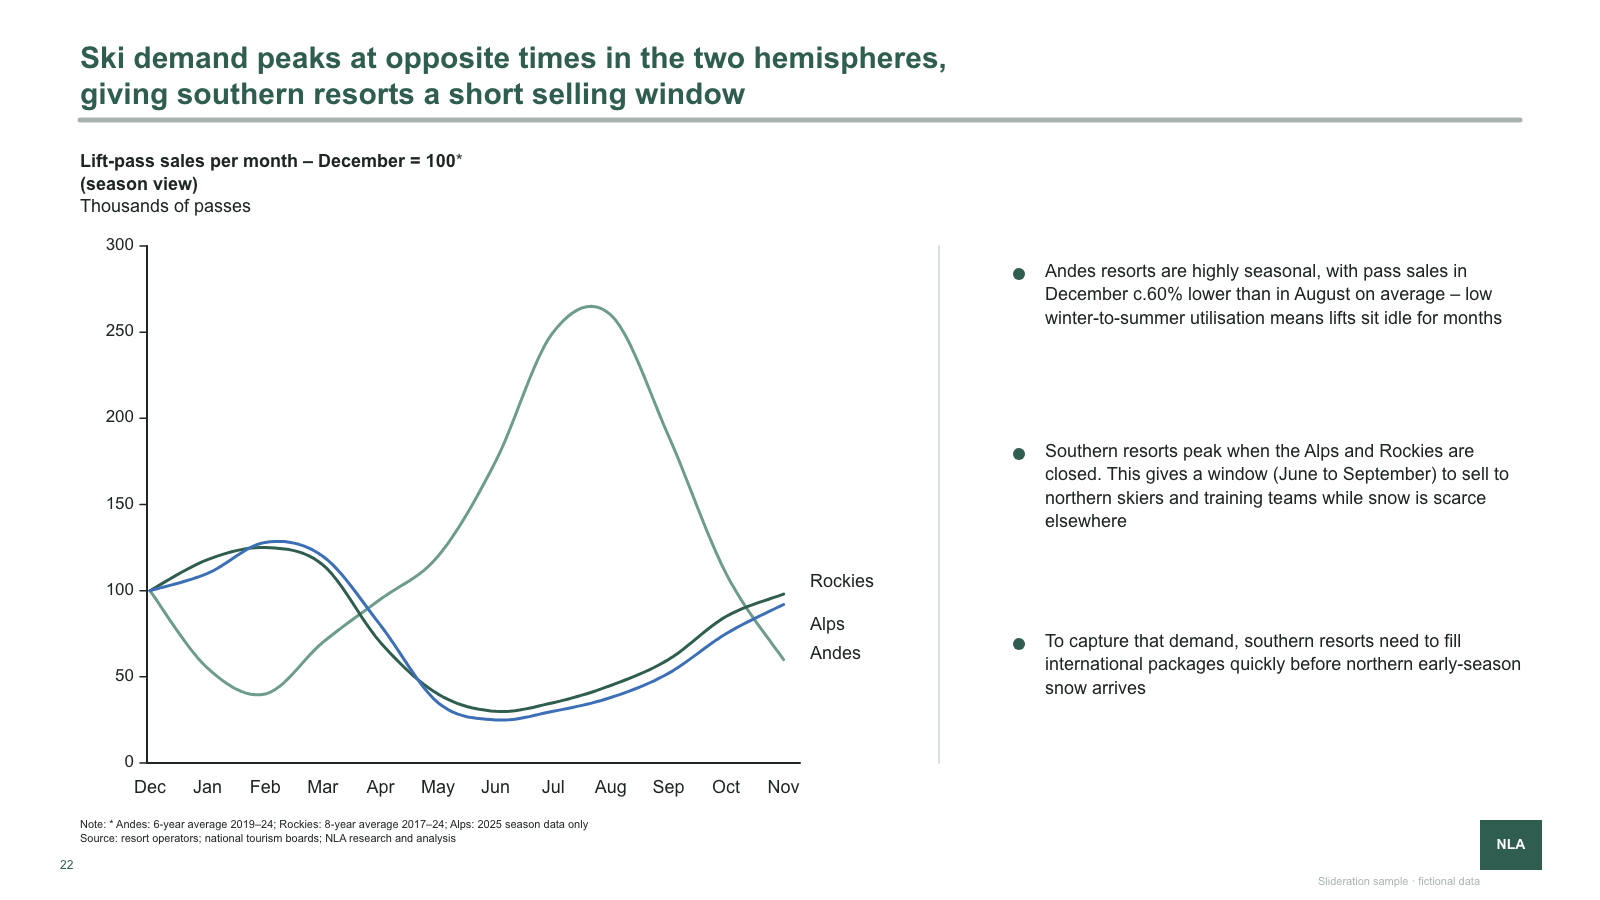
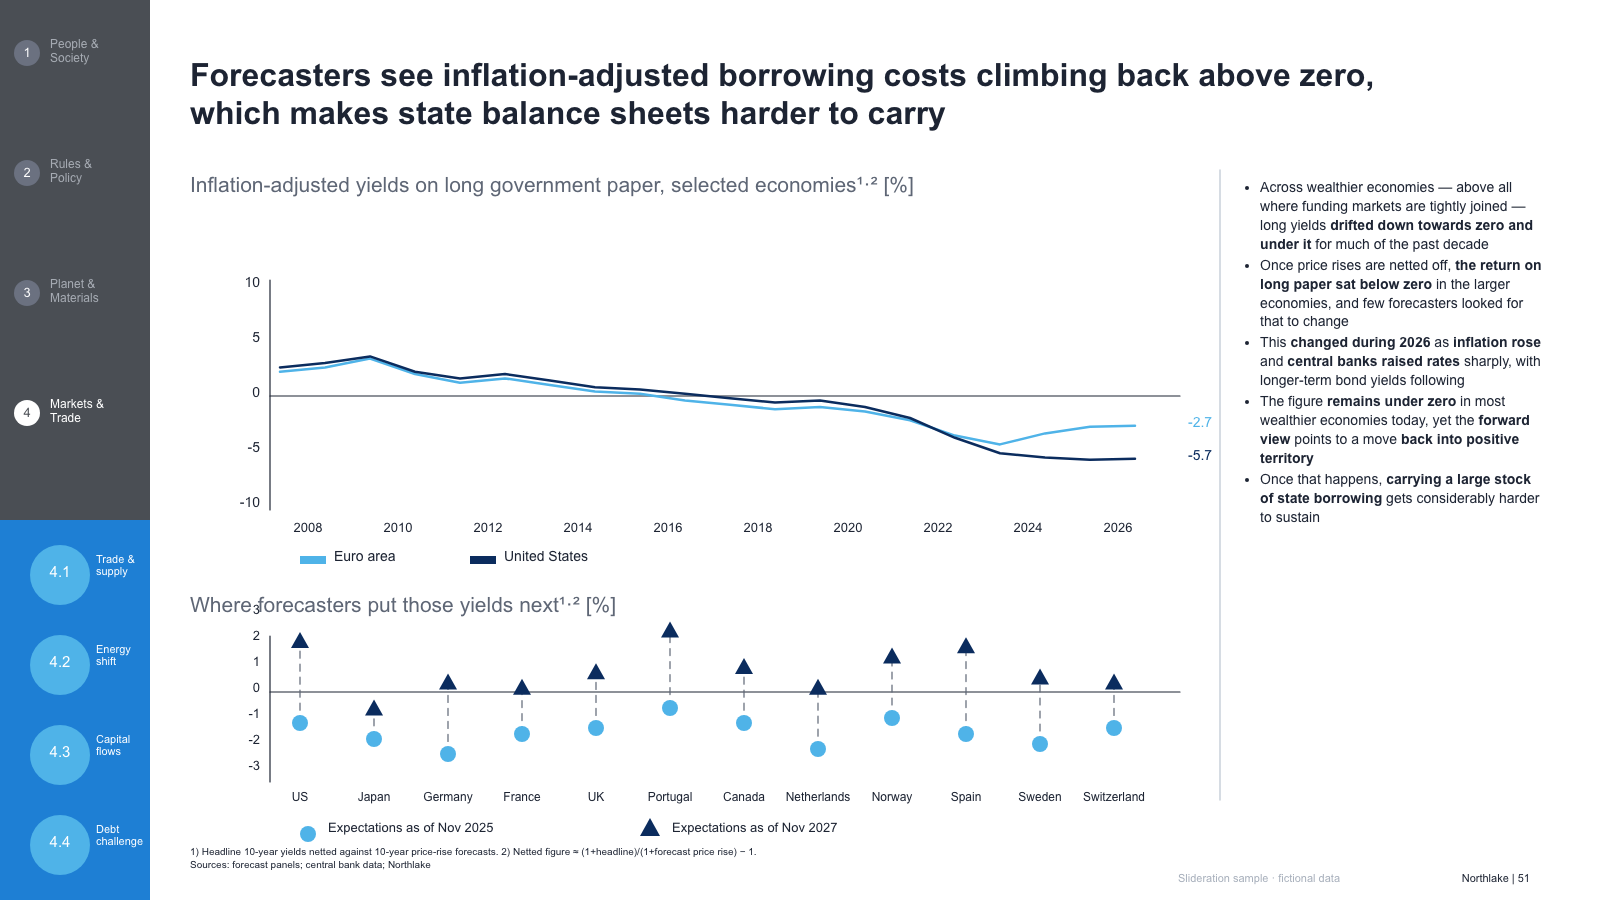
Multi-series monthly line chart with end labels and a right-hand commentary column

Multi-series monthly line chart with end labels and a right-hand commentary column

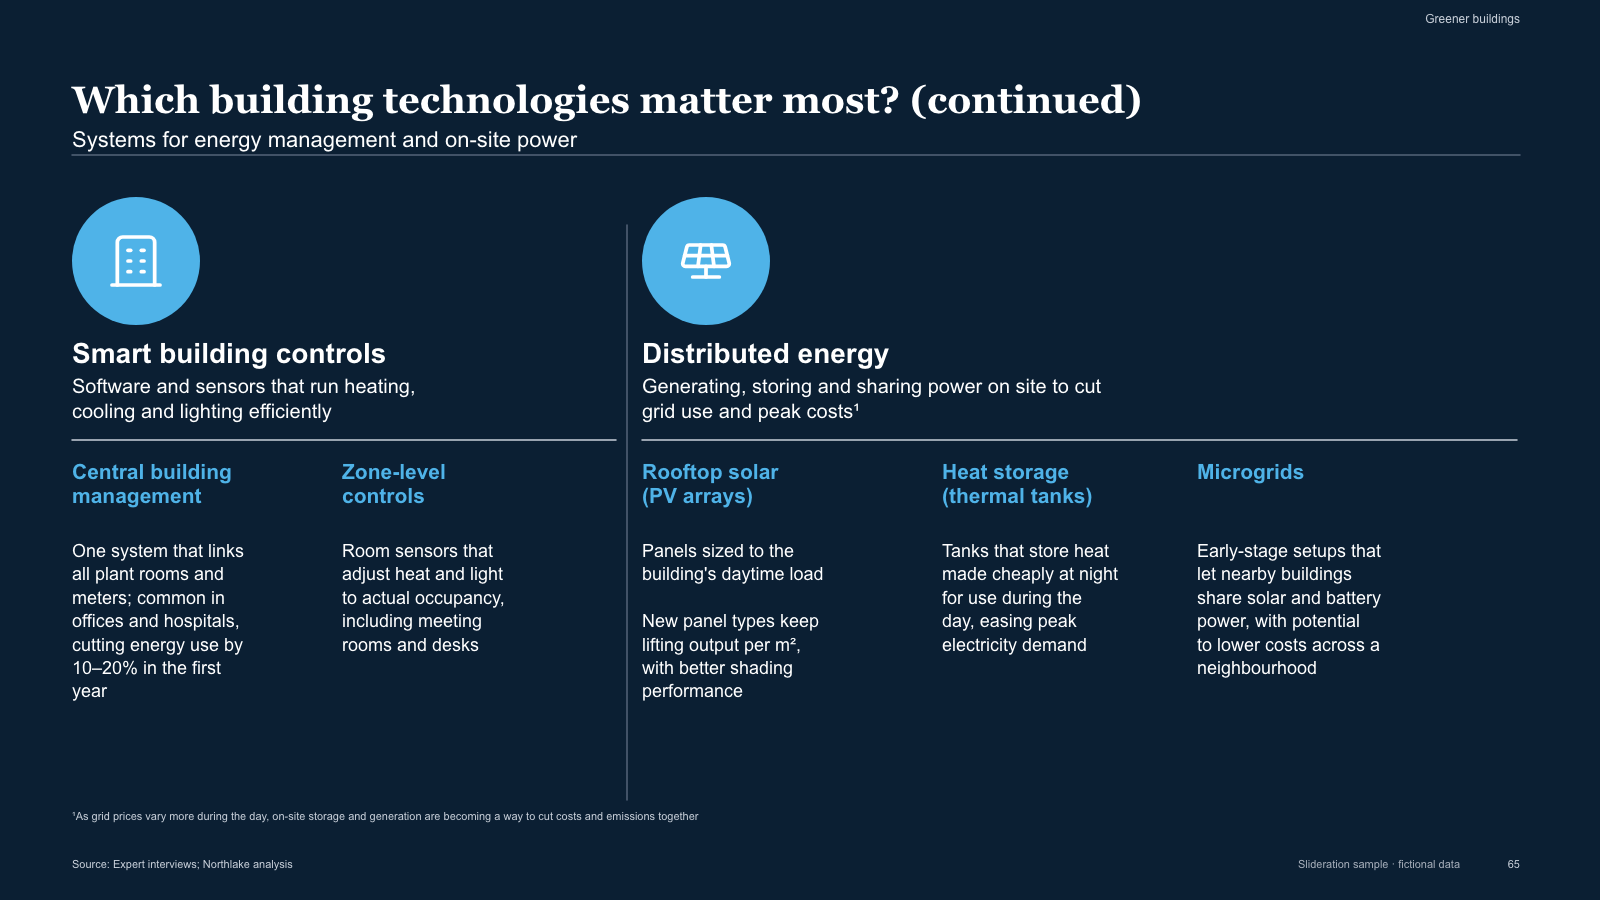
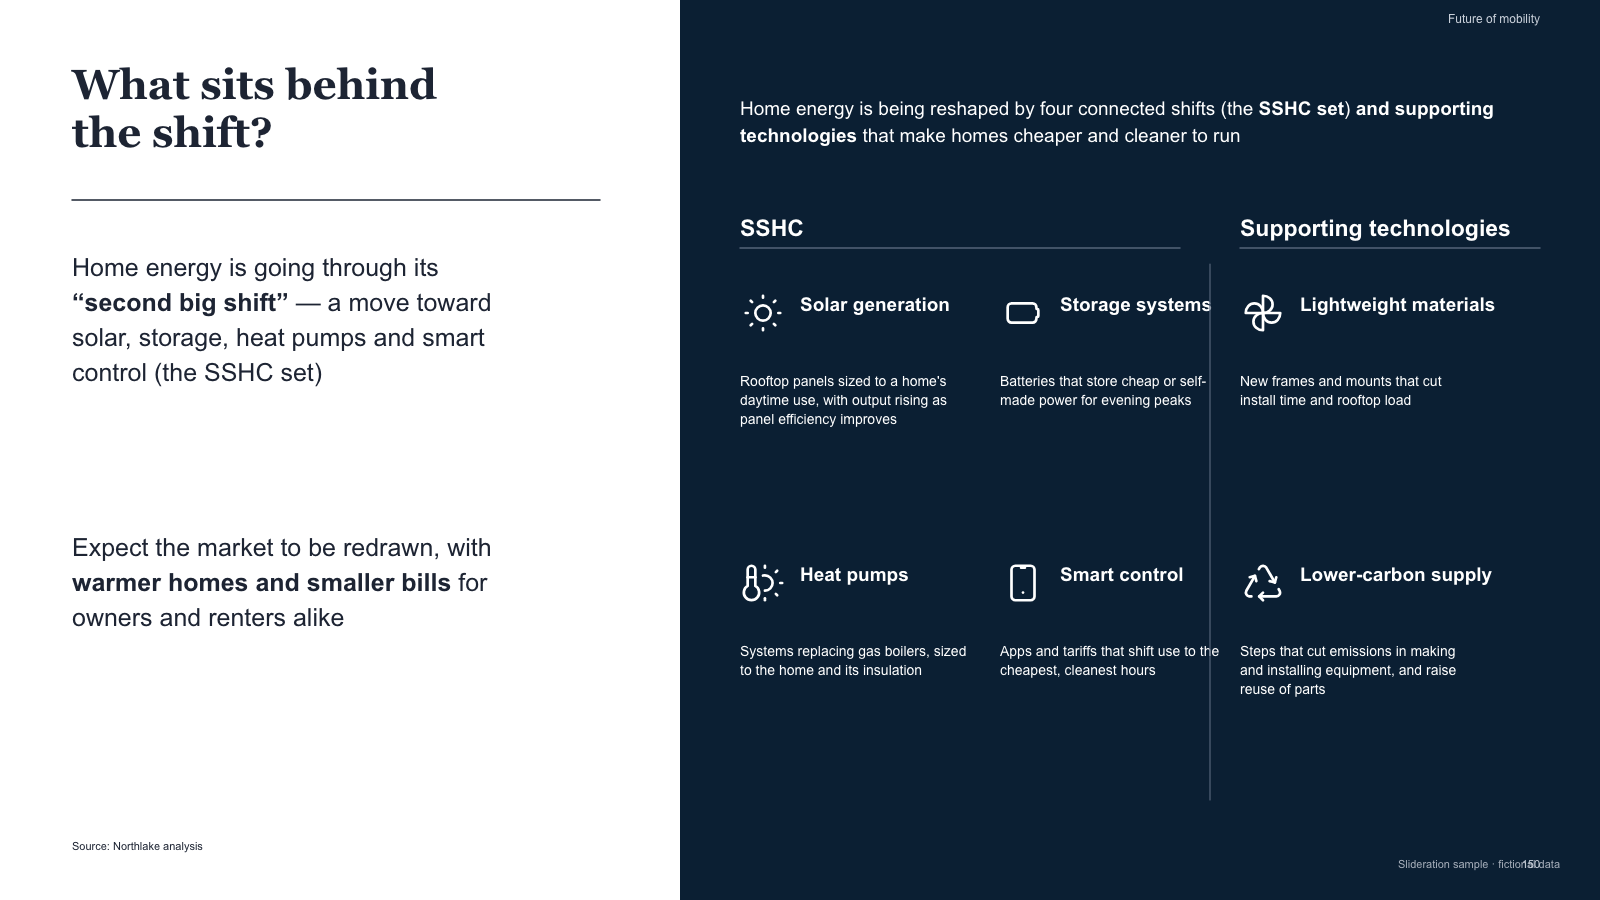
Dark two-section technology explainer with icon badges, headings and 2 + 3 sub-columns

Dark two-section technology explainer with icon badges, headings and 2 + 3 sub-columns

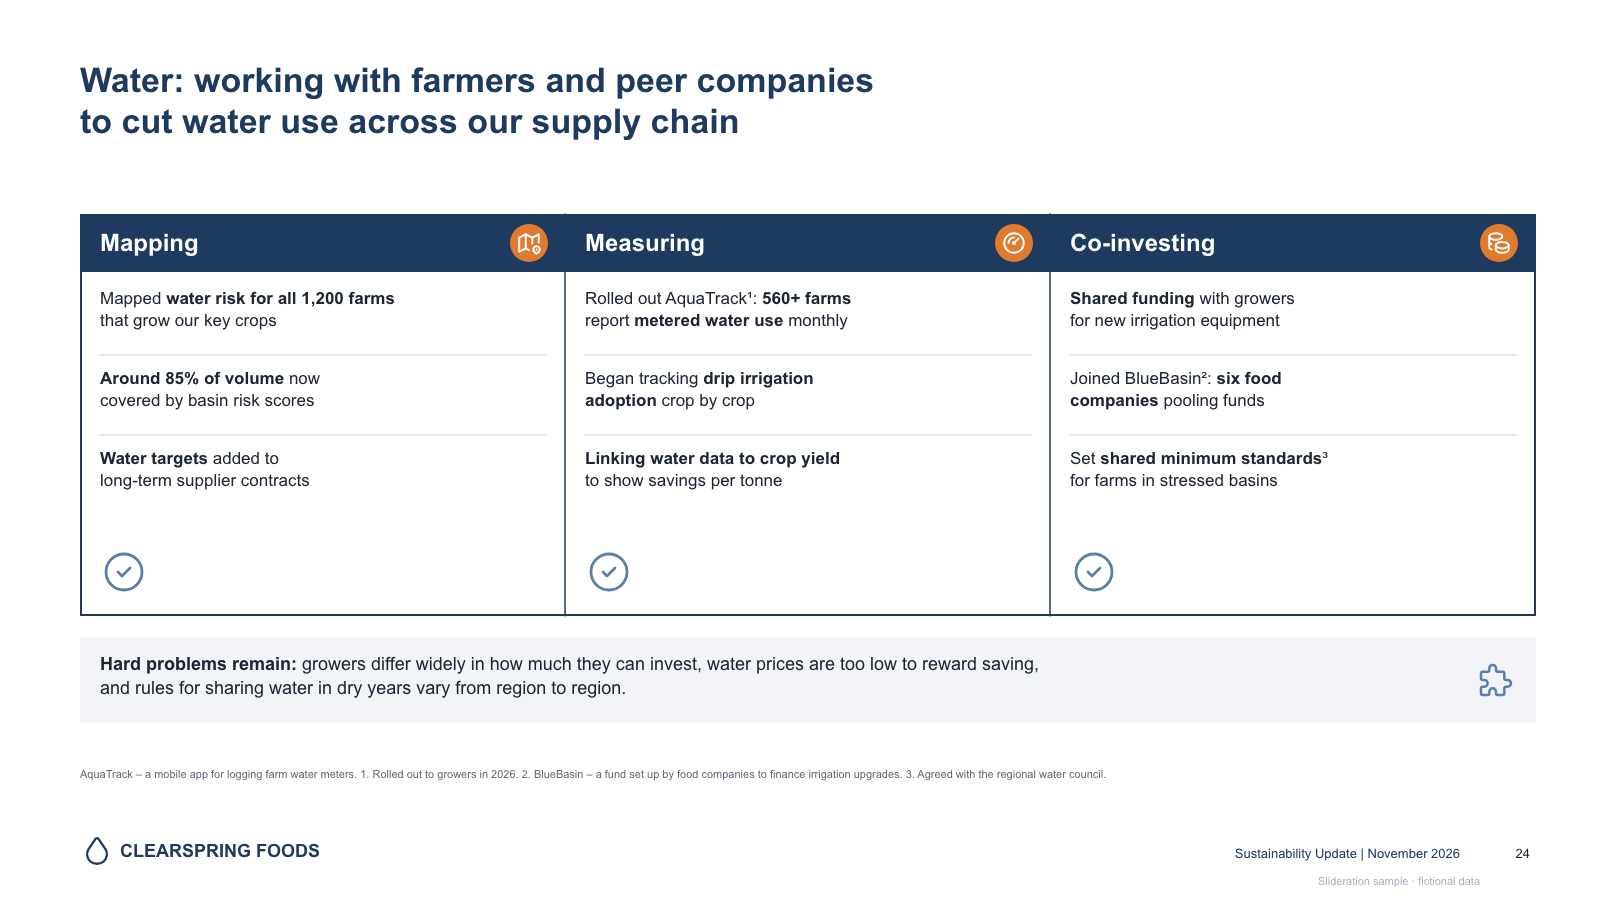
Three-column engagement table with icon headers, row dividers, check marks and a challenges bar

Three-column engagement table with icon headers, row dividers, check marks and a challenges bar

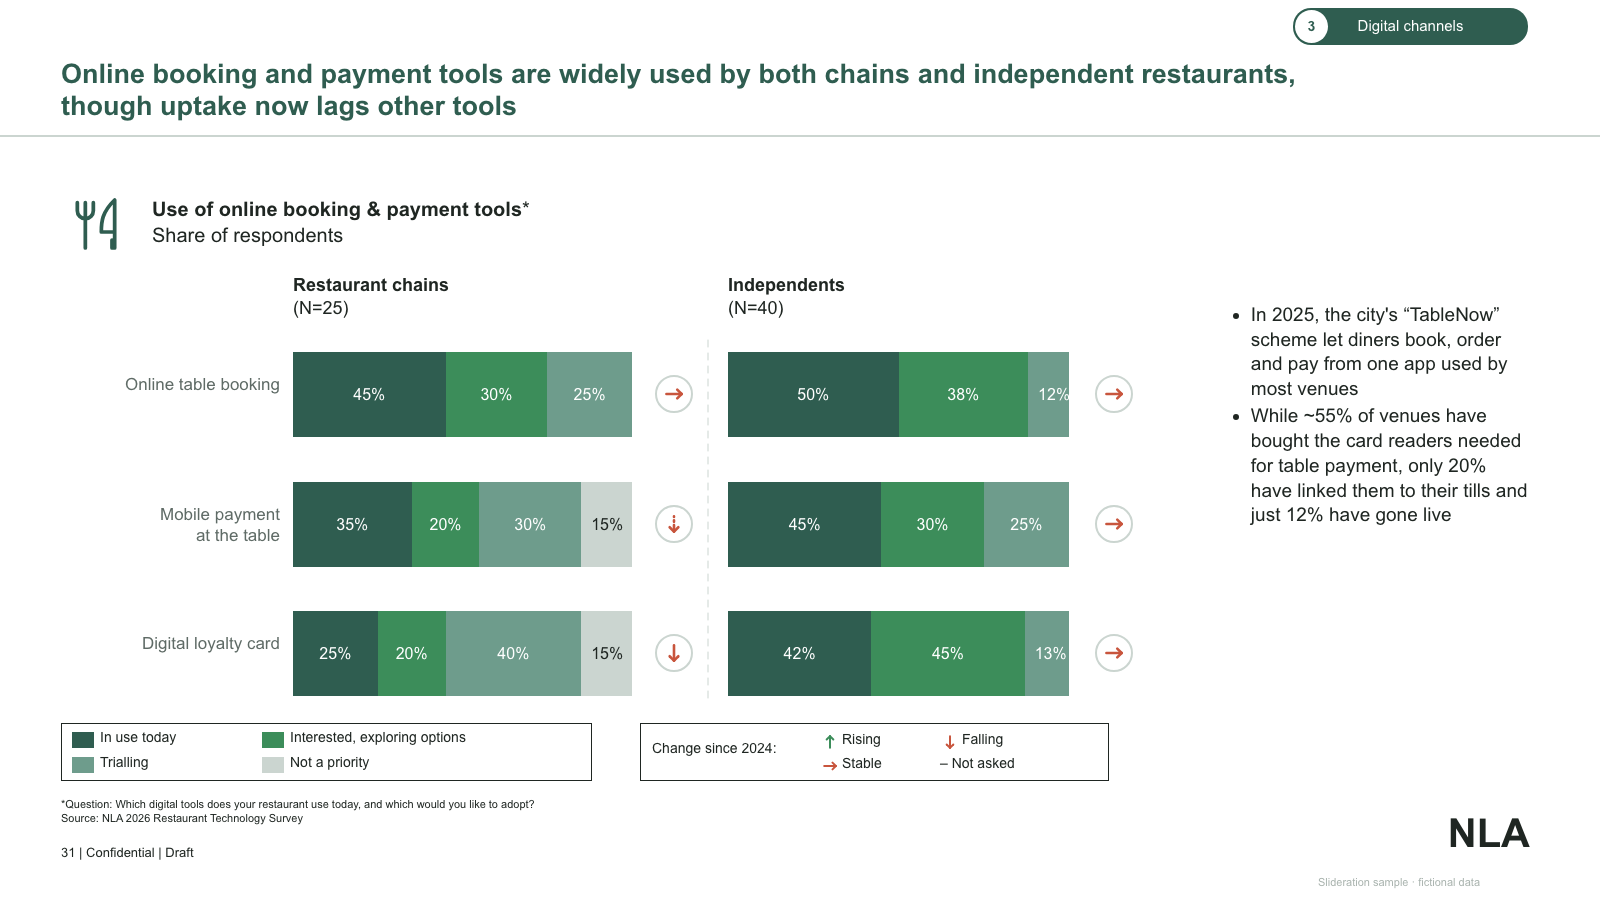
Two groups of 100% stacked horizontal bars with trend arrows, legends and side commentary

Two groups of 100% stacked horizontal bars with trend arrows, legends and side commentary

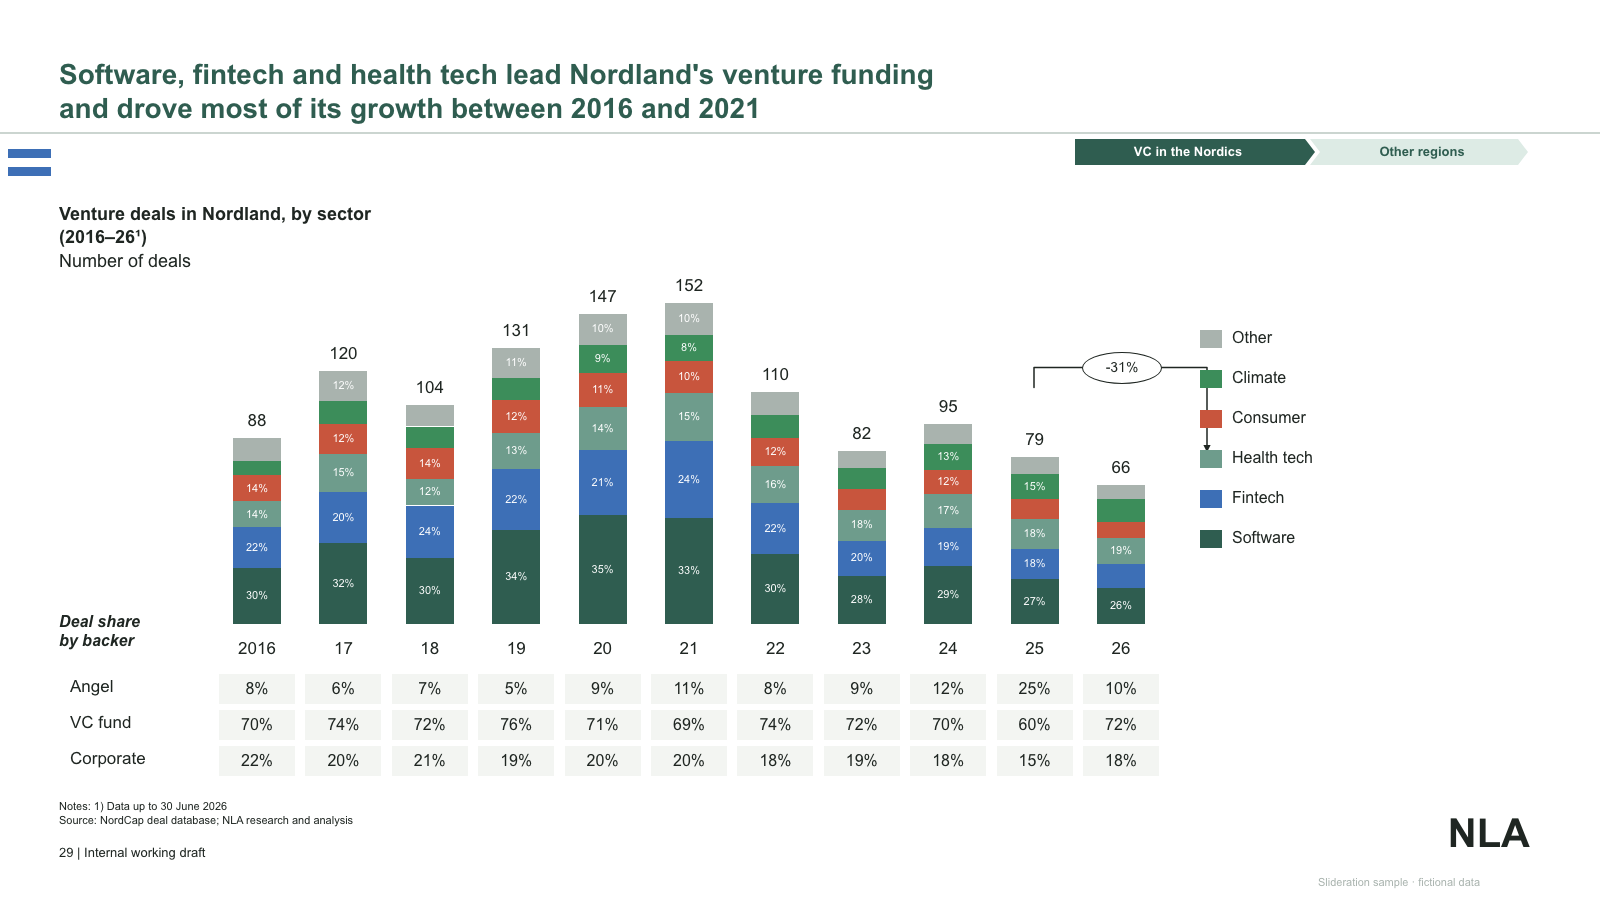
Stacked column chart by year with totals, a change bracket, category legend and investor-mix table

Stacked column chart by year with totals, a change bracket, category legend and investor-mix table

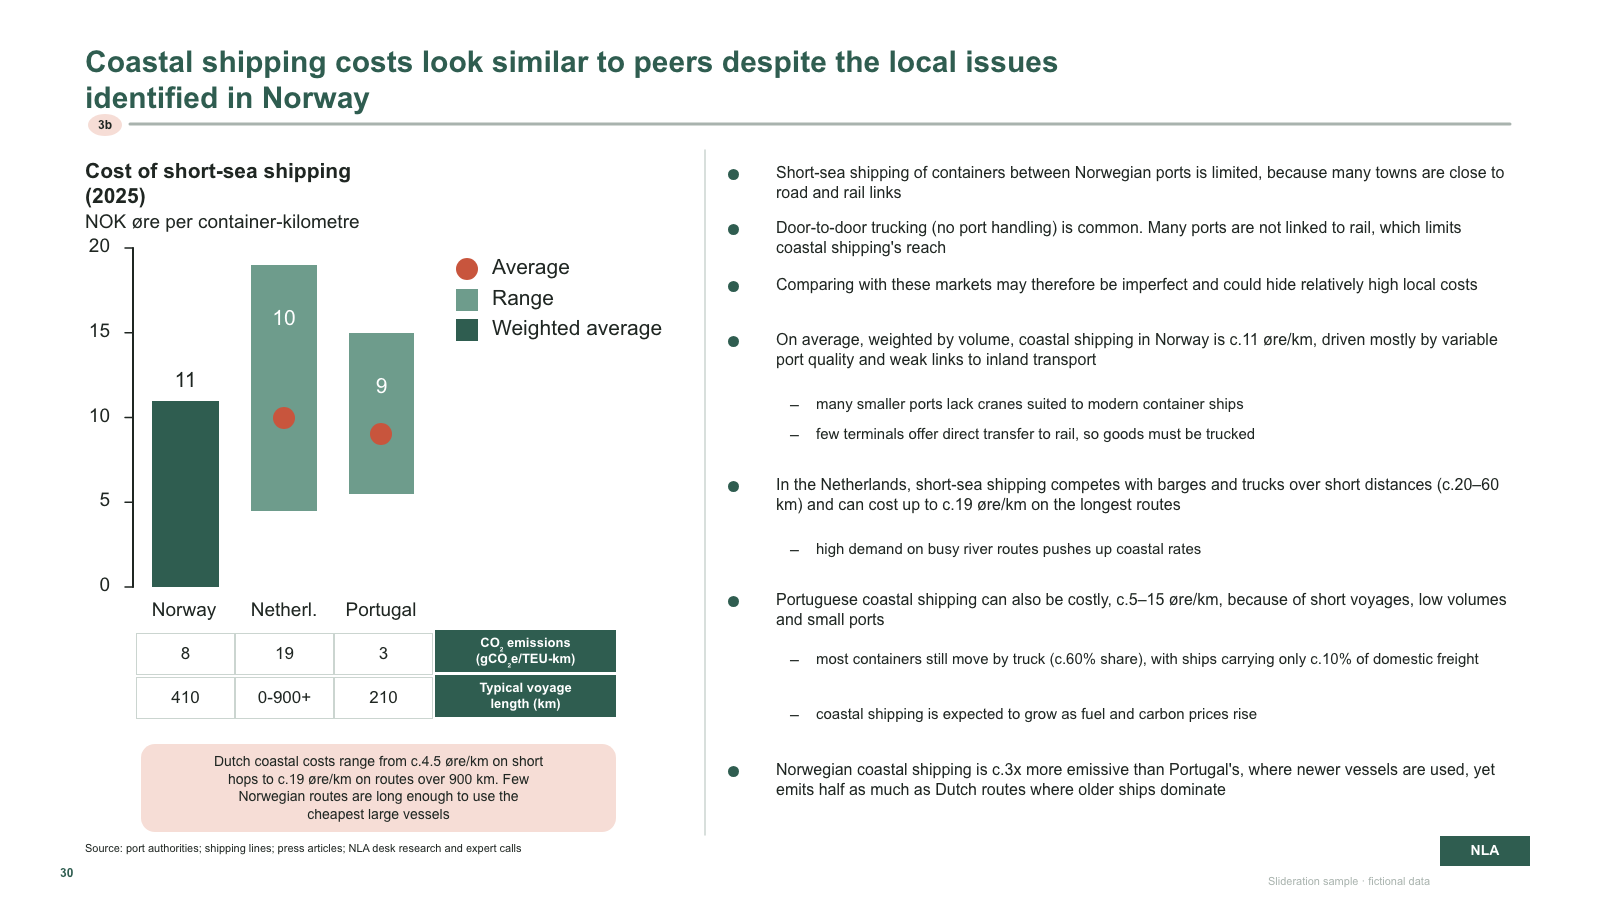
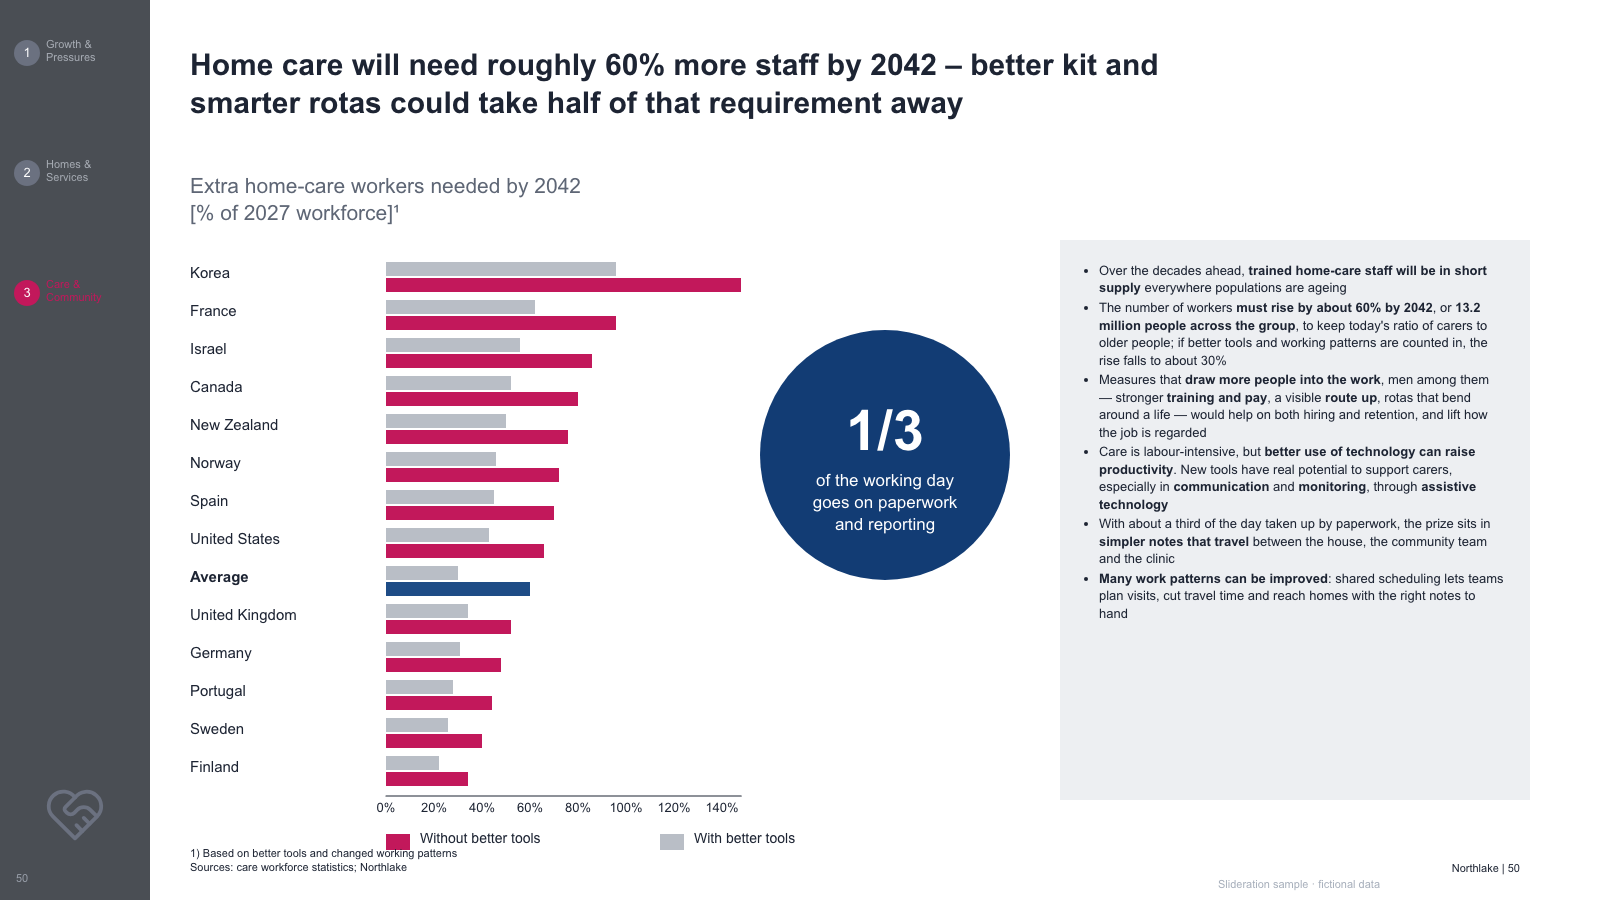
Benchmark bar + range chart with legend, data table and callout, next to a long bullet commentary

Benchmark bar + range chart with legend, data table and callout, next to a long bullet commentary

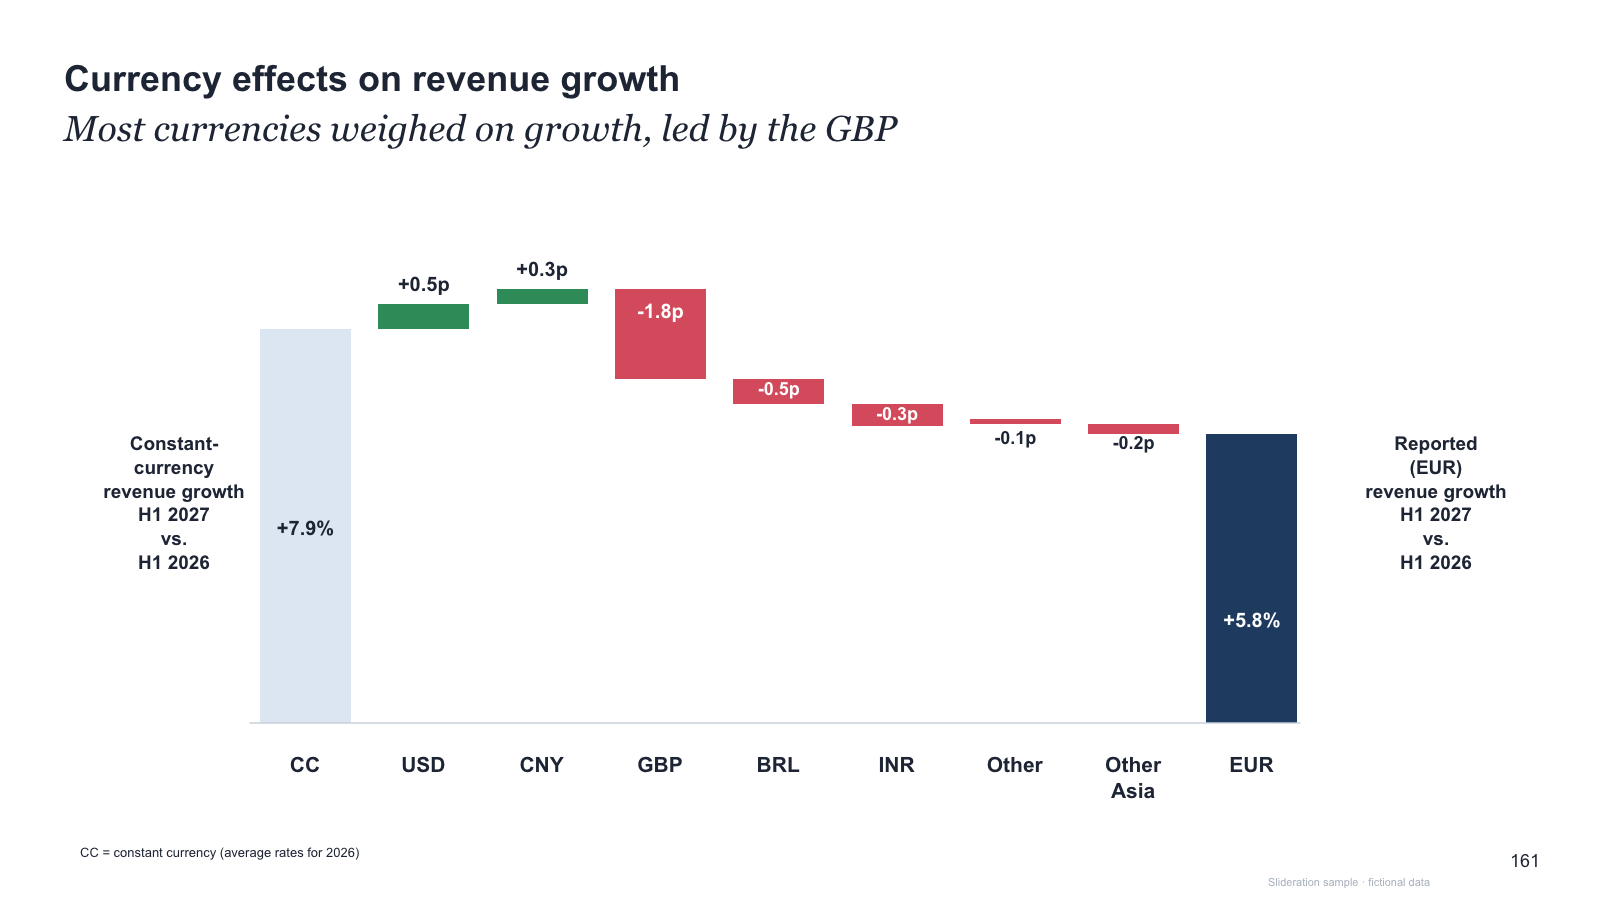
Currency-bridge waterfall with side labels for start and end growth rates

Currency-bridge waterfall with side labels for start and end growth rates

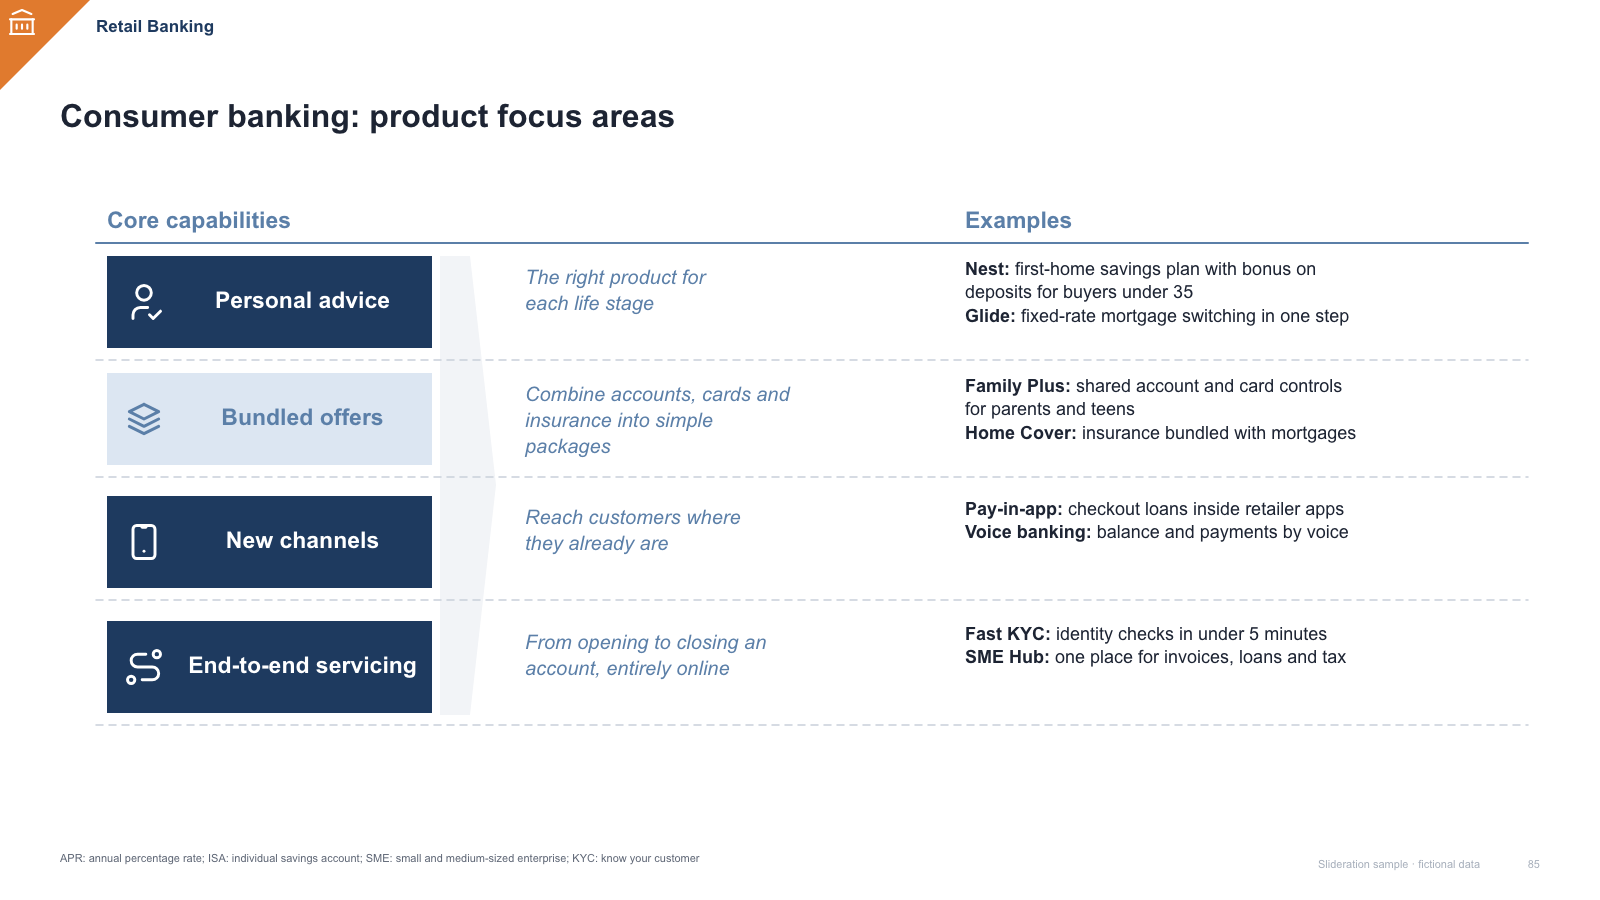
Capability table — icon label boxes, italic descriptors behind a wedge, and bold-led examples

Capability table — icon label boxes, italic descriptors behind a wedge, and bold-led examples

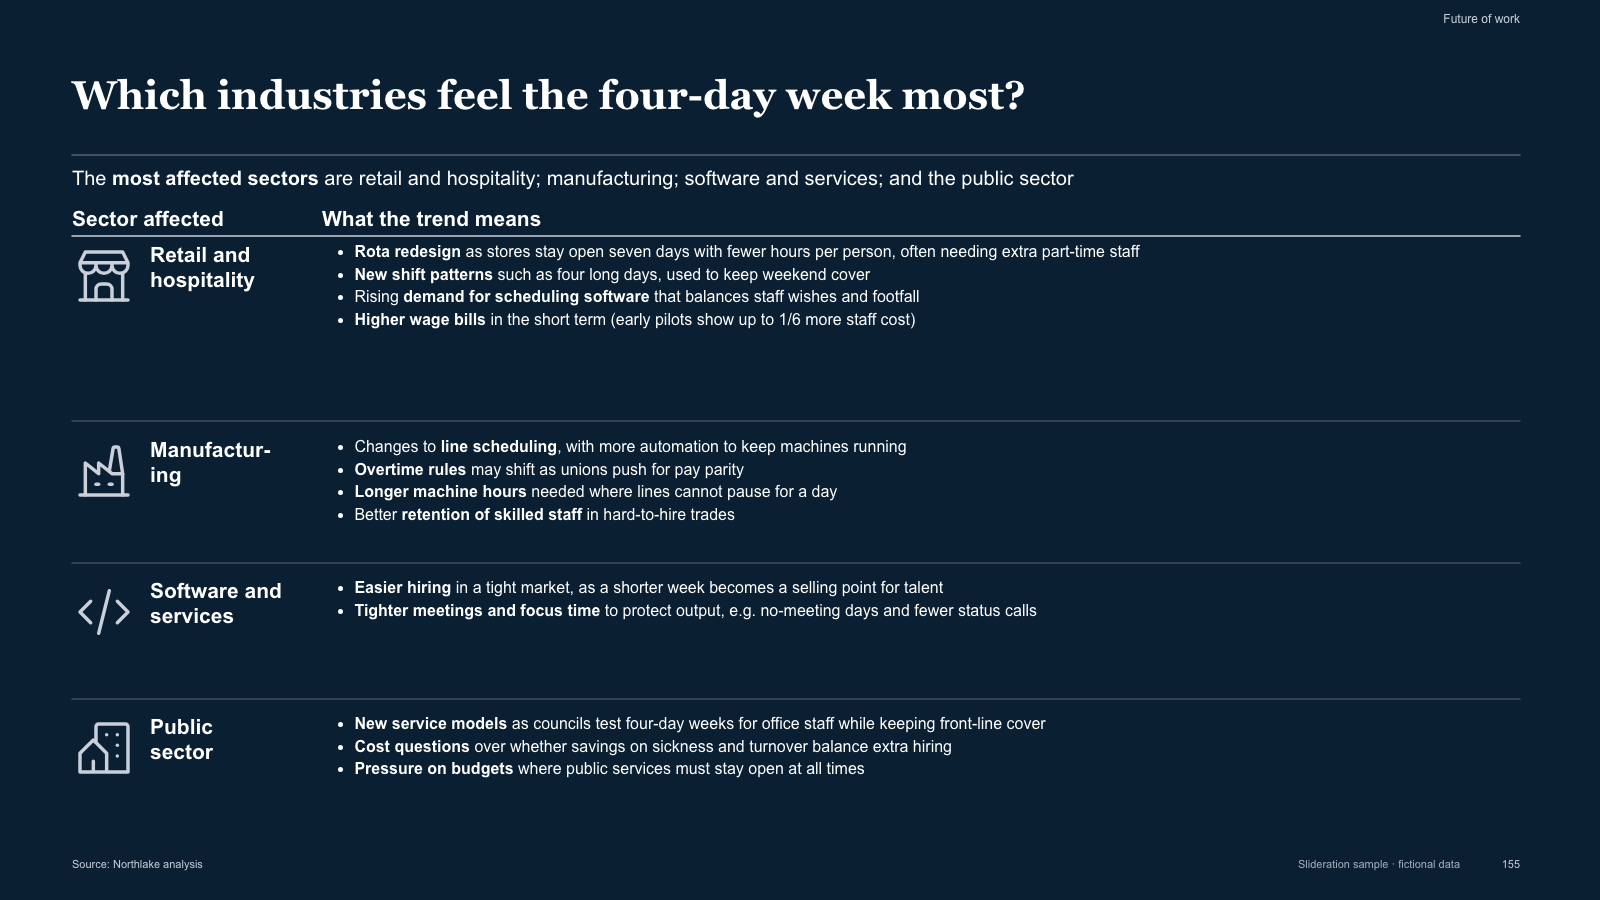
Dark two-column impact table — icon + industry label and bold-led implication bullets

Dark two-column impact table — icon + industry label and bold-led implication bullets

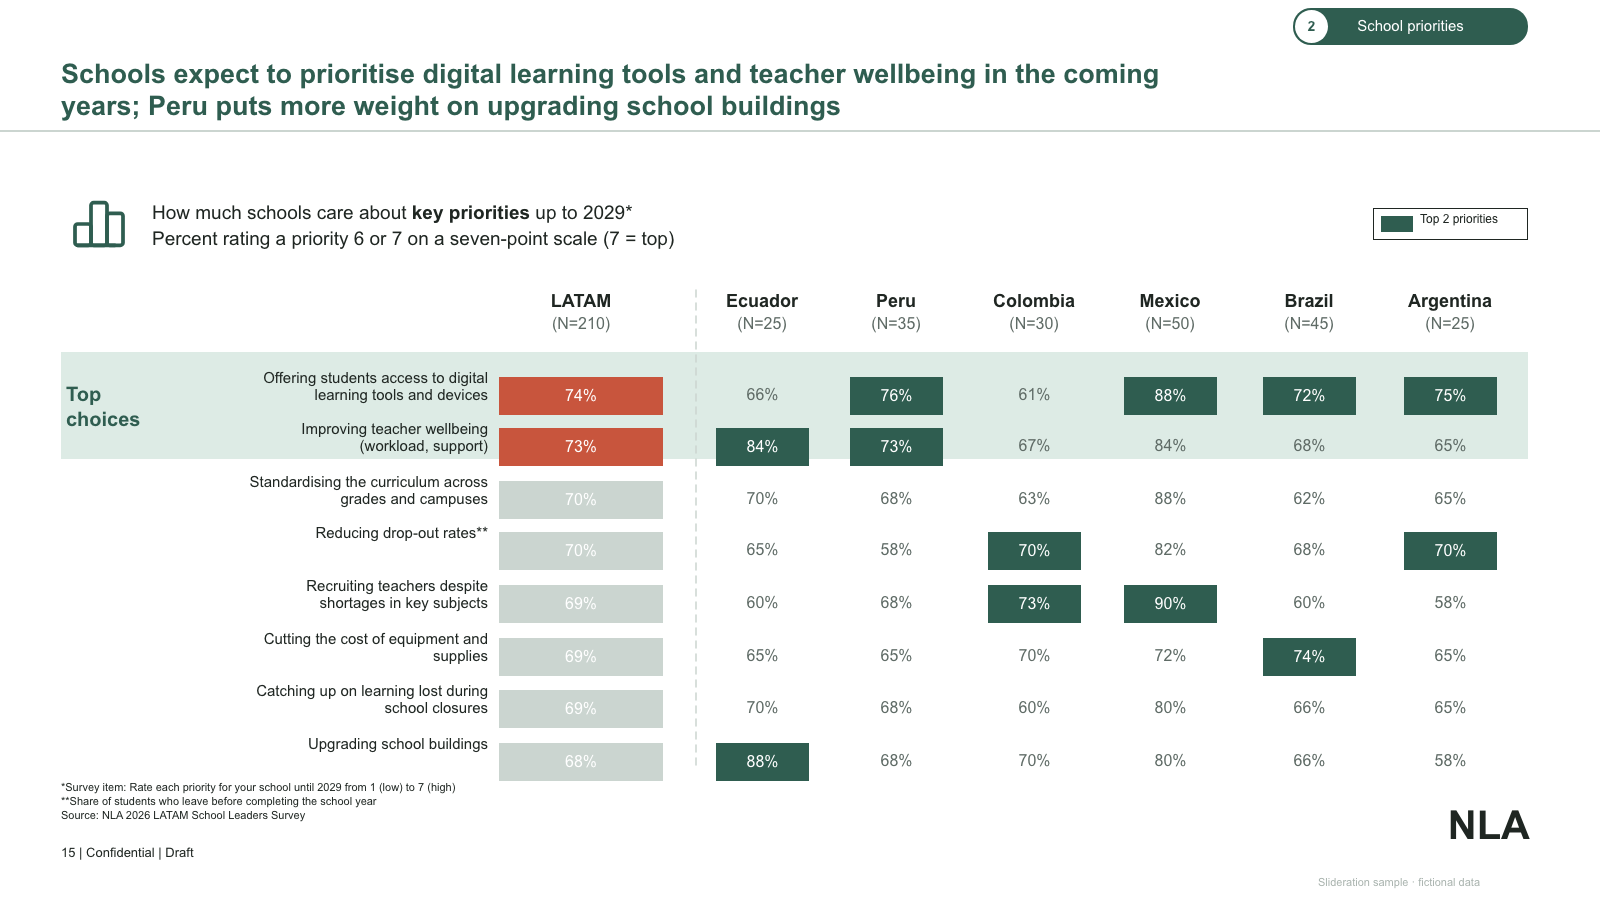
Heatmap-style priority table — regional column plus country columns with top-2 highlighting

Heatmap-style priority table — regional column plus country columns with top-2 highlighting

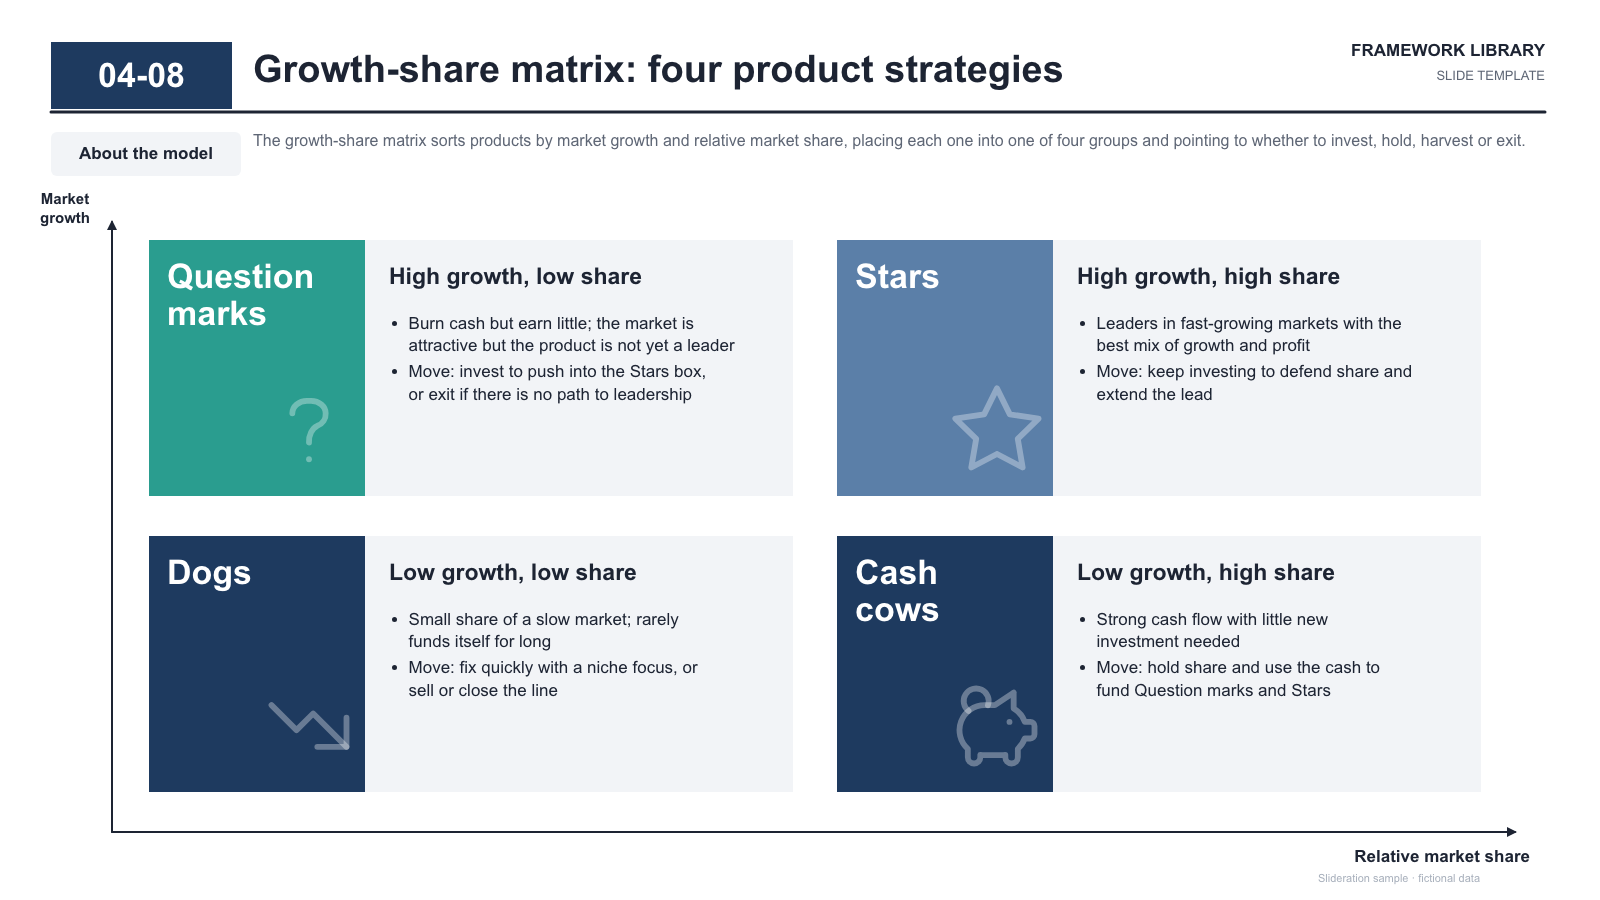
Growth-share 2x2 matrix — coloured label tiles with watermark icons and strategy panels on axes

Growth-share 2x2 matrix — coloured label tiles with watermark icons and strategy panels on axes

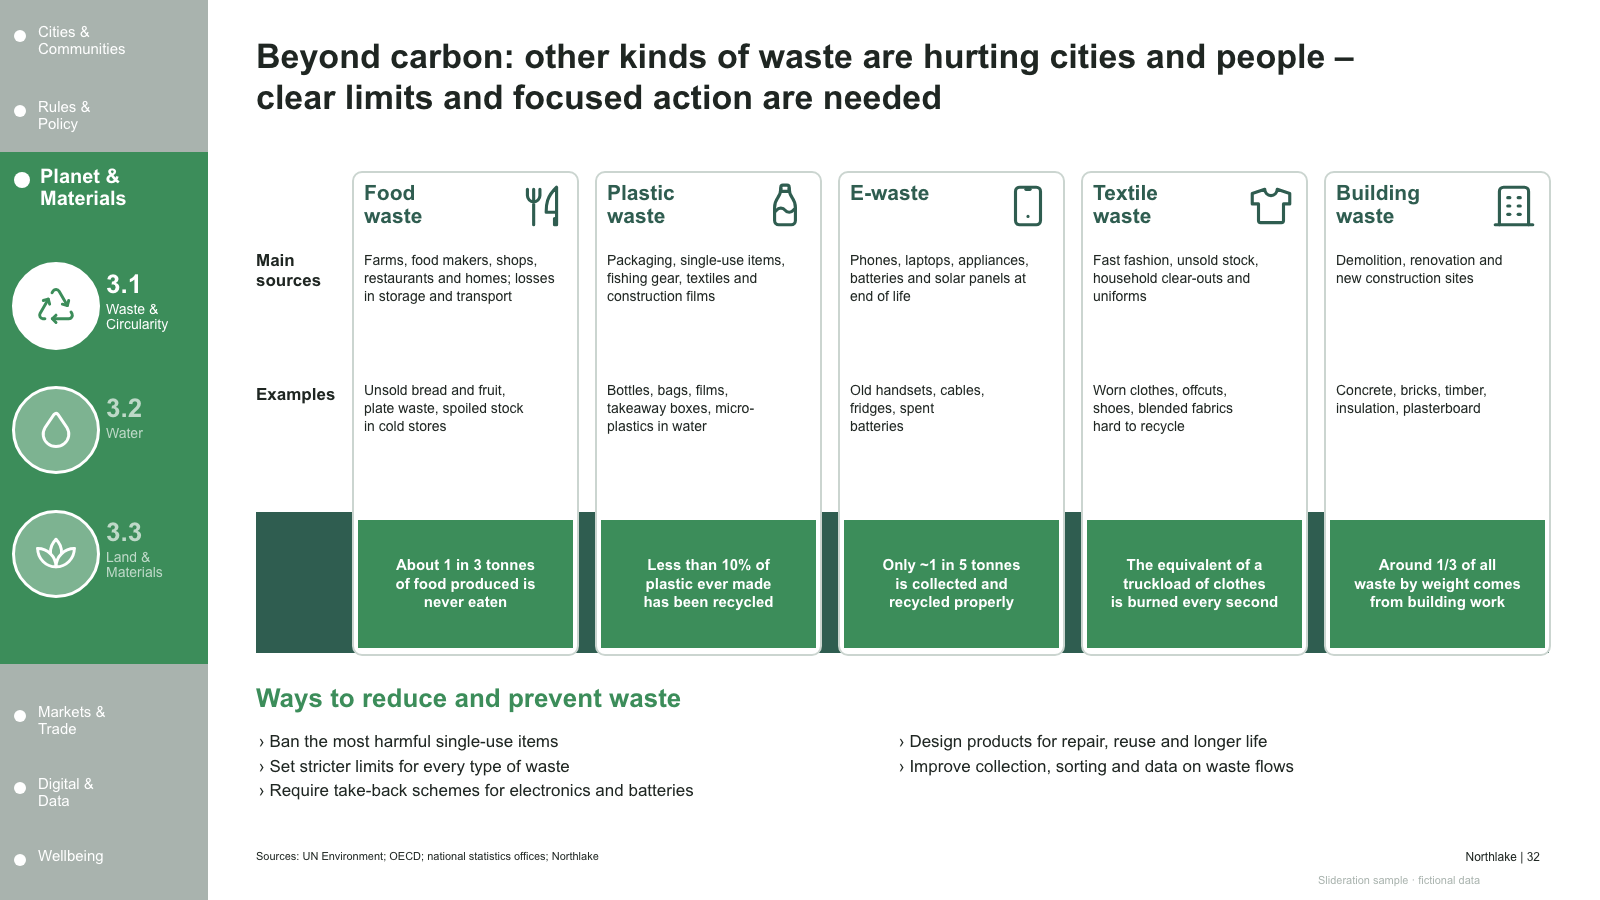
Side navigation plus five topic cards (origins, examples, stat boxes) and approach bullets

Side navigation plus five topic cards (origins, examples, stat boxes) and approach bullets

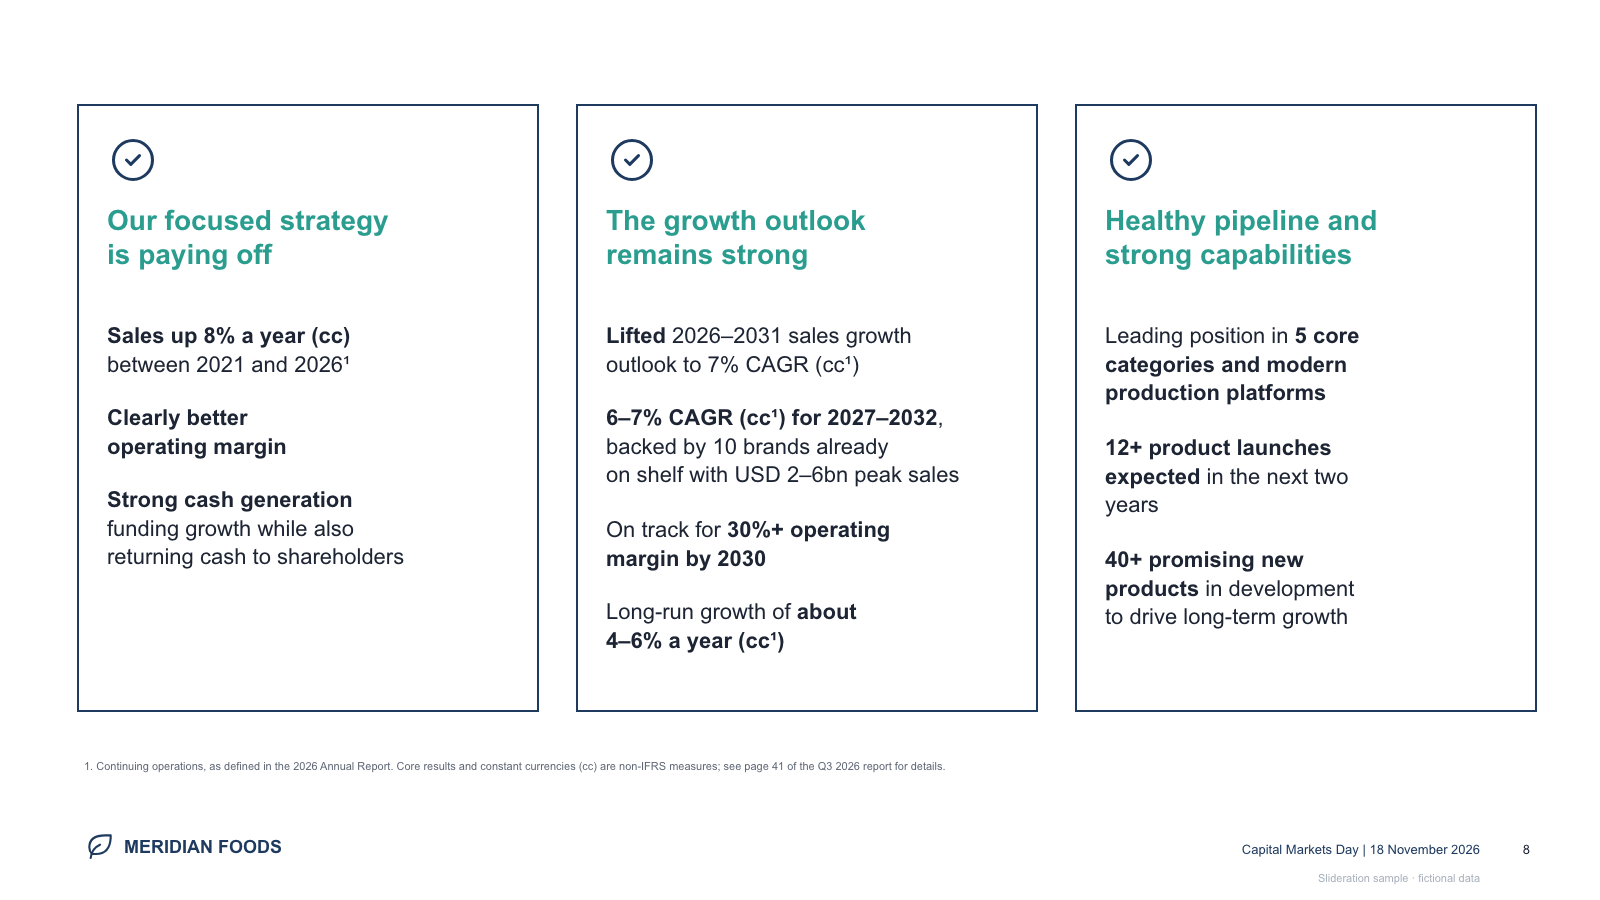
Three outlined message boxes with check icons, two-line headers and bold-led statements

Three outlined message boxes with check icons, two-line headers and bold-led statements

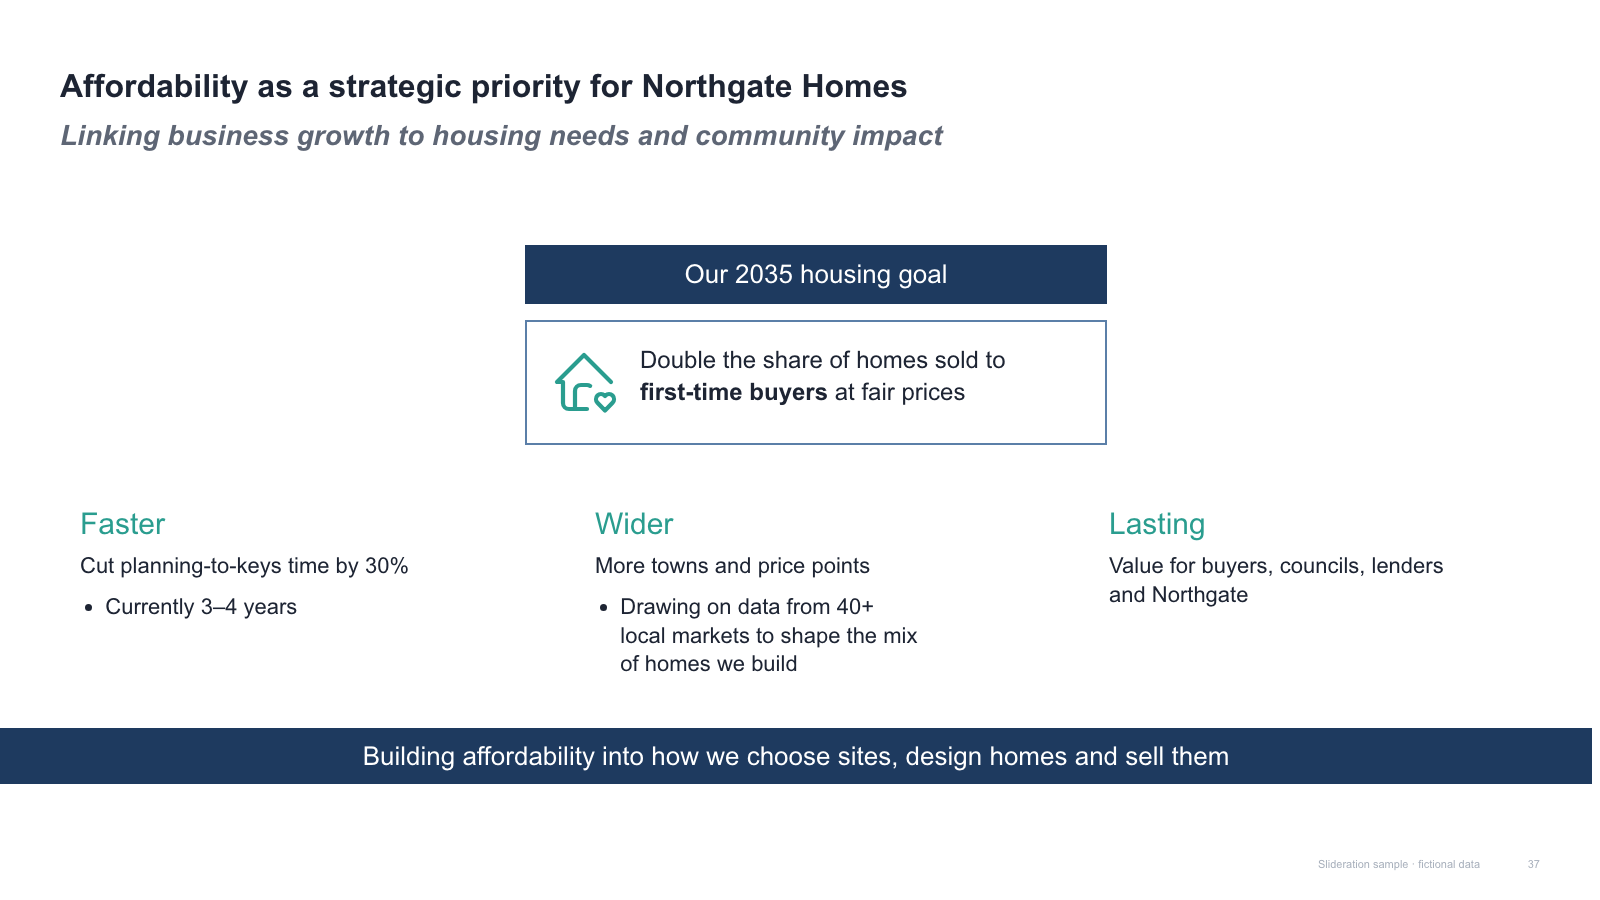
Central ambition banner and icon statement, three coloured-heading columns and a closing band

Central ambition banner and icon statement, three coloured-heading columns and a closing band

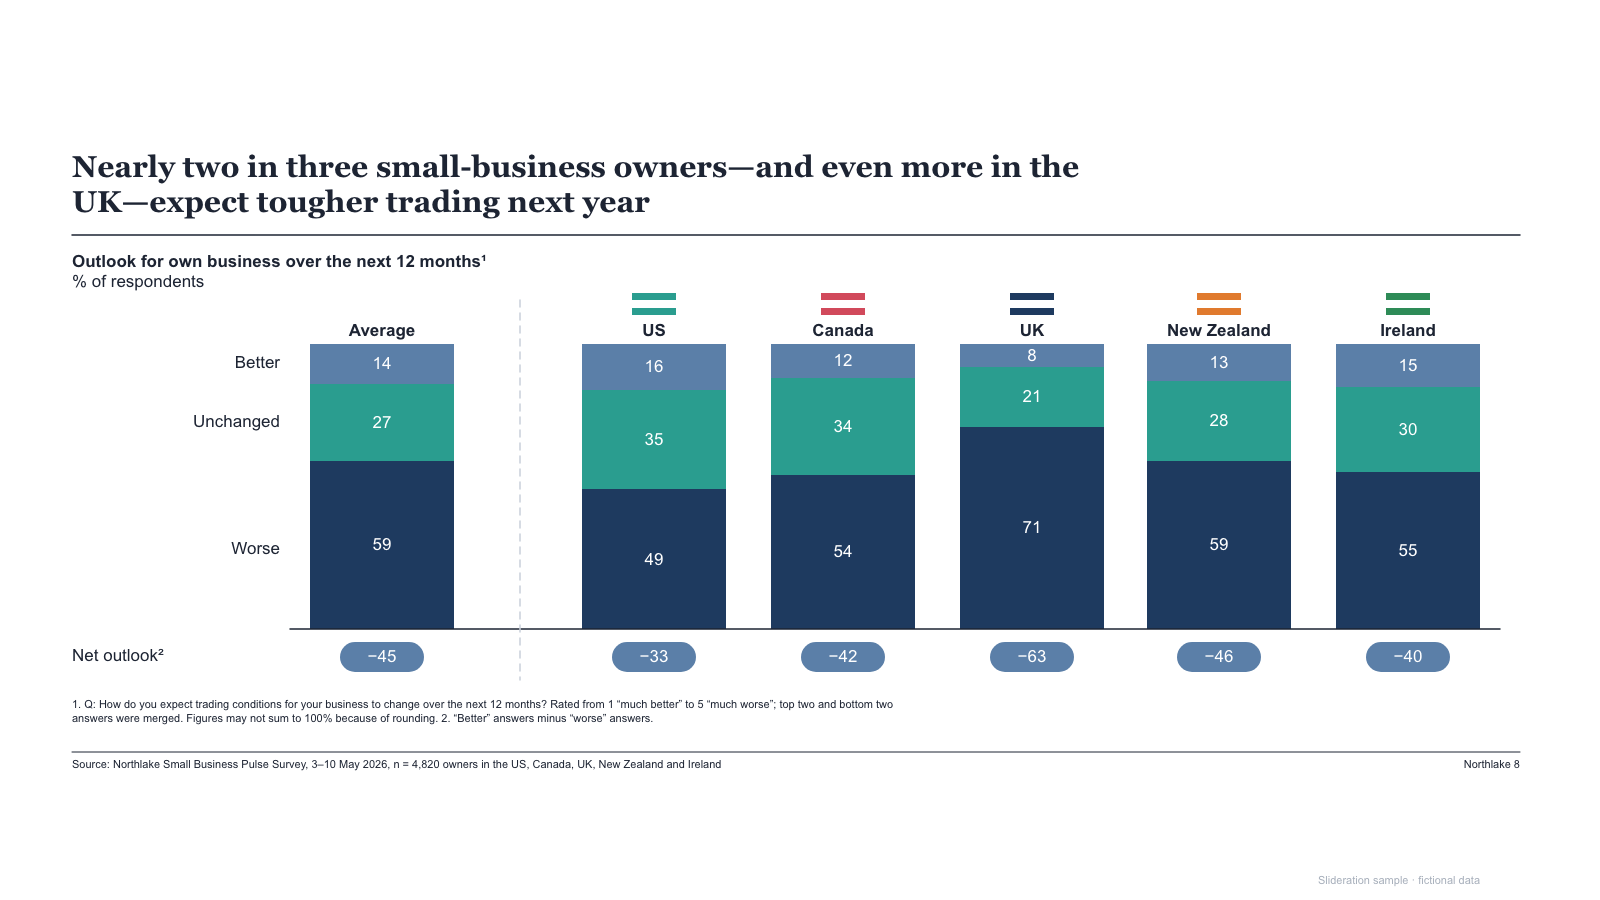
100% stacked columns by country with segment labels, row labels and net-score pills

100% stacked columns by country with segment labels, row labels and net-score pills

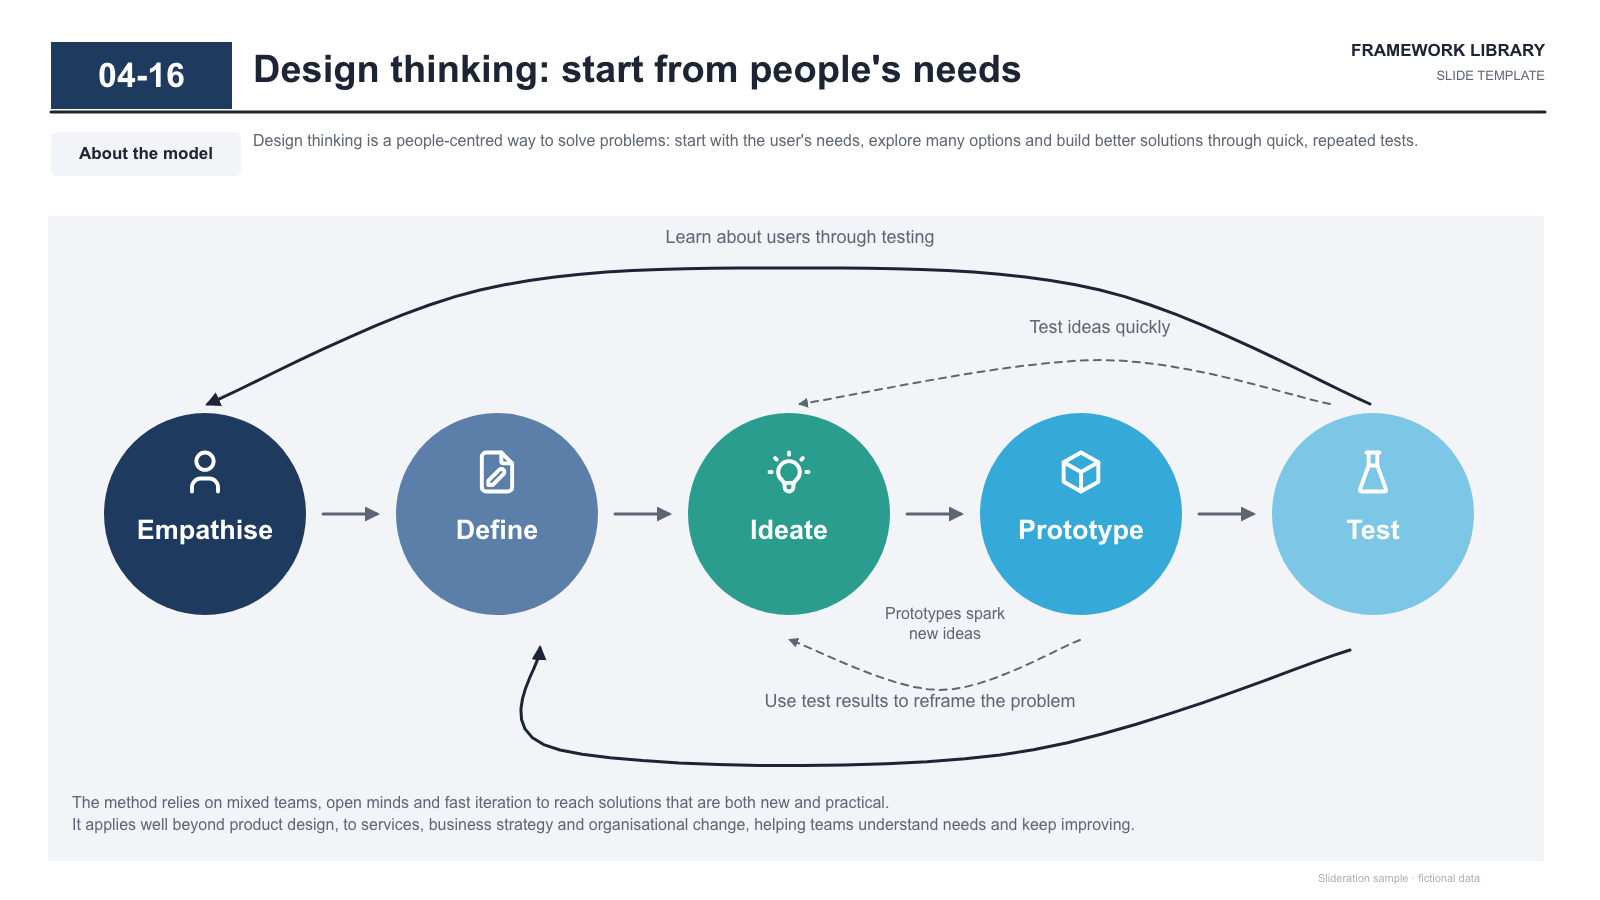
Five-stage circle process with arrows and feedback arcs above and below

Five-stage circle process with arrows and feedback arcs above and below

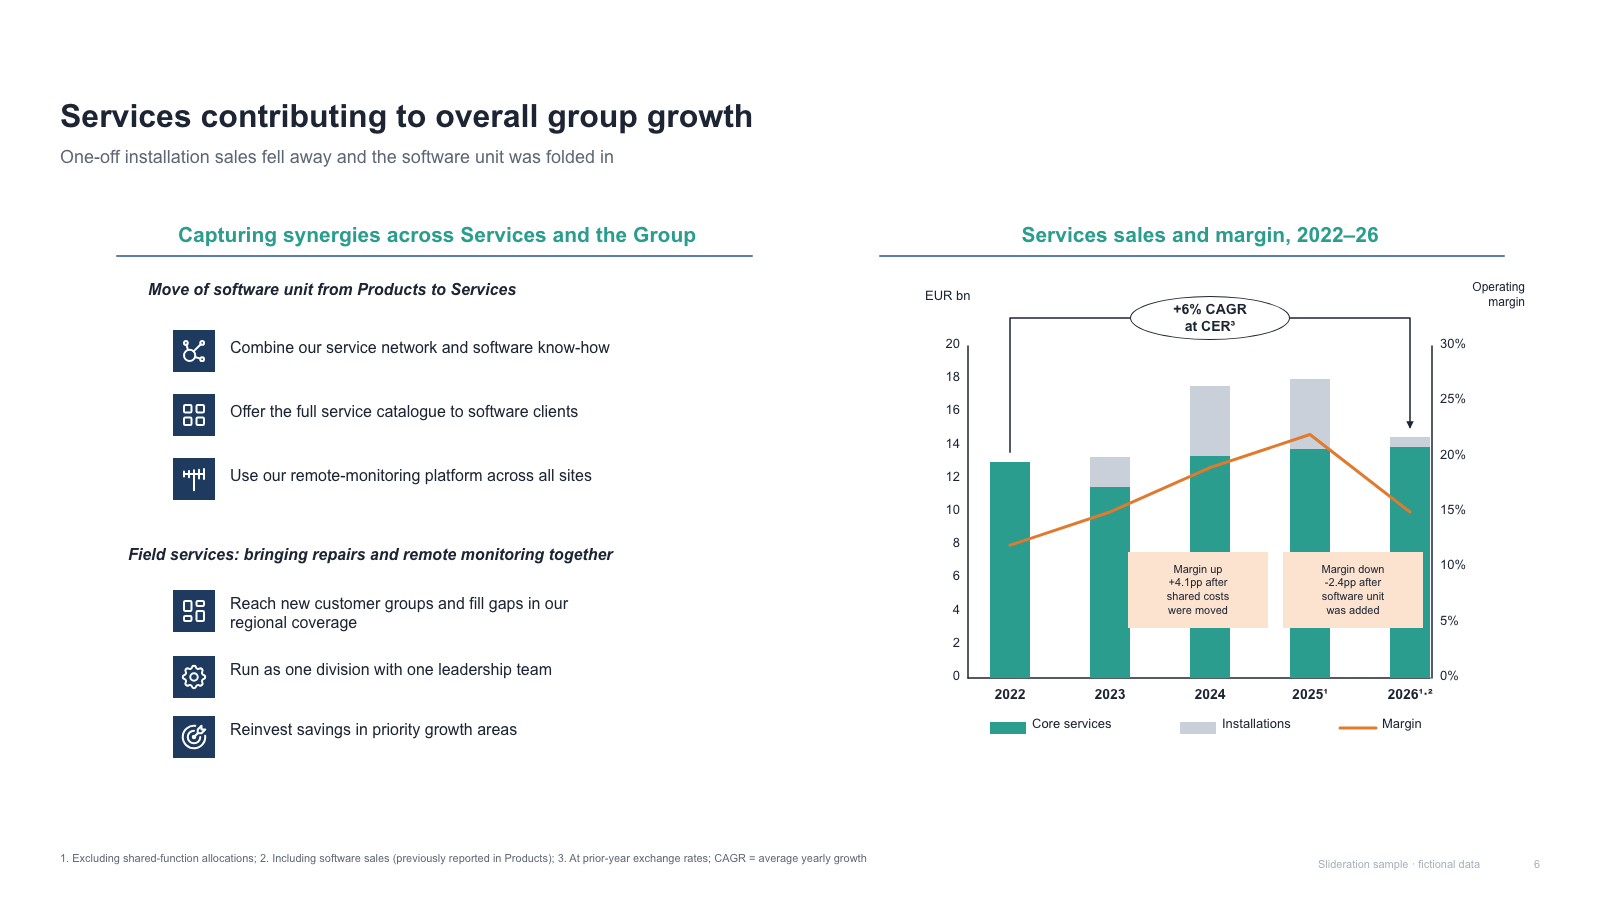
Icon synergy list (two groups) beside a stacked column + margin line chart with CAGR bracket

Icon synergy list (two groups) beside a stacked column + margin line chart with CAGR bracket

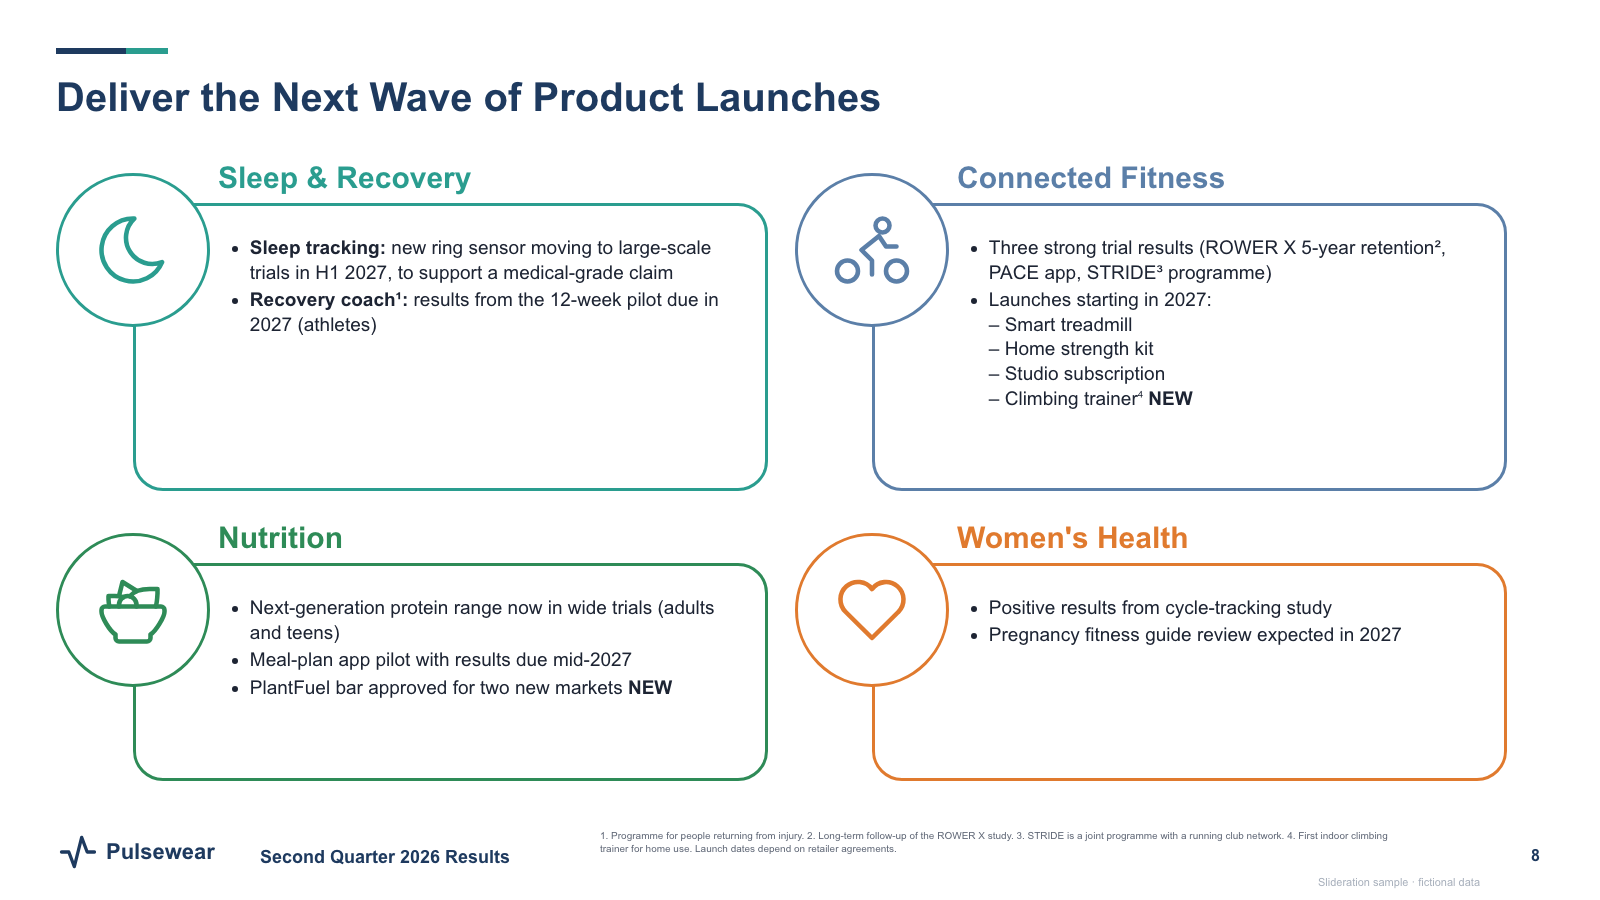
2x2 rounded panels, each with an overlapping icon circle, coloured heading and bullet list

2x2 rounded panels, each with an overlapping icon circle, coloured heading and bullet list

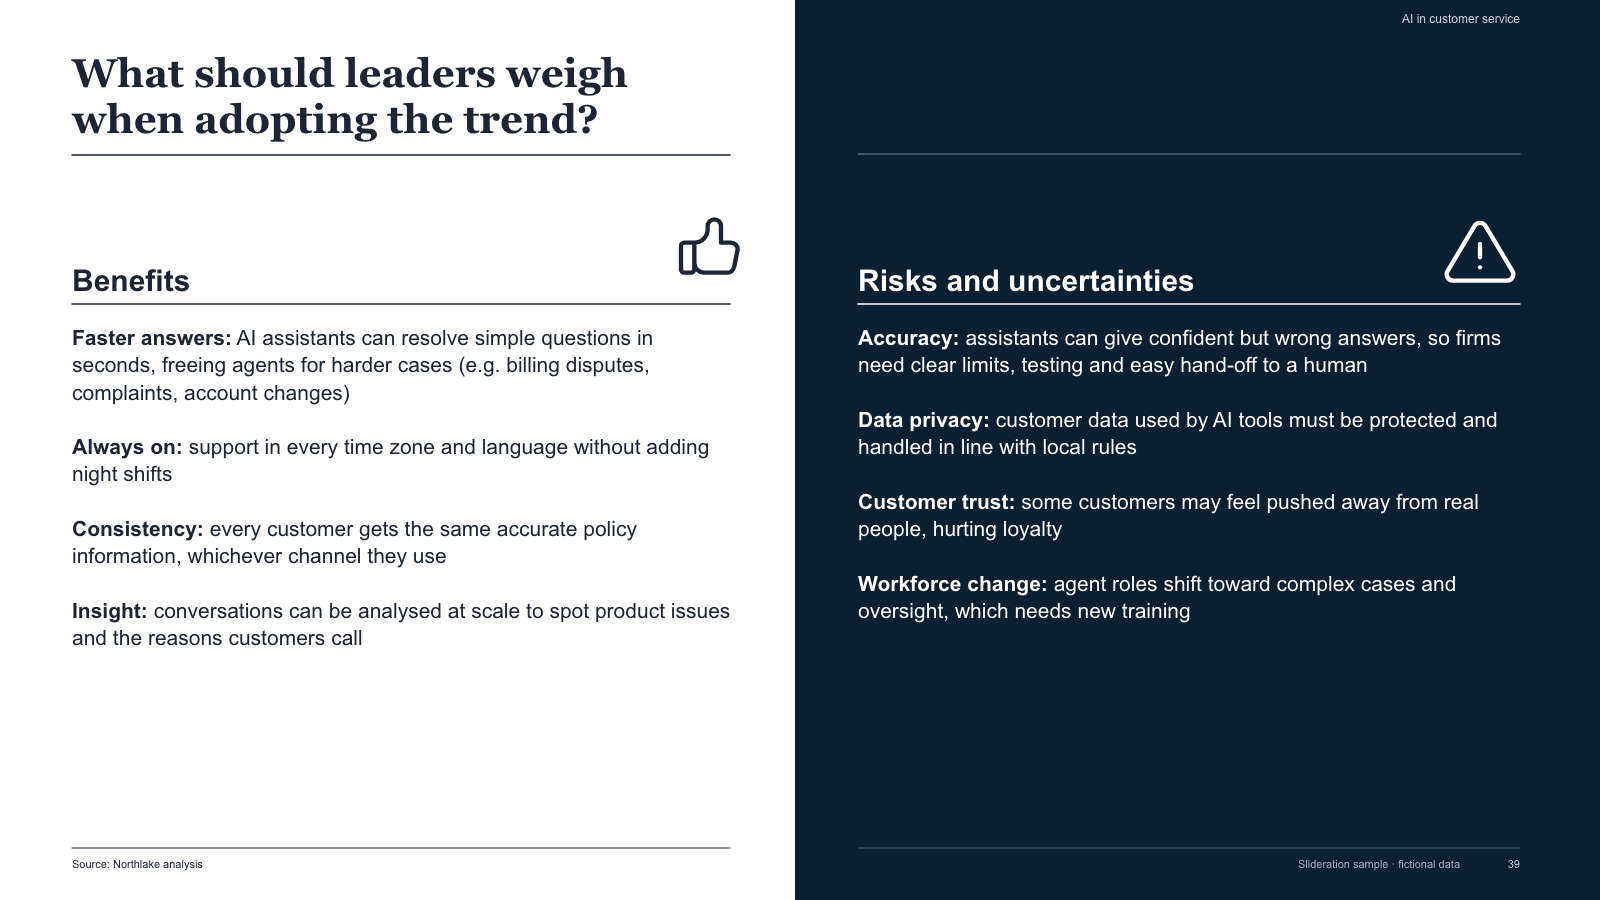
Split slide — white benefits column with serif headline and dark risks column, icon headings

Split slide — white benefits column with serif headline and dark risks column, icon headings

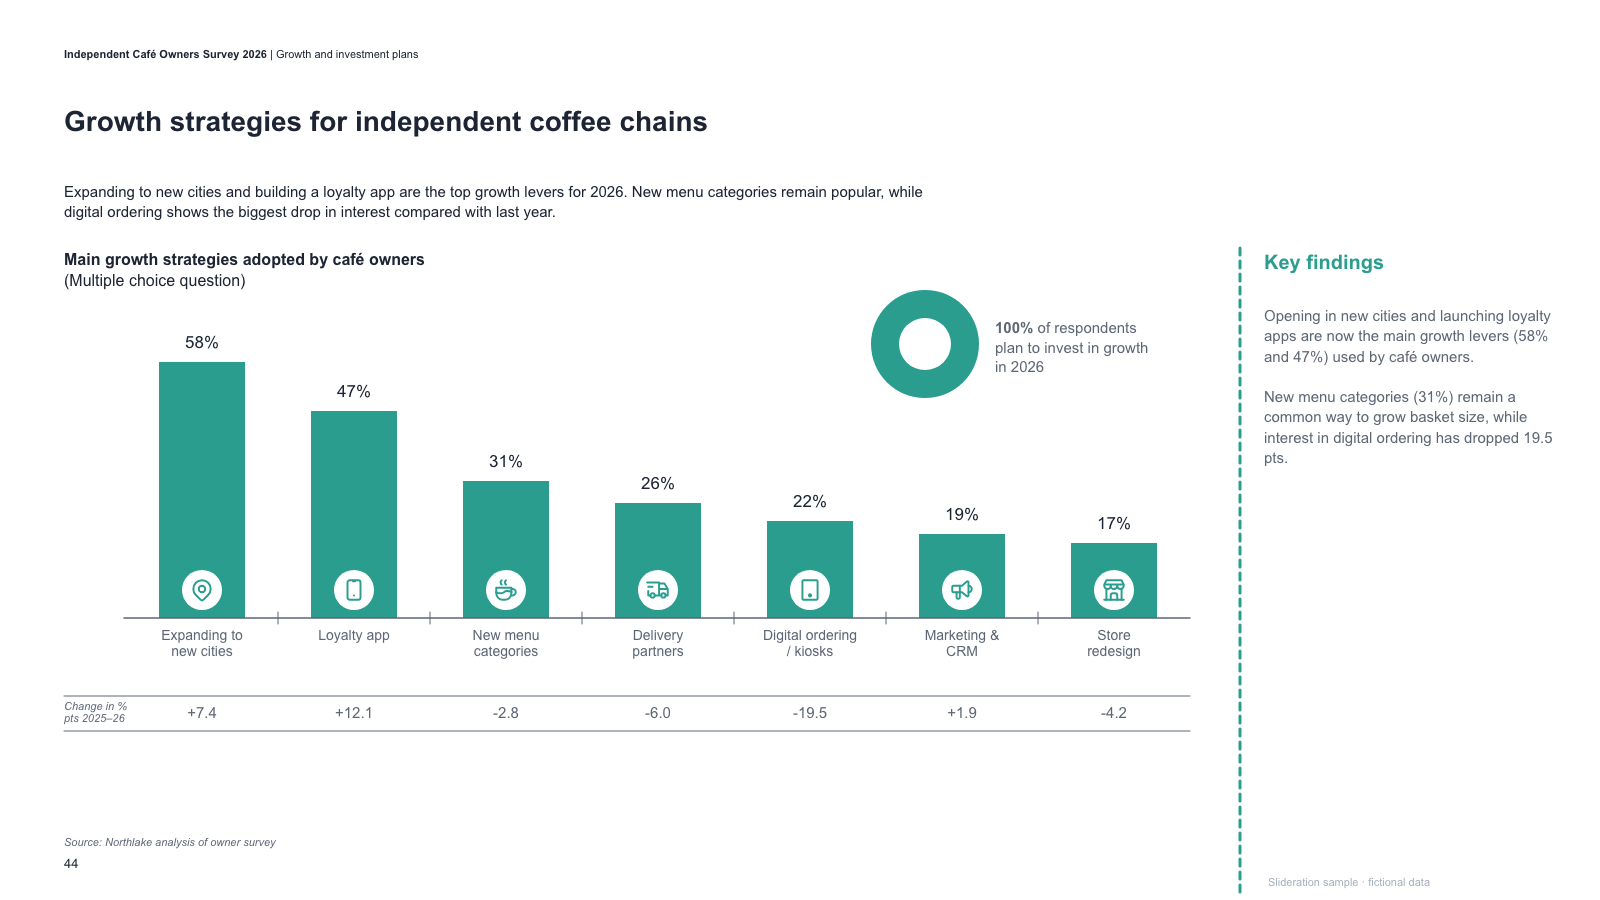
Ranked column chart with icons inside bars, change row, donut callout and key-findings column

Ranked column chart with icons inside bars, change row, donut callout and key-findings column

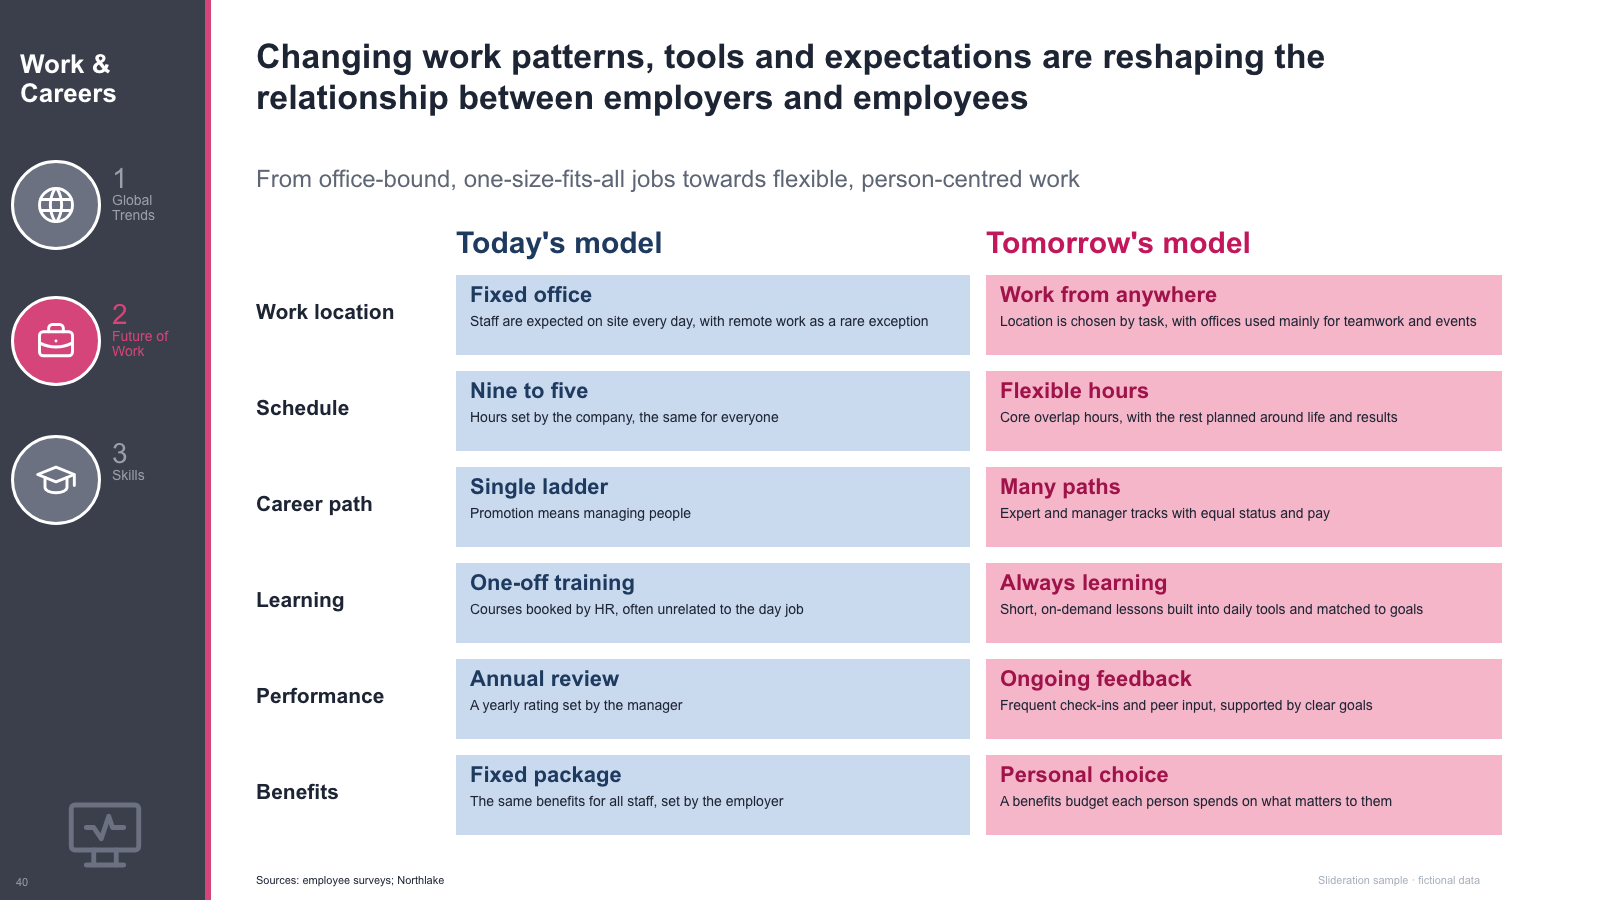
Dark section sidebar plus a current-vs-future two-column comparison table with row labels

Dark section sidebar plus a current-vs-future two-column comparison table with row labels

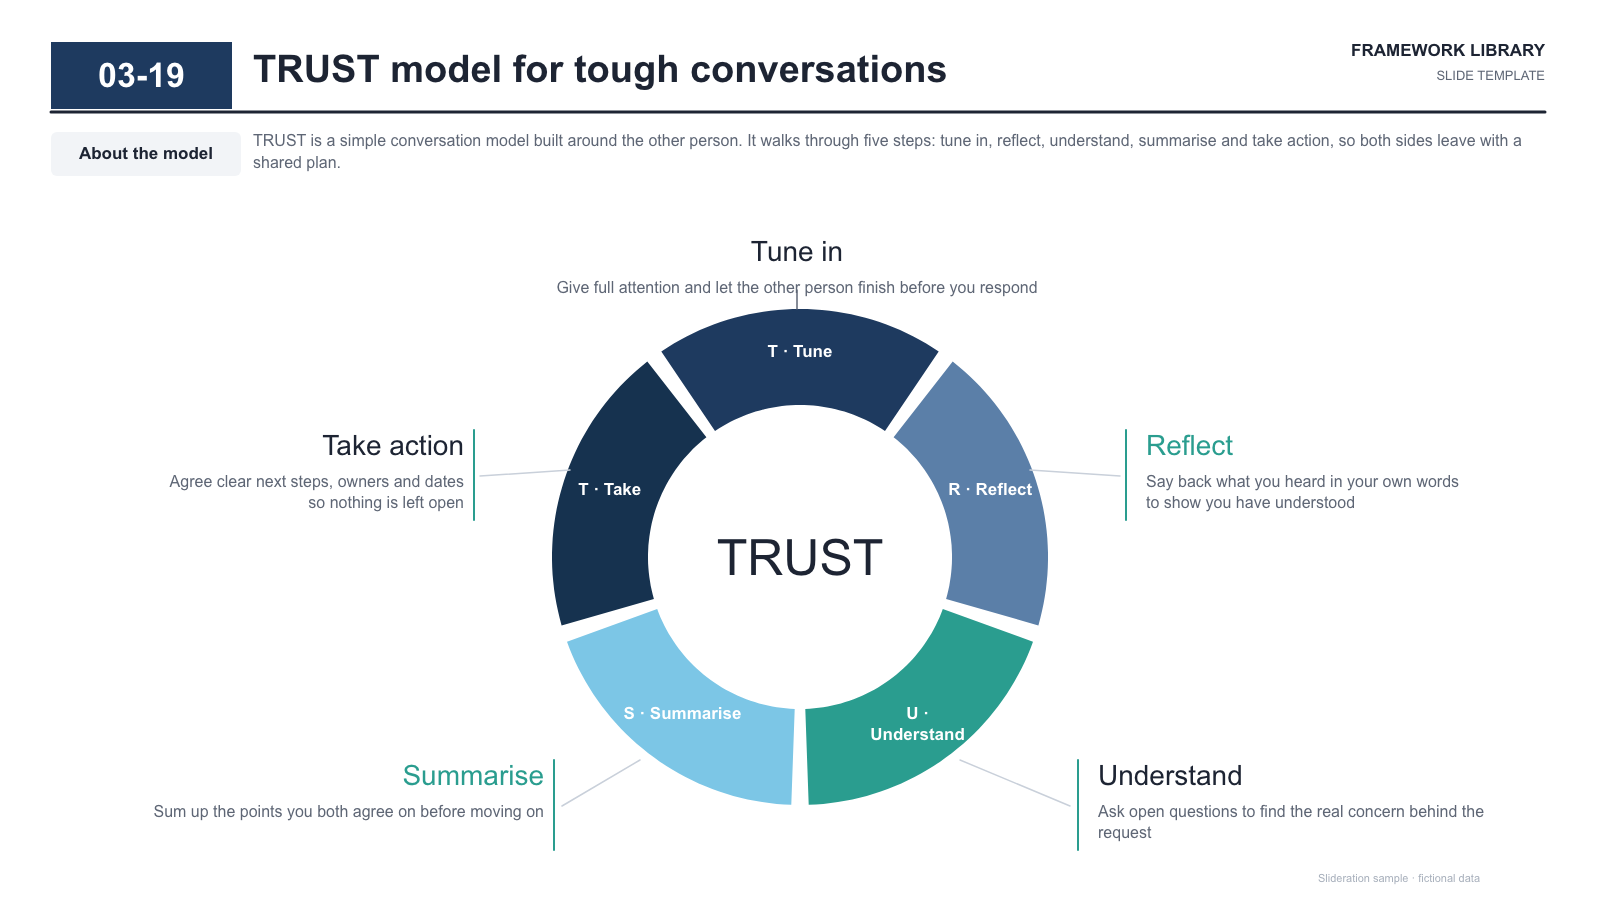
Five-segment ring around a central acronym, with leader lines to outer step labels

Five-segment ring around a central acronym, with leader lines to outer step labels

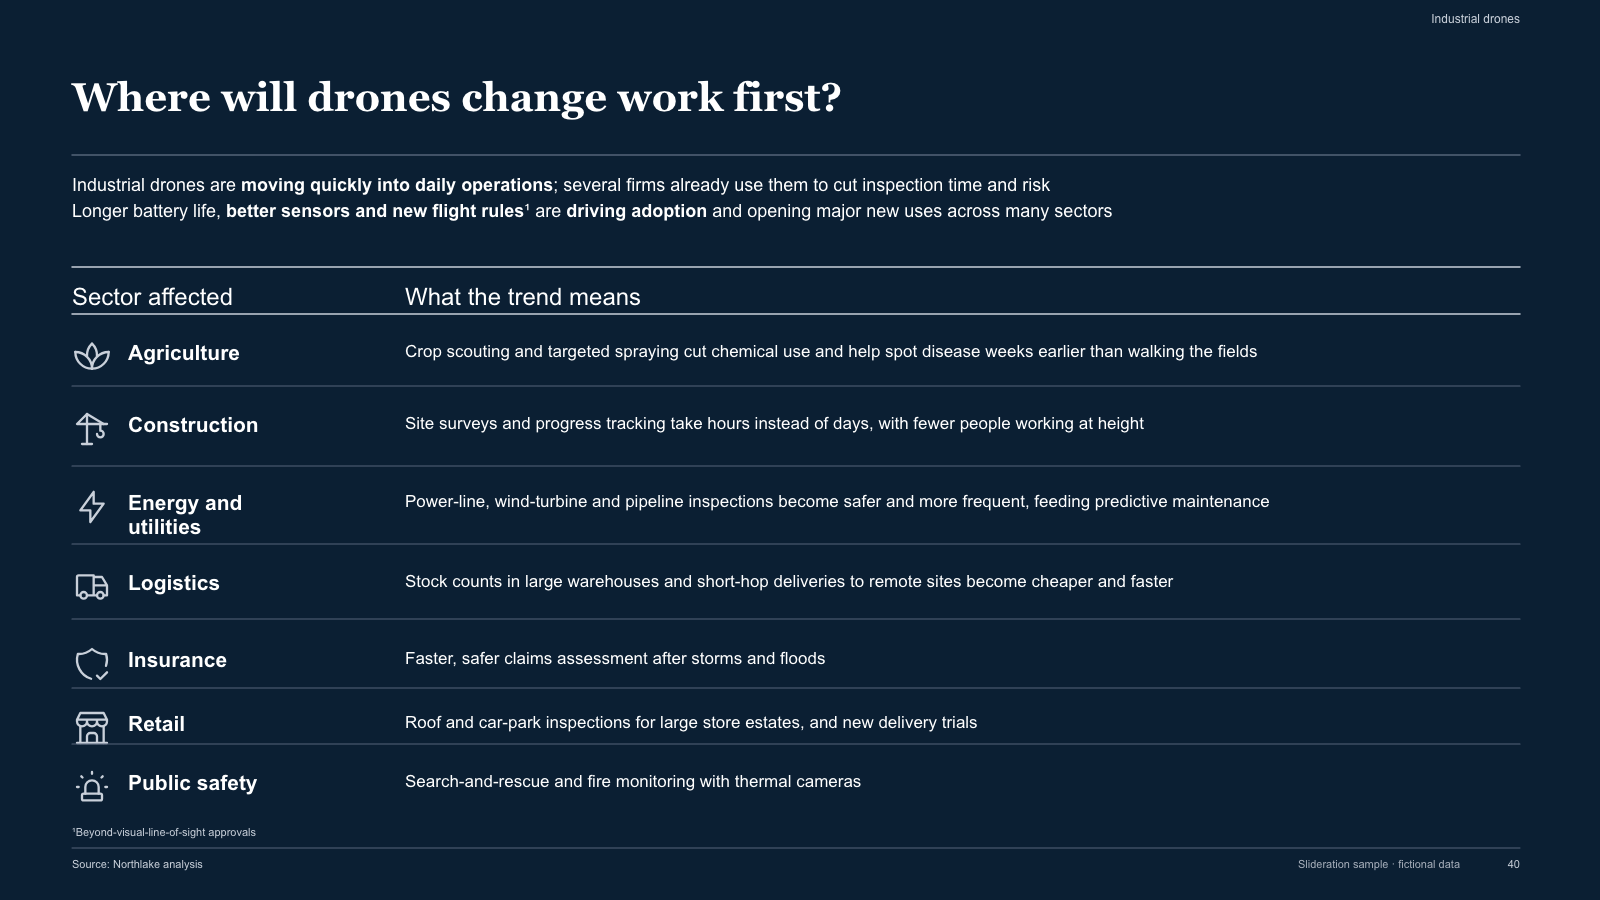
Dark seven-row impact table with icon, sector label and one-line implication

Dark seven-row impact table with icon, sector label and one-line implication

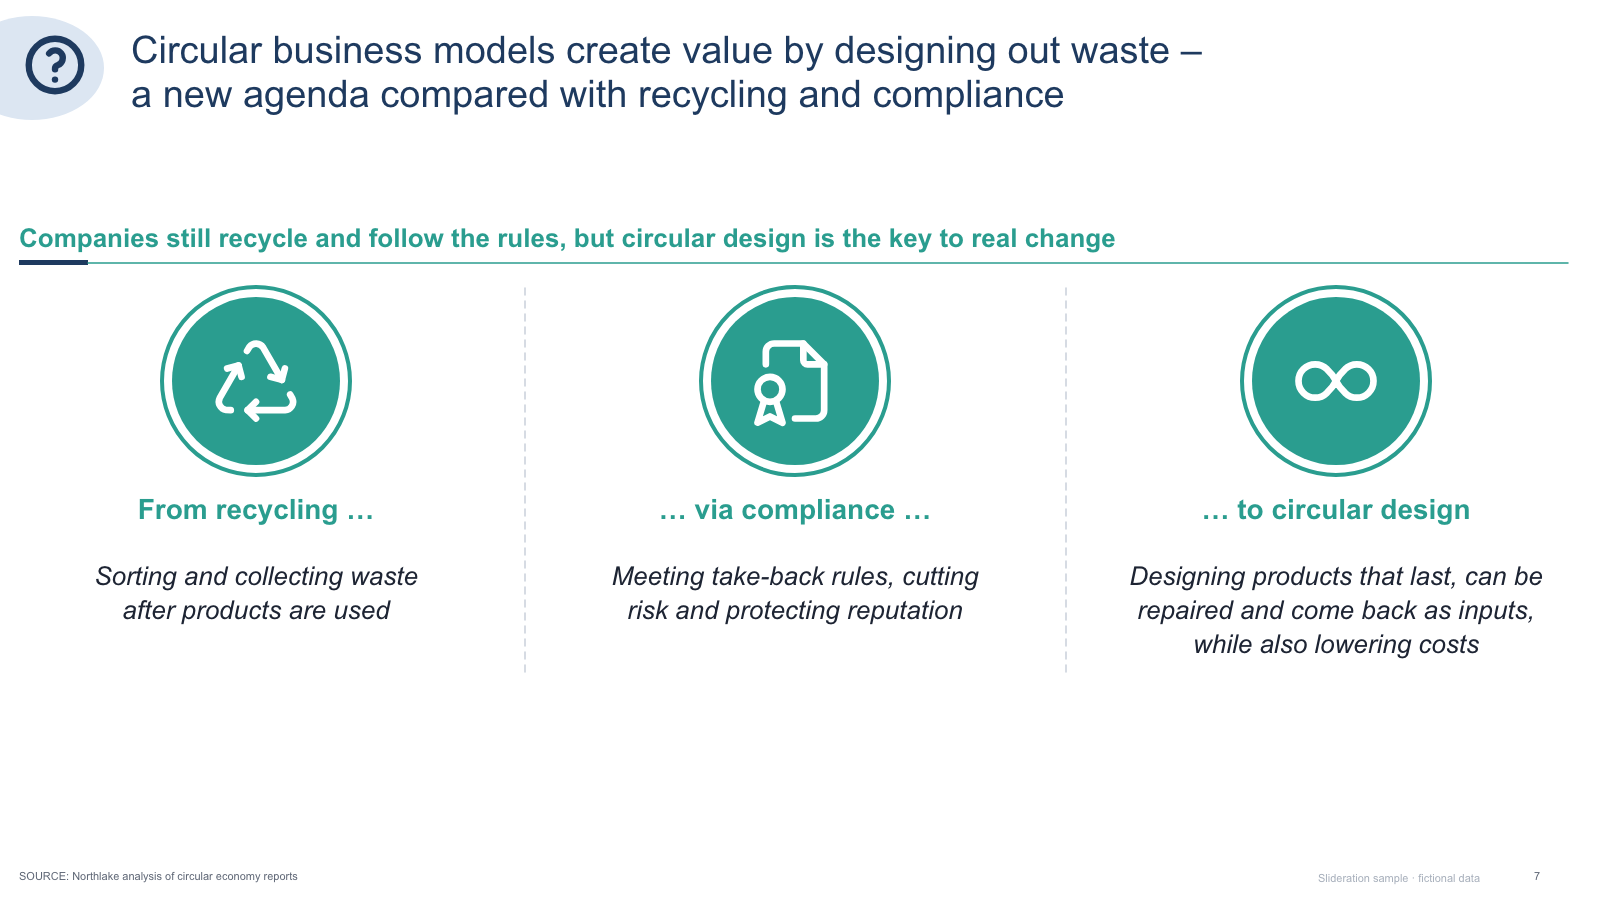
Question badge headline and three-step evolution columns with large icon circles

Question badge headline and three-step evolution columns with large icon circles

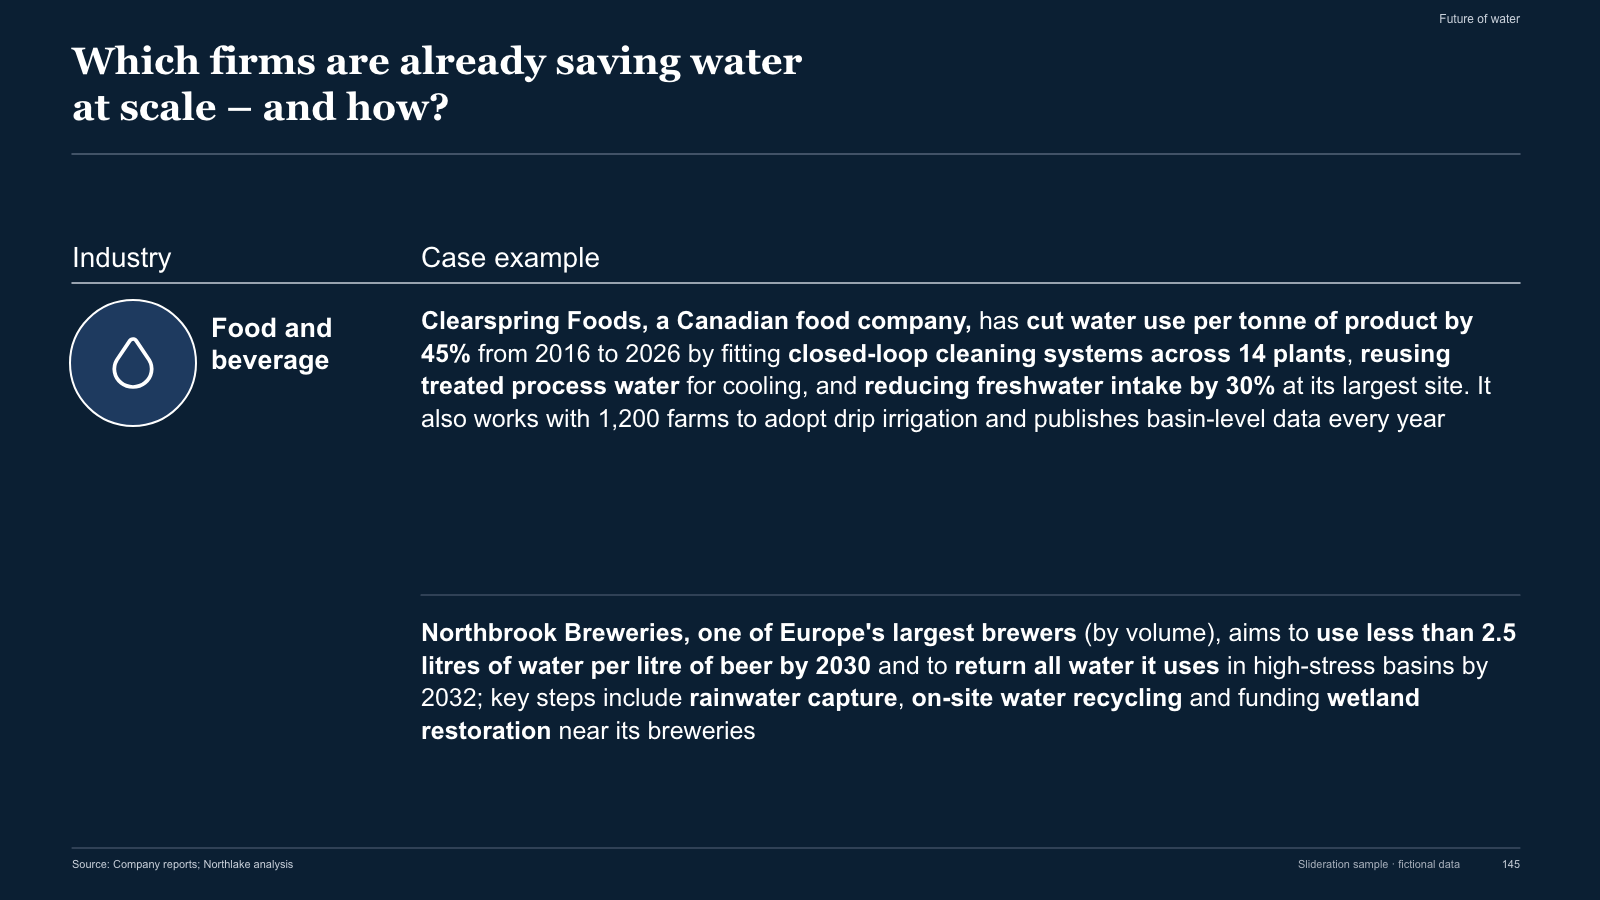
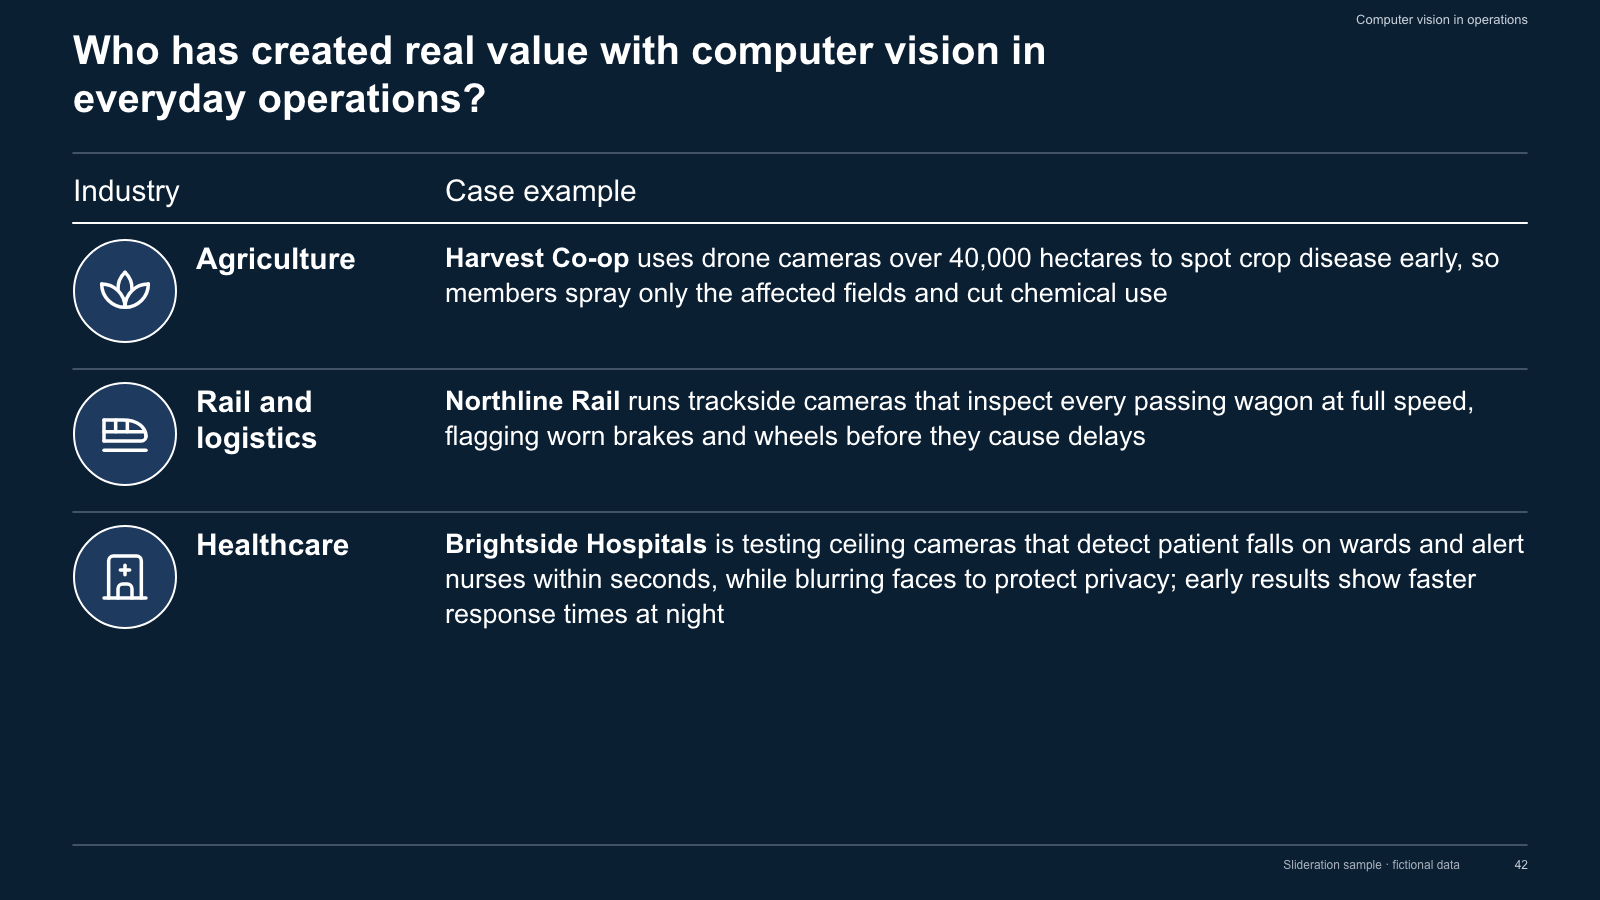
Dark case-example table — icon circle with industry label beside two long bold-led cases

Dark case-example table — icon circle with industry label beside two long bold-led cases

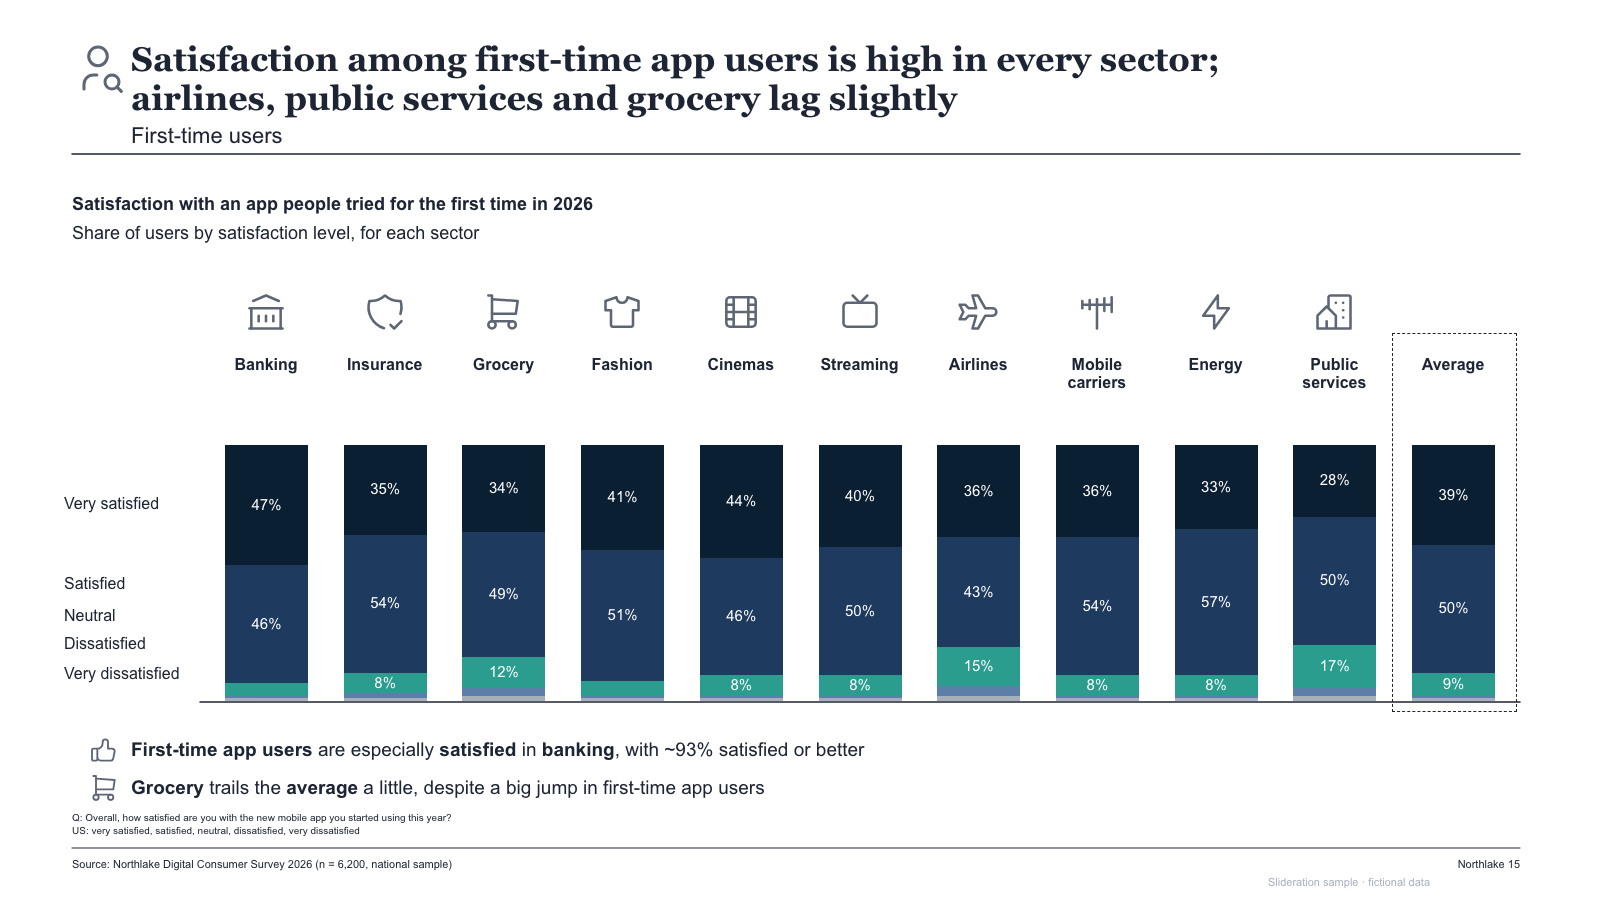
100% stacked satisfaction columns by industry with icons, segment labels and a dashed average column

100% stacked satisfaction columns by industry with icons, segment labels and a dashed average column

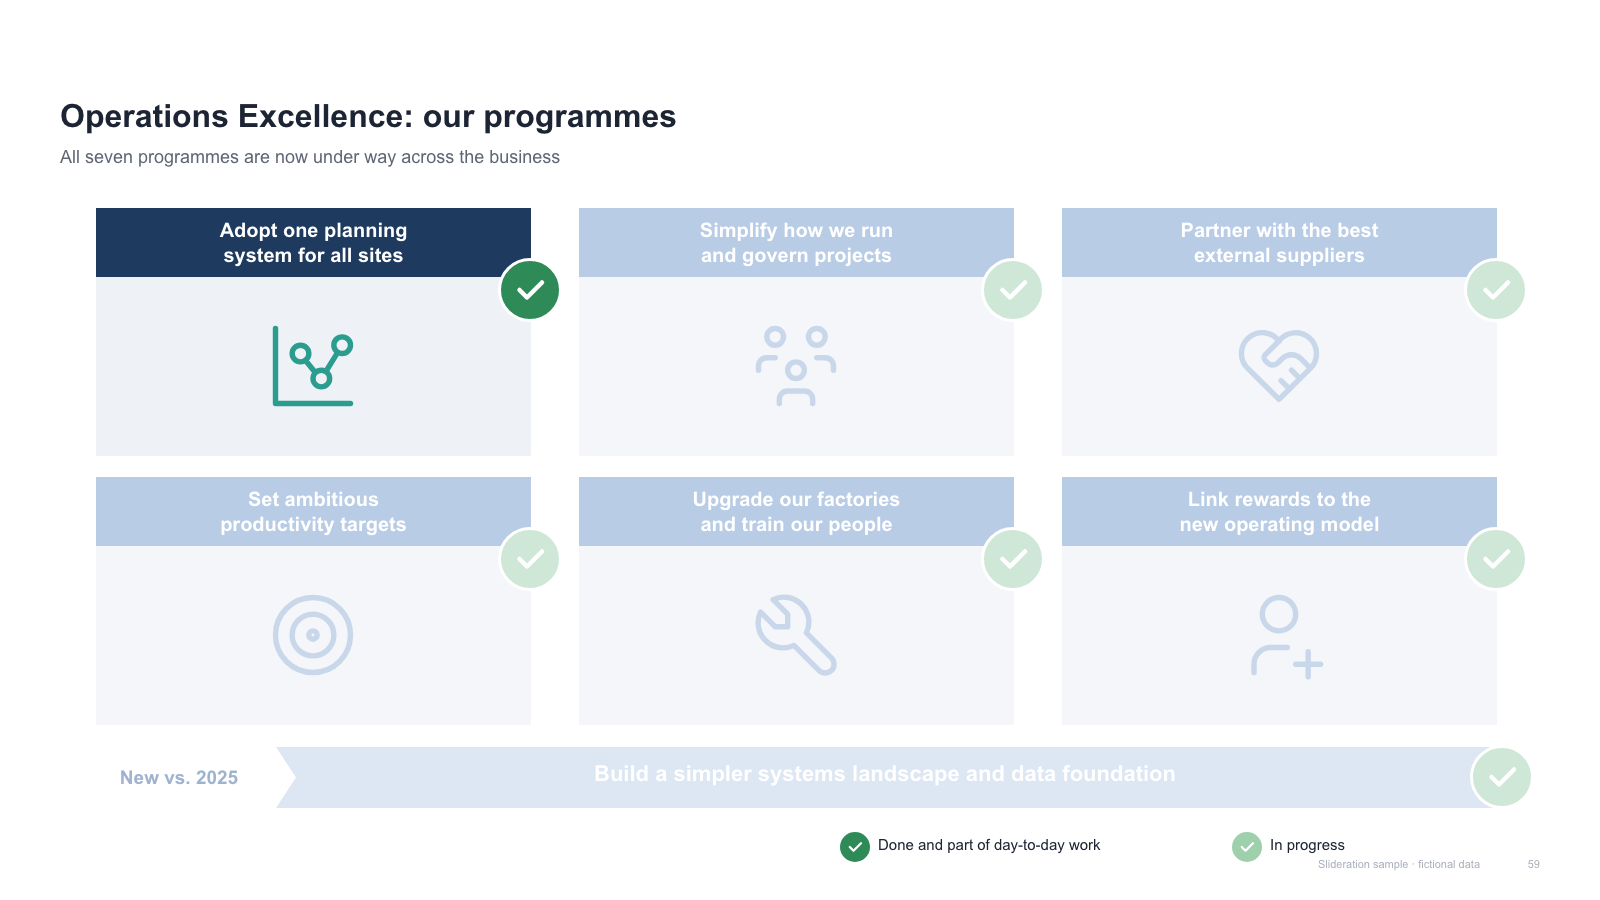
3x2 programme card grid with one highlighted card, check badges, faded cards and a bottom bar

3x2 programme card grid with one highlighted card, check badges, faded cards and a bottom bar

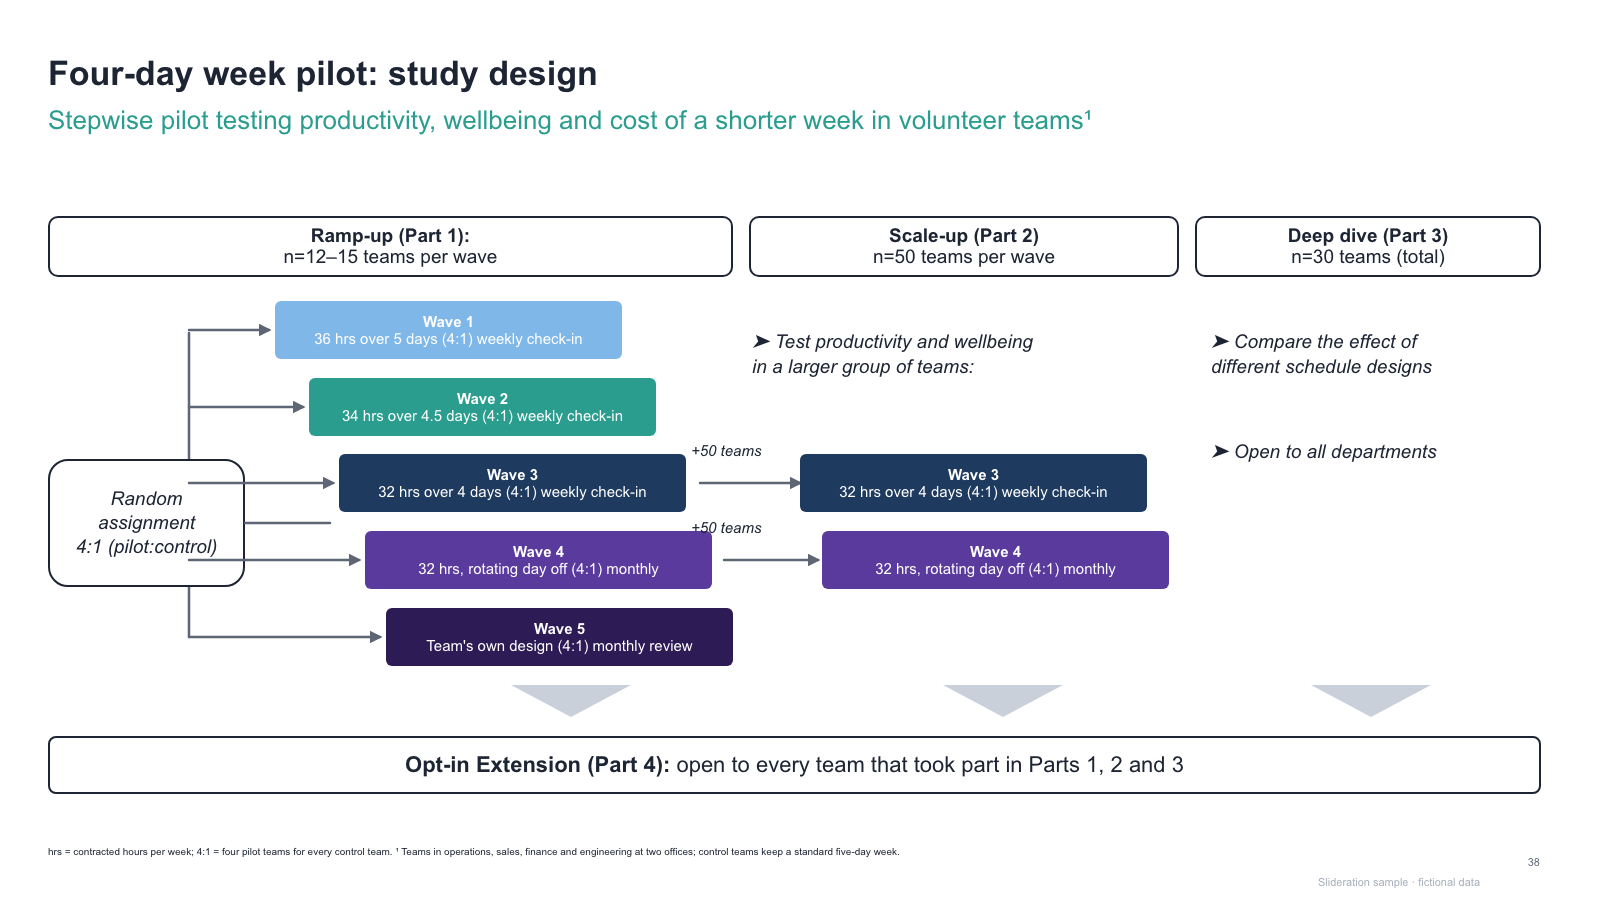
Staged trial design — randomisation box feeding staggered cohort bars, part headers and extension bar

Staged trial design — randomisation box feeding staggered cohort bars, part headers and extension bar

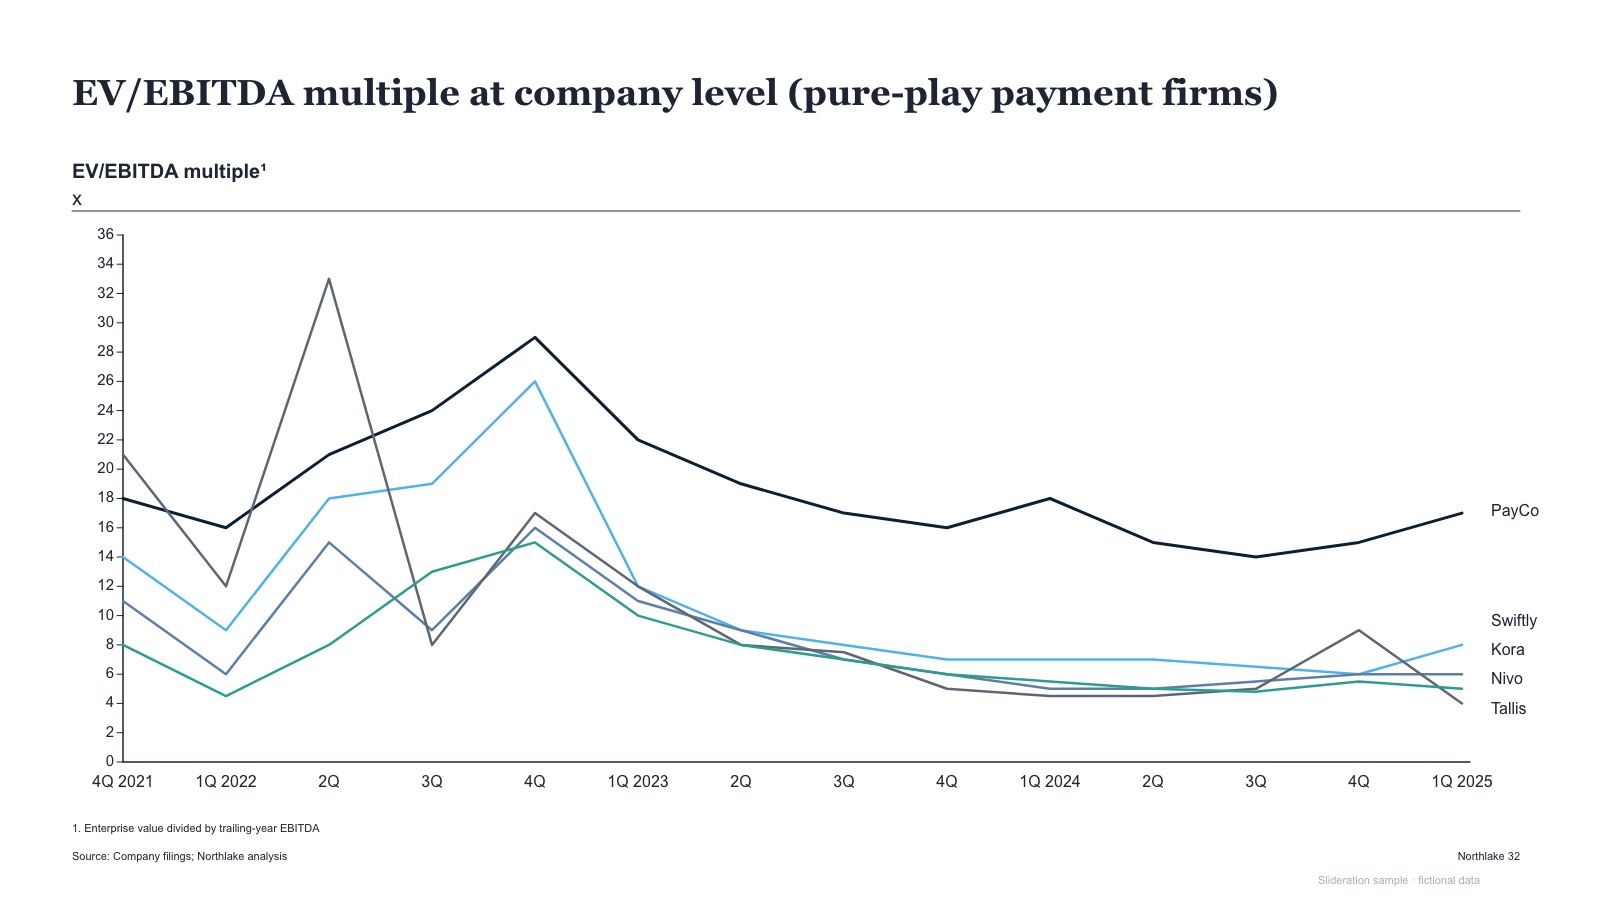
Multi-line quarterly valuation chart with gridded axis and right-side series labels

Multi-line quarterly valuation chart with gridded axis and right-side series labels

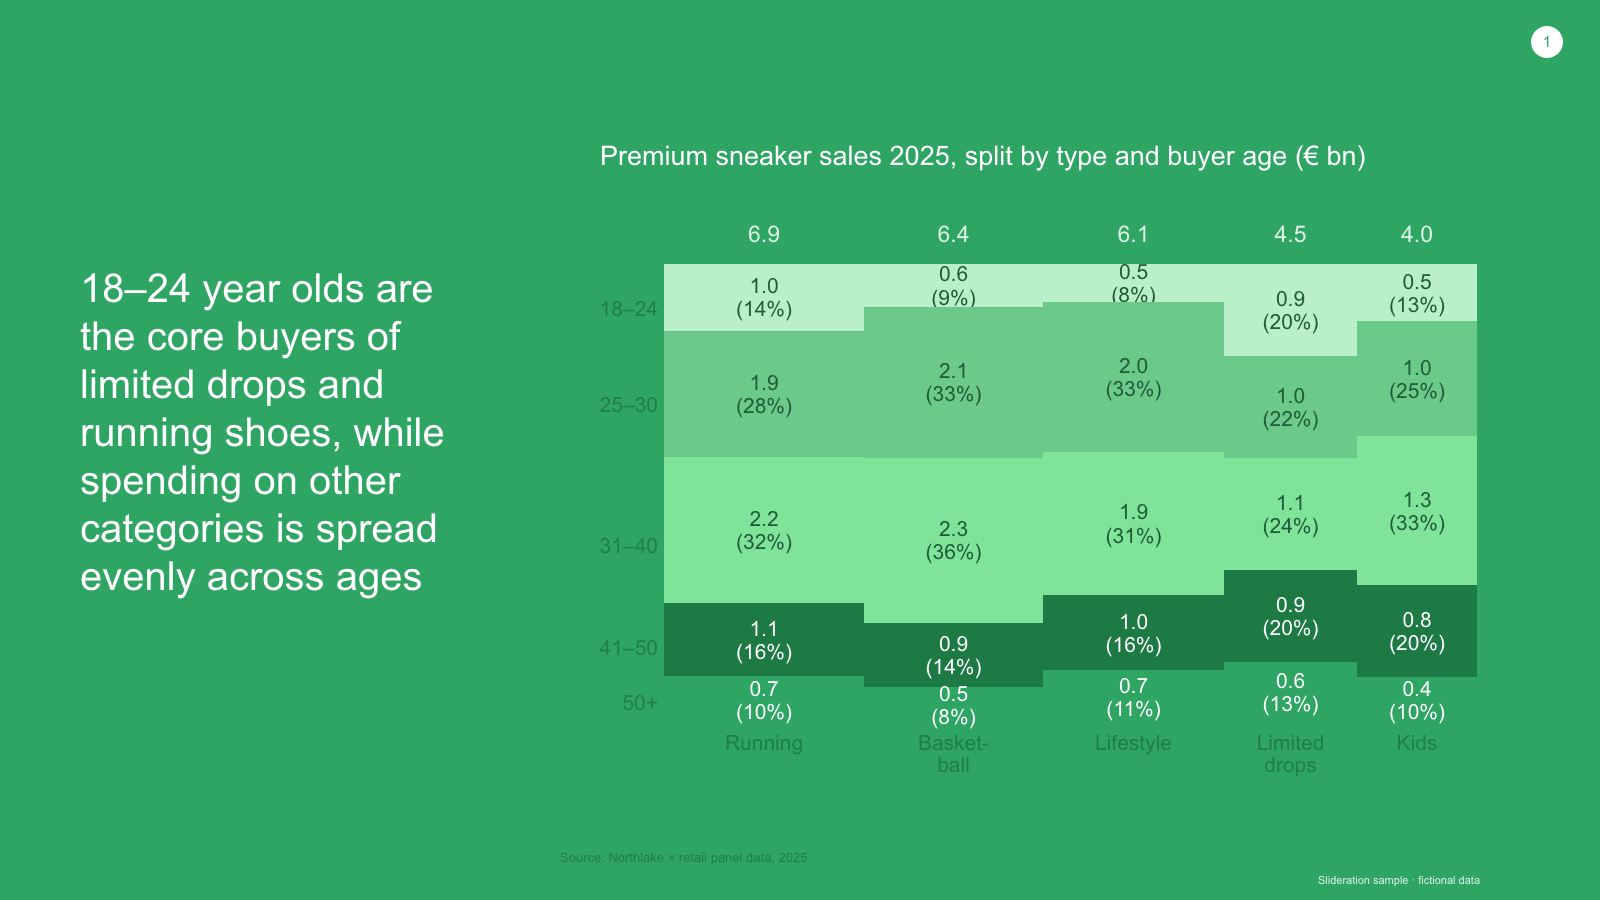
Full-colour background with a bold statement beside a stacked category-by-age market chart

Full-colour background with a bold statement beside a stacked category-by-age market chart

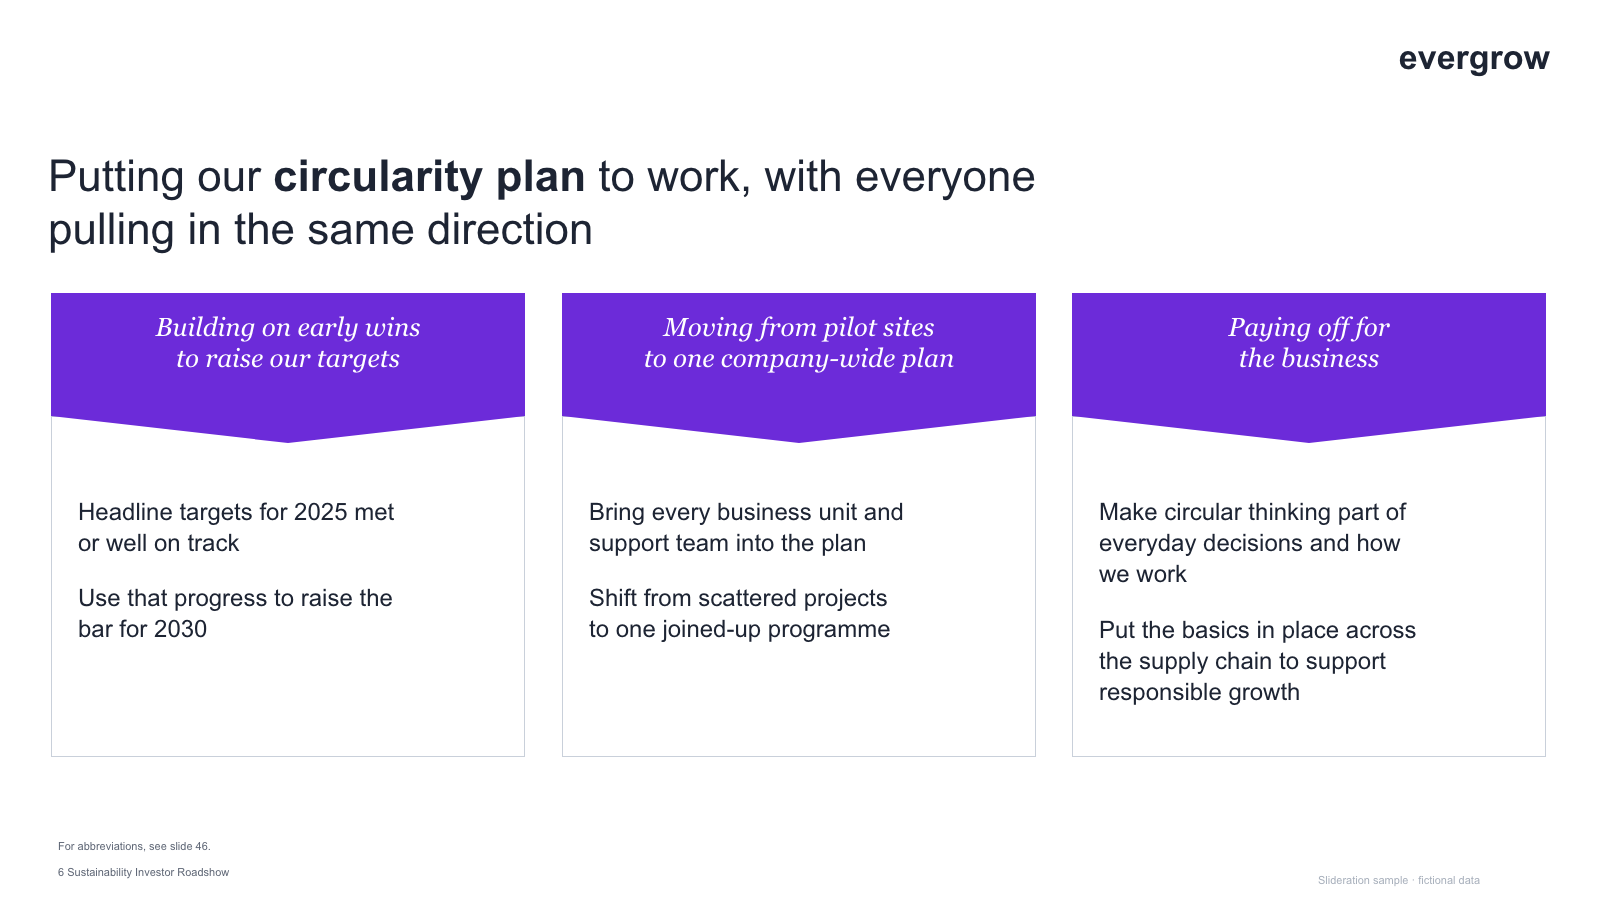
Three columns with downward-pointing header banners over outlined text panels

Three columns with downward-pointing header banners over outlined text panels

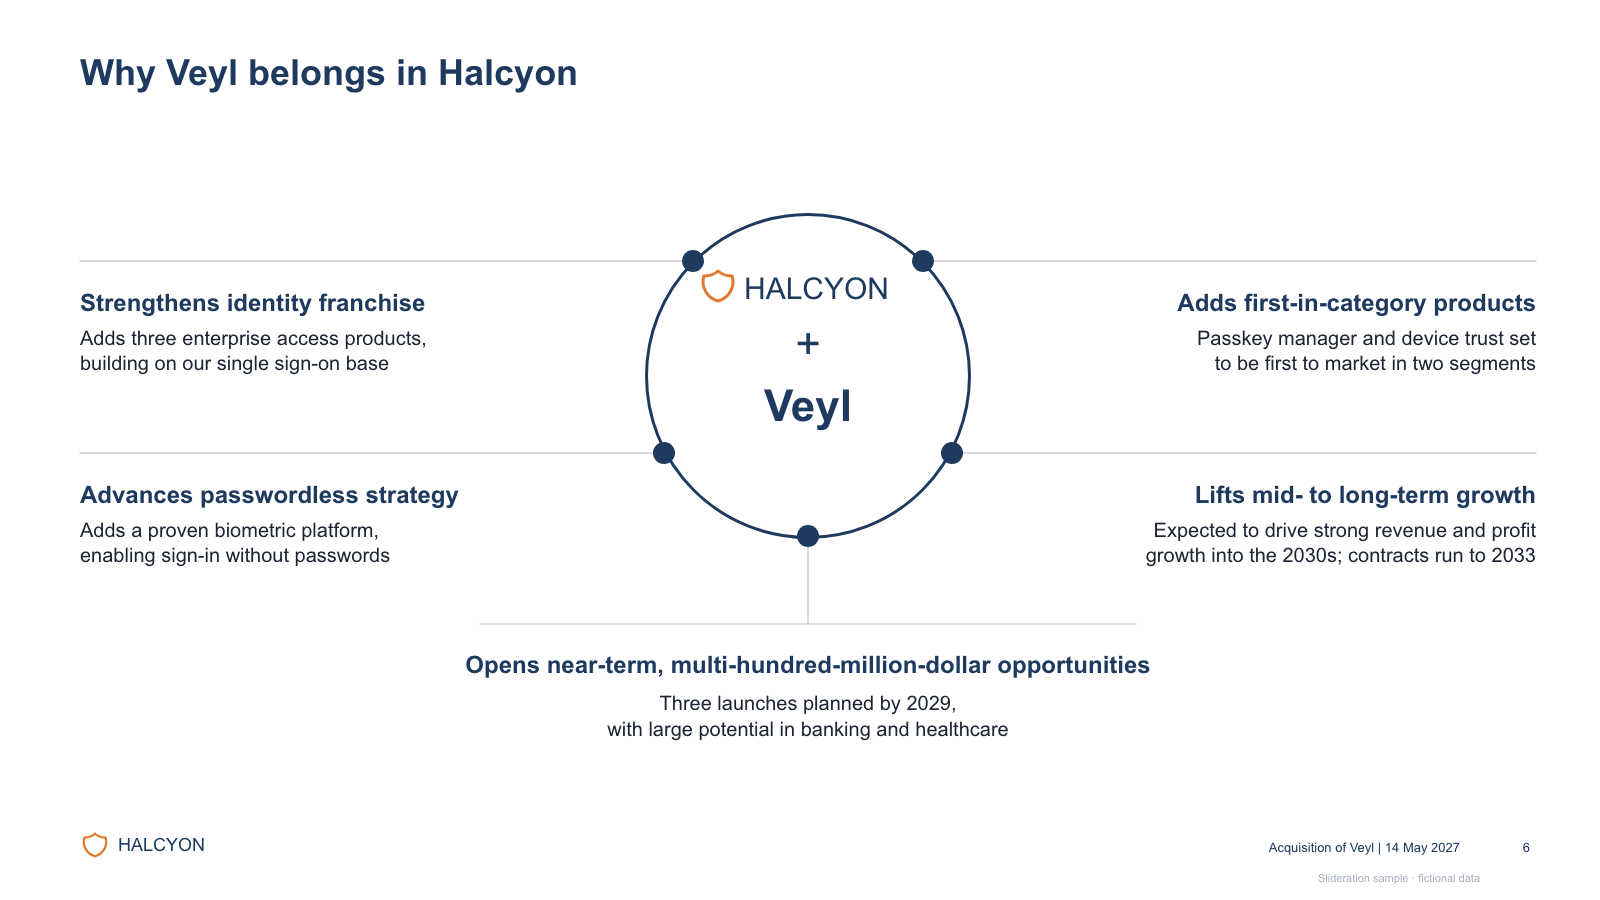
Central combination badge with four connected rationale blocks and a bottom takeaway

Central combination badge with four connected rationale blocks and a bottom takeaway

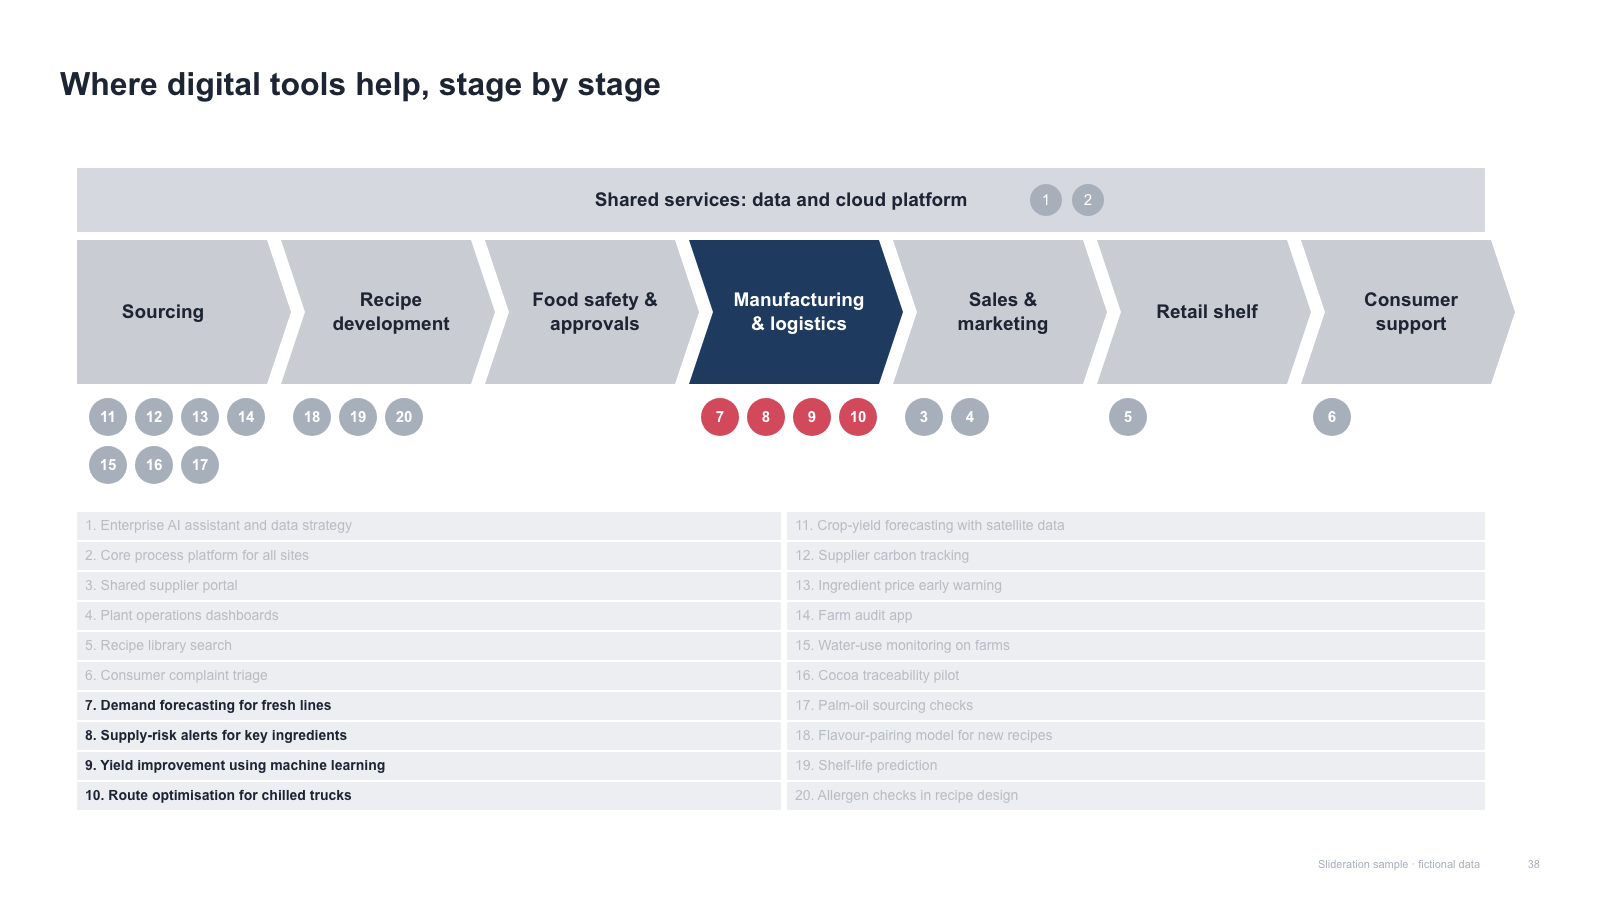
Value-chain chevrons with one highlighted stage, numbered use-case markers and a two-column index

Value-chain chevrons with one highlighted stage, numbered use-case markers and a two-column index

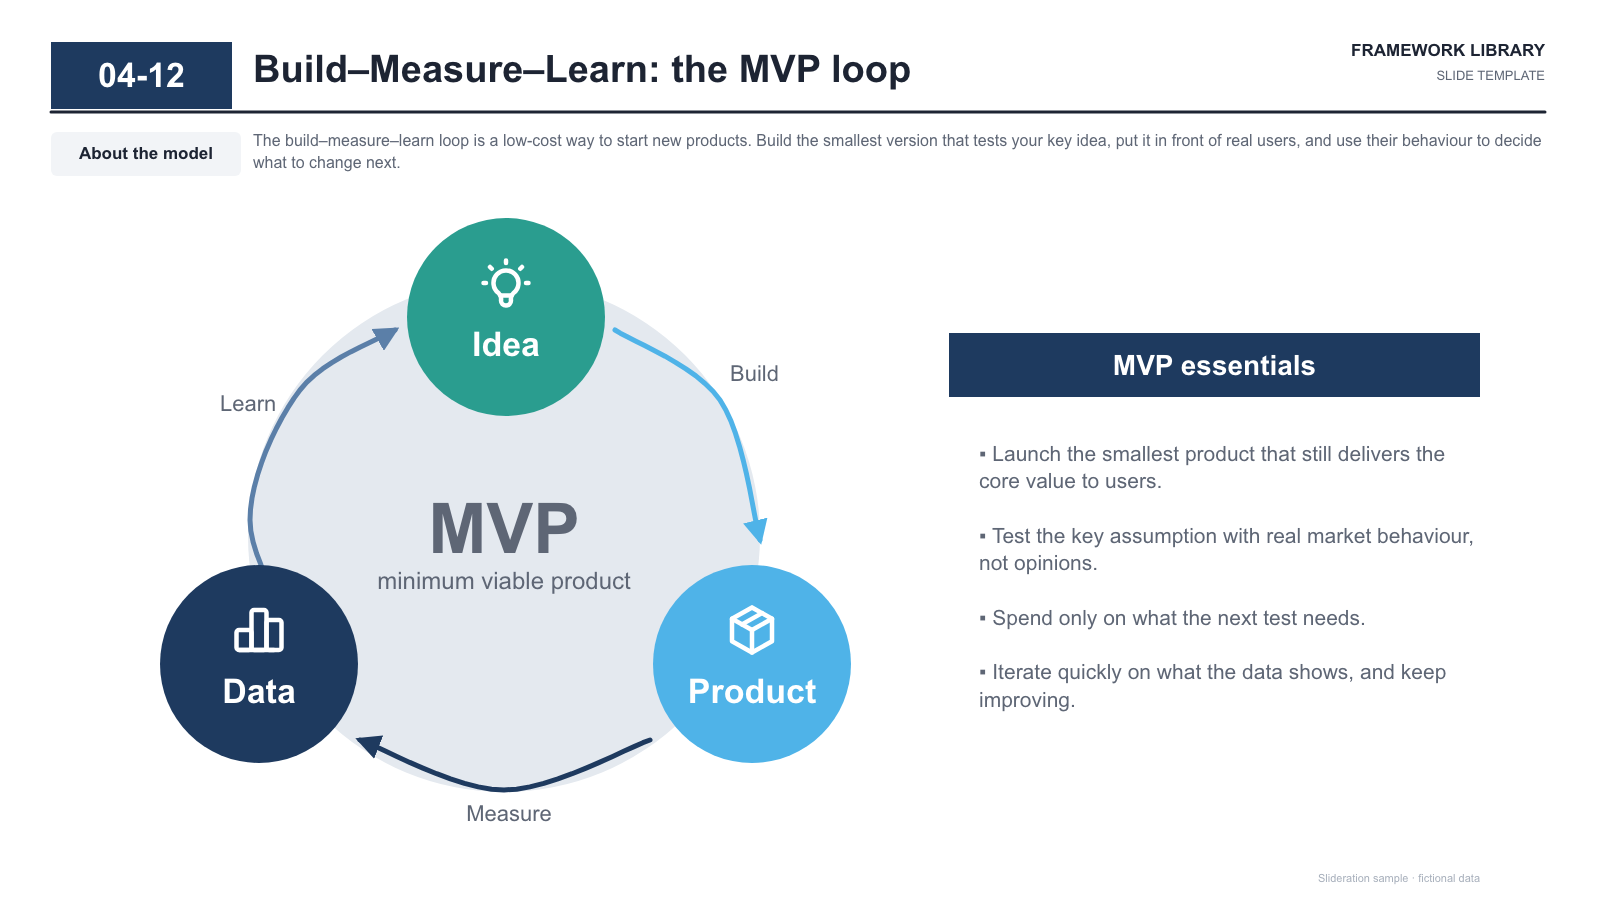
Three-node loop around a large central disc with curved arrows, plus a key-points panel

Three-node loop around a large central disc with curved arrows, plus a key-points panel

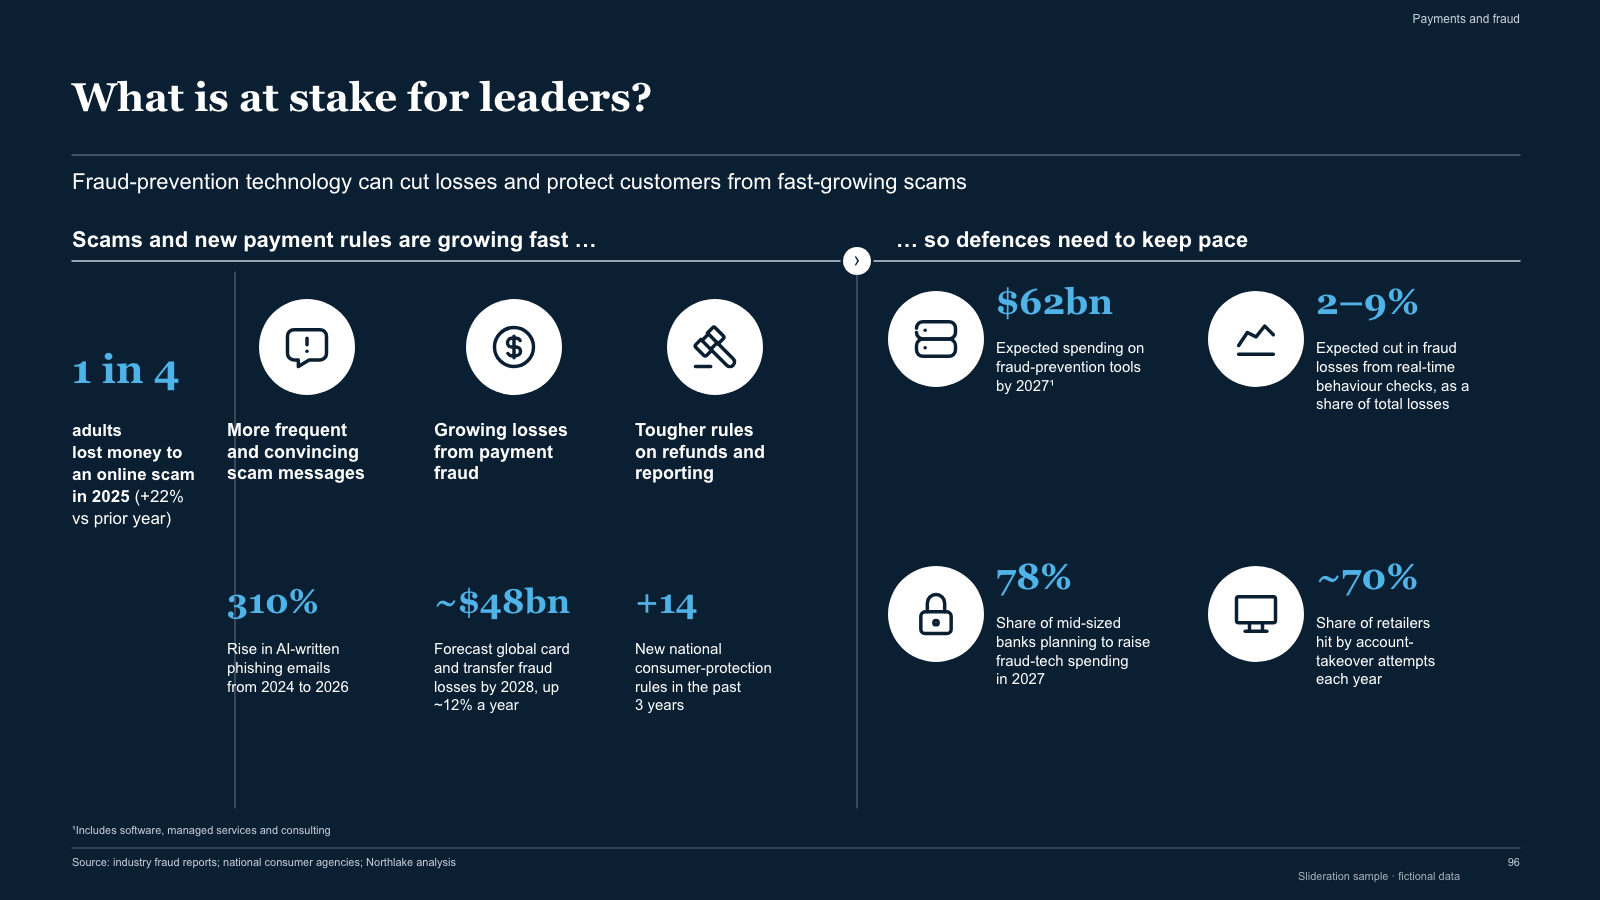
Dark stats dashboard — big lead stat, three icon columns with metrics, and a 2x2 icon-stat grid

Dark stats dashboard — big lead stat, three icon columns with metrics, and a 2x2 icon-stat grid

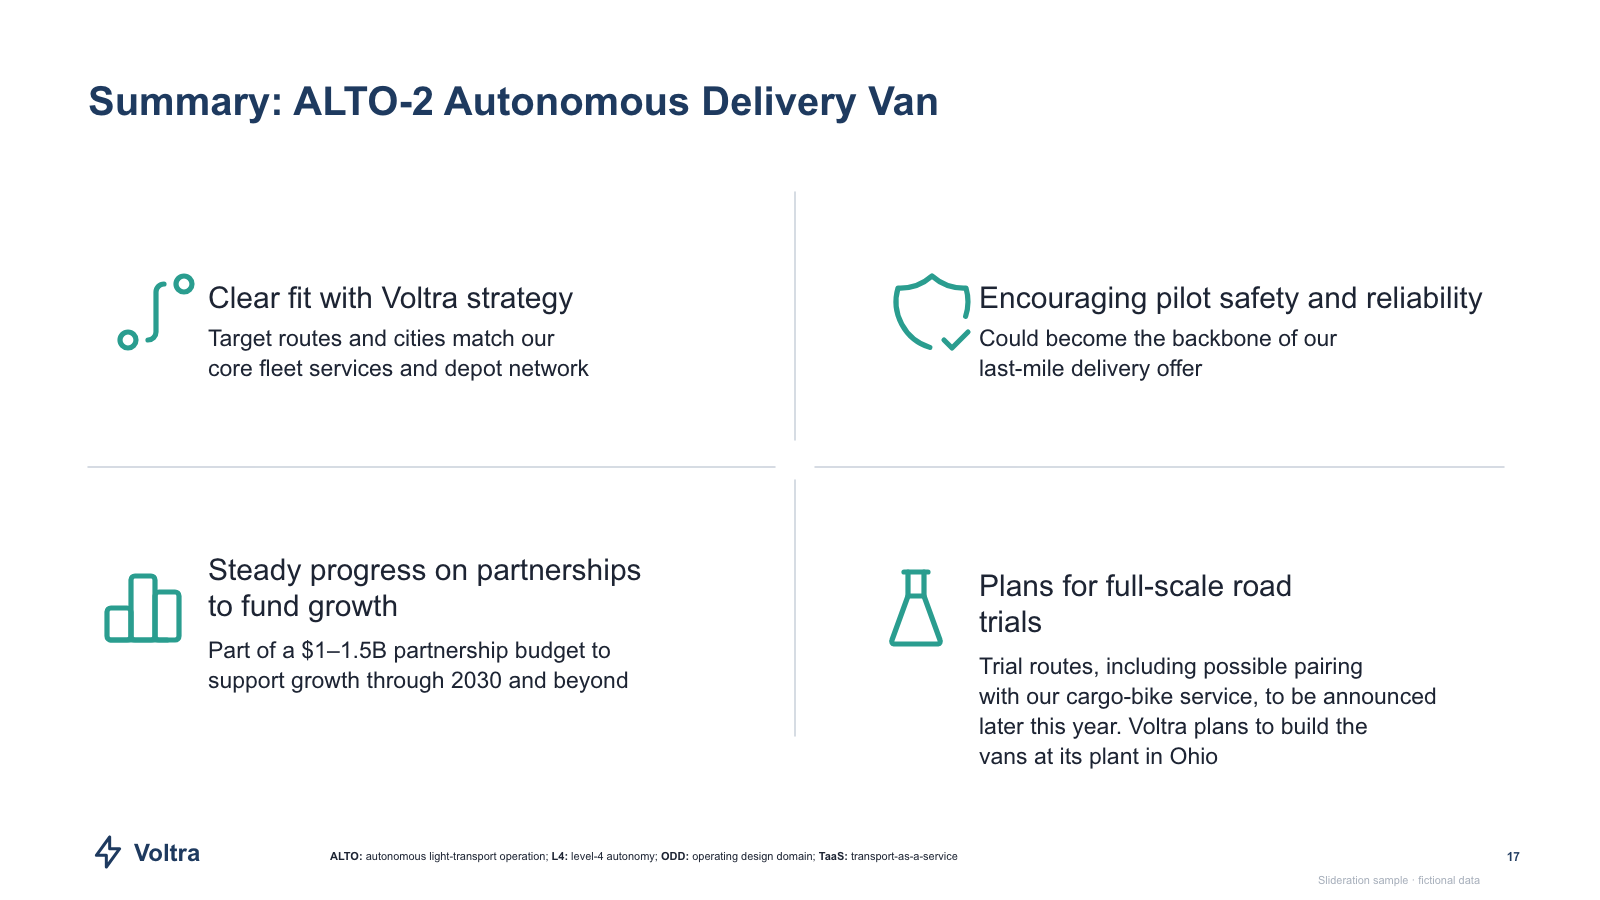
Four quadrant messages with large icons, split by a cross of thin rules

Four quadrant messages with large icons, split by a cross of thin rules

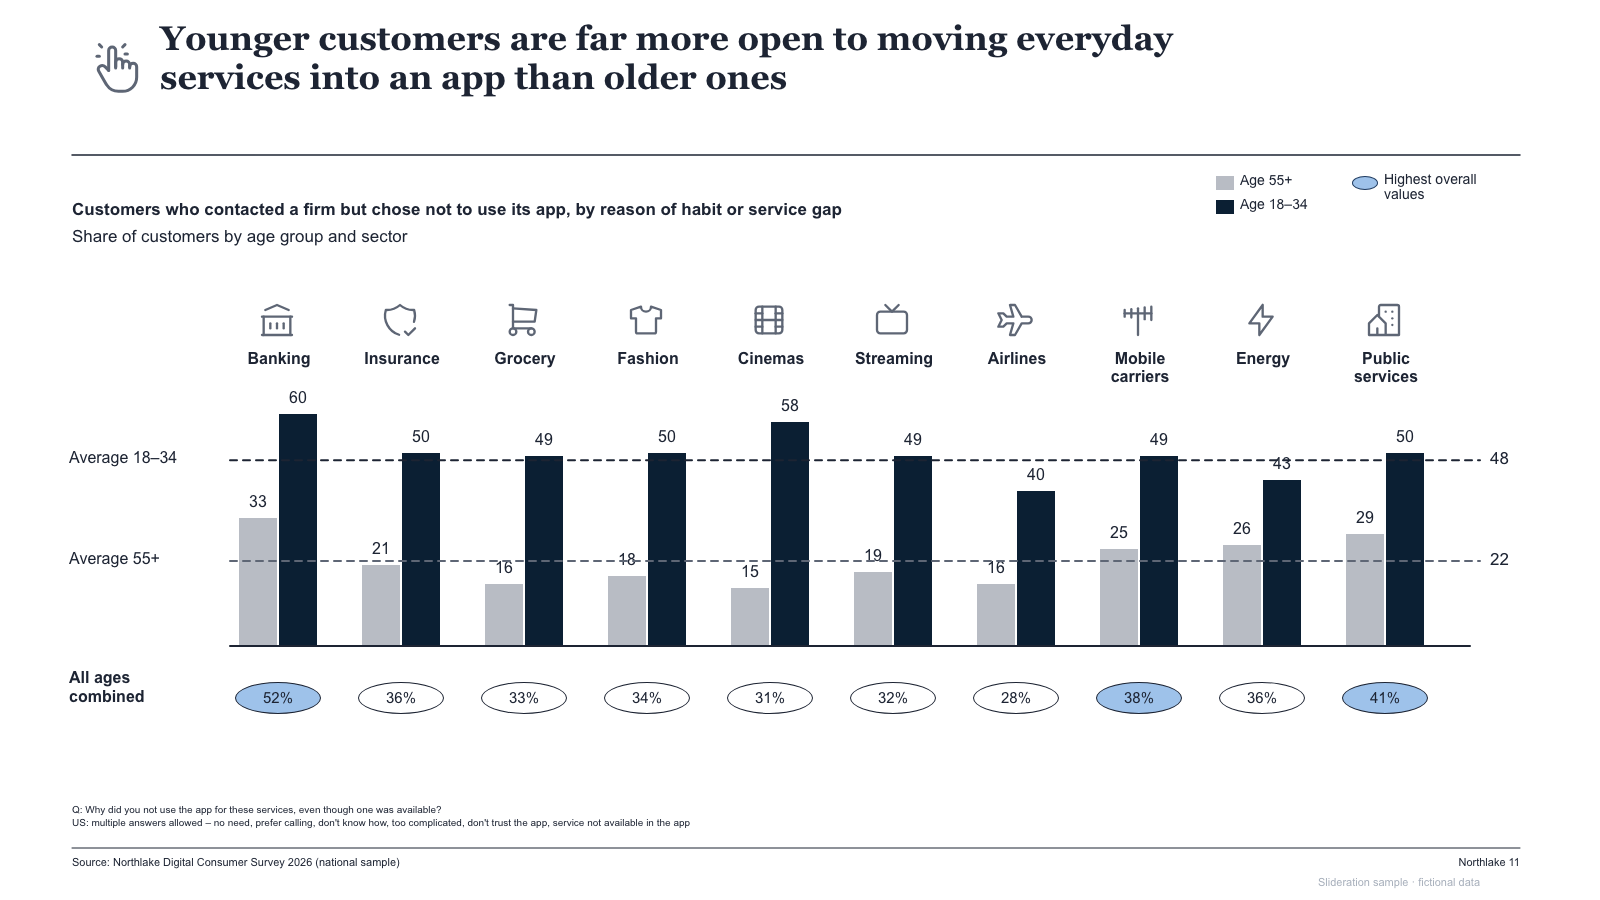
Paired columns by industry (two age groups) with dashed average lines and an average-pill row

Paired columns by industry (two age groups) with dashed average lines and an average-pill row

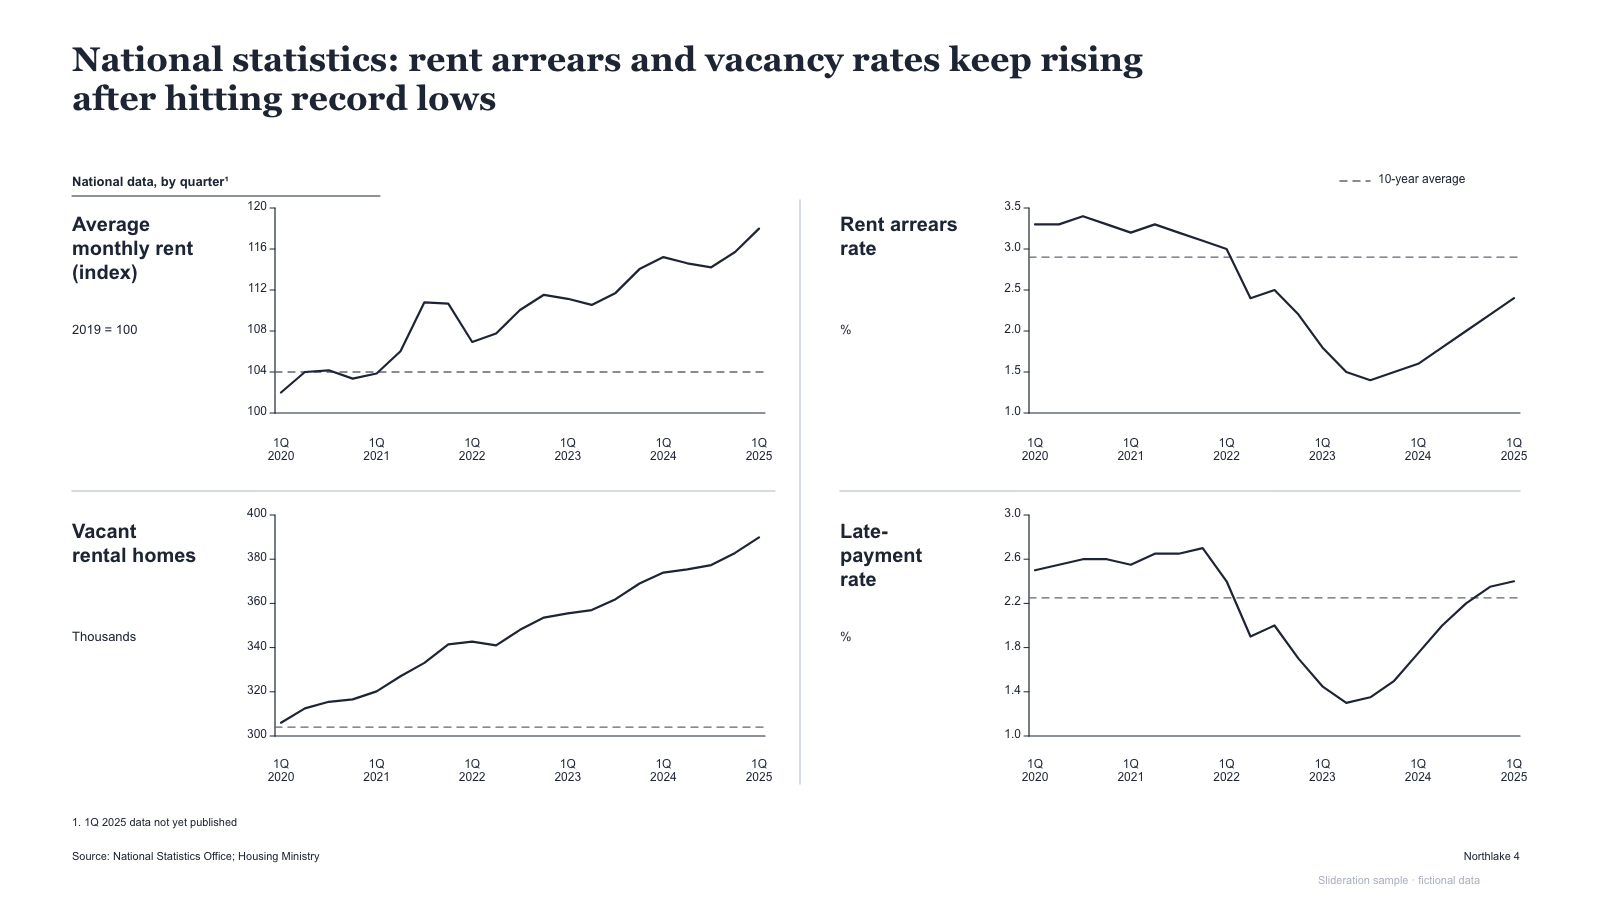
2x2 small-multiple line charts with left-hand labels and dashed long-run averages

2x2 small-multiple line charts with left-hand labels and dashed long-run averages

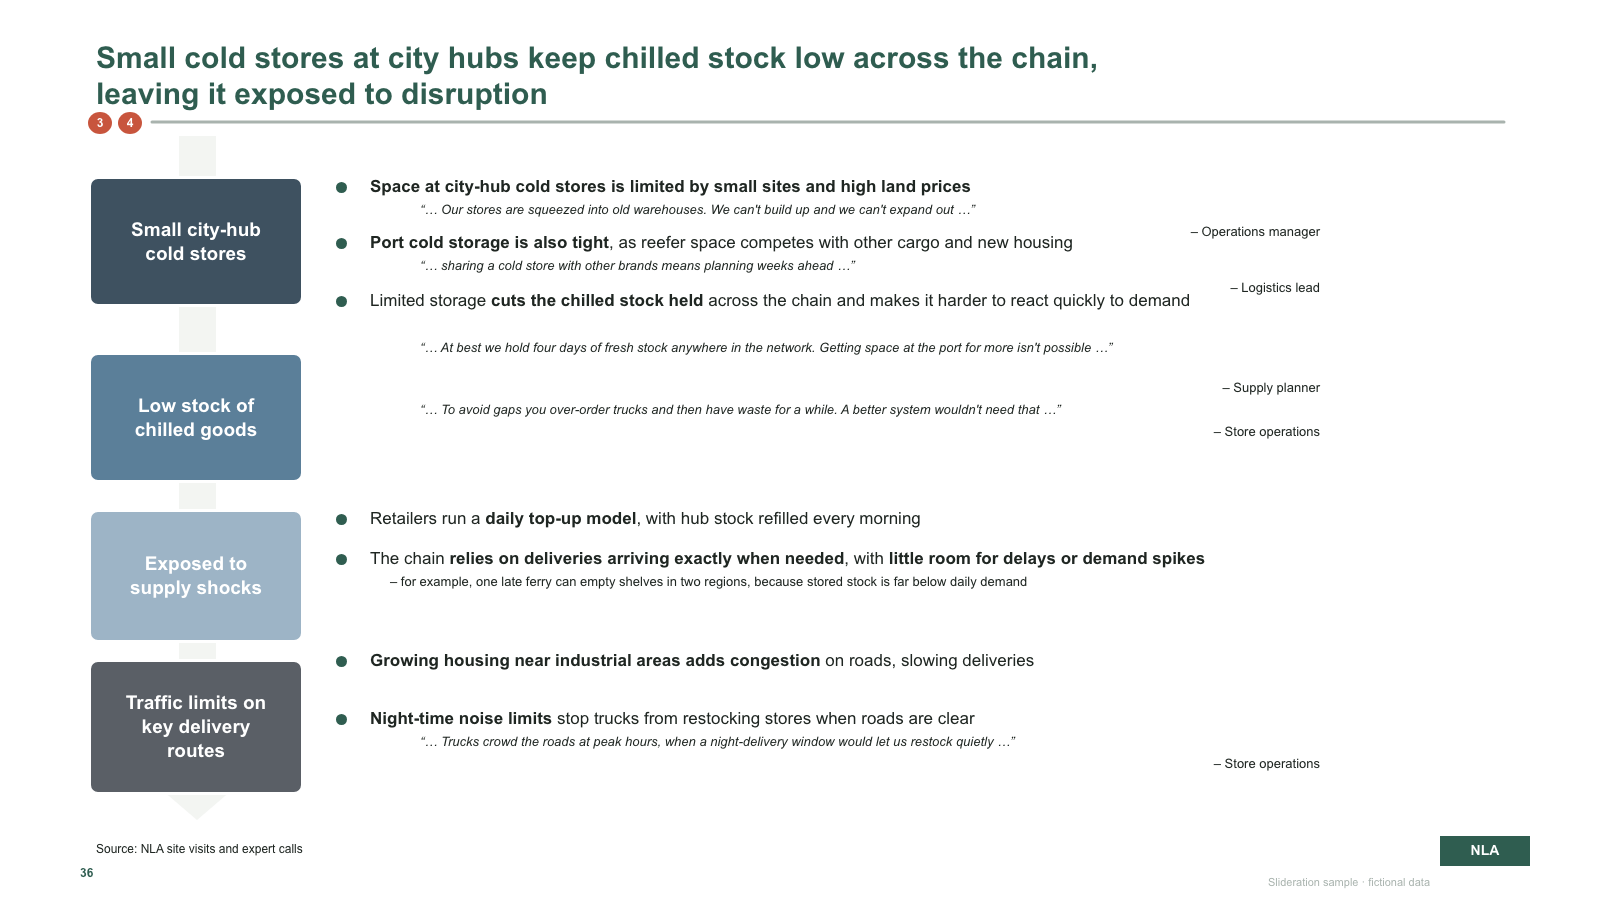
Four stacked cause boxes on a down arrow, each paired with evidence bullets and italic quotes

Four stacked cause boxes on a down arrow, each paired with evidence bullets and italic quotes

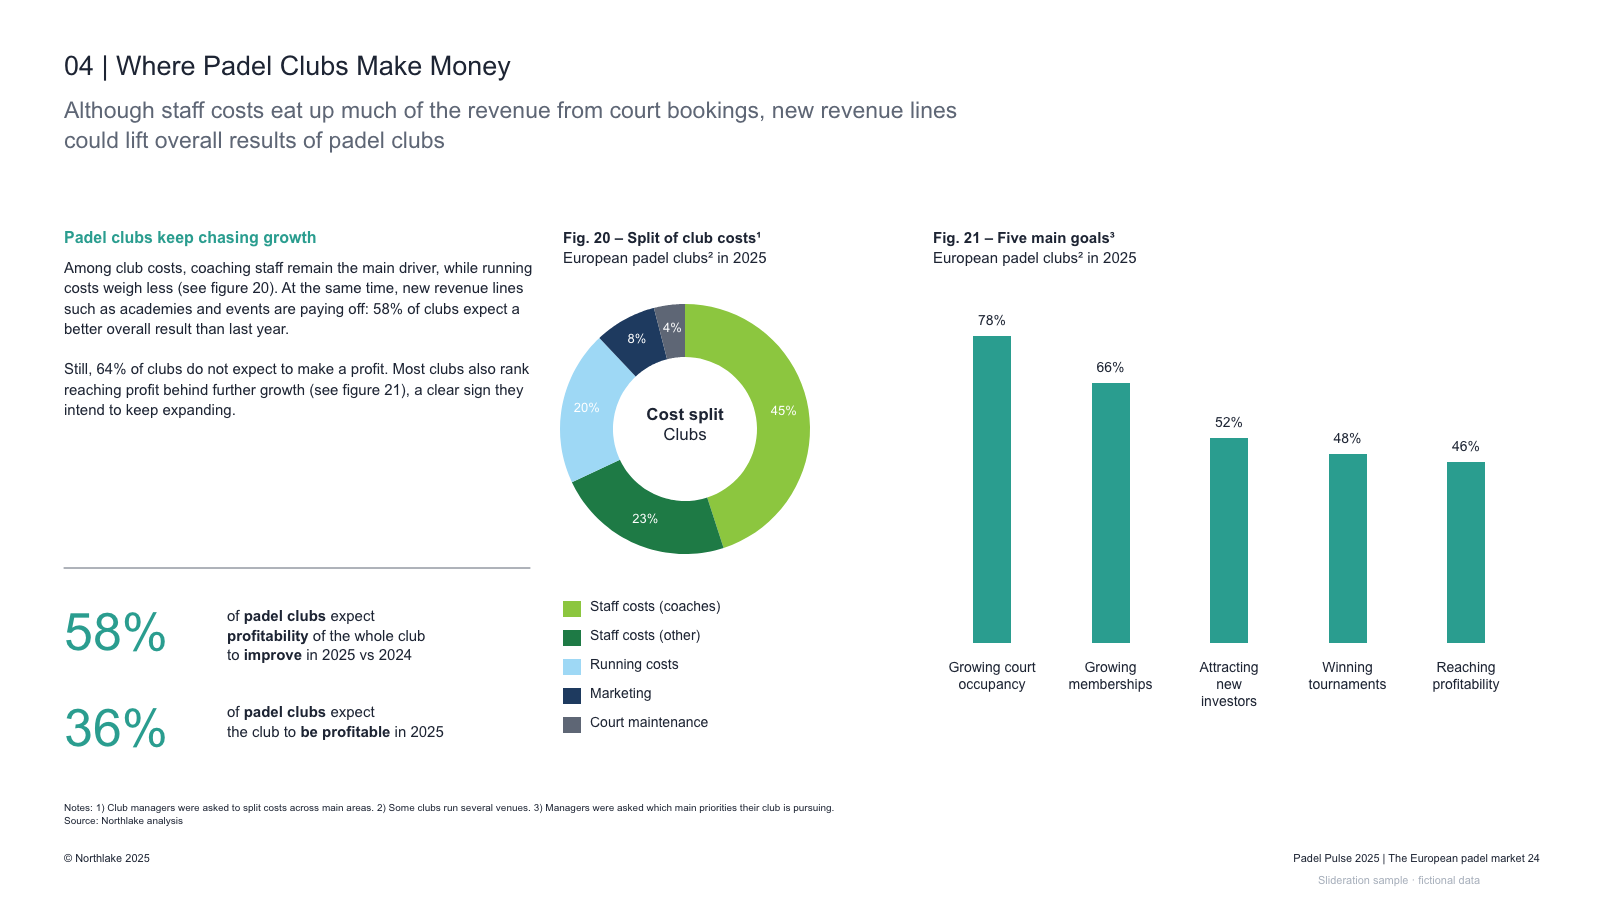
Report page — narrative column with big stats, cost-split donut with legend, and priority bar chart

Report page — narrative column with big stats, cost-split donut with legend, and priority bar chart

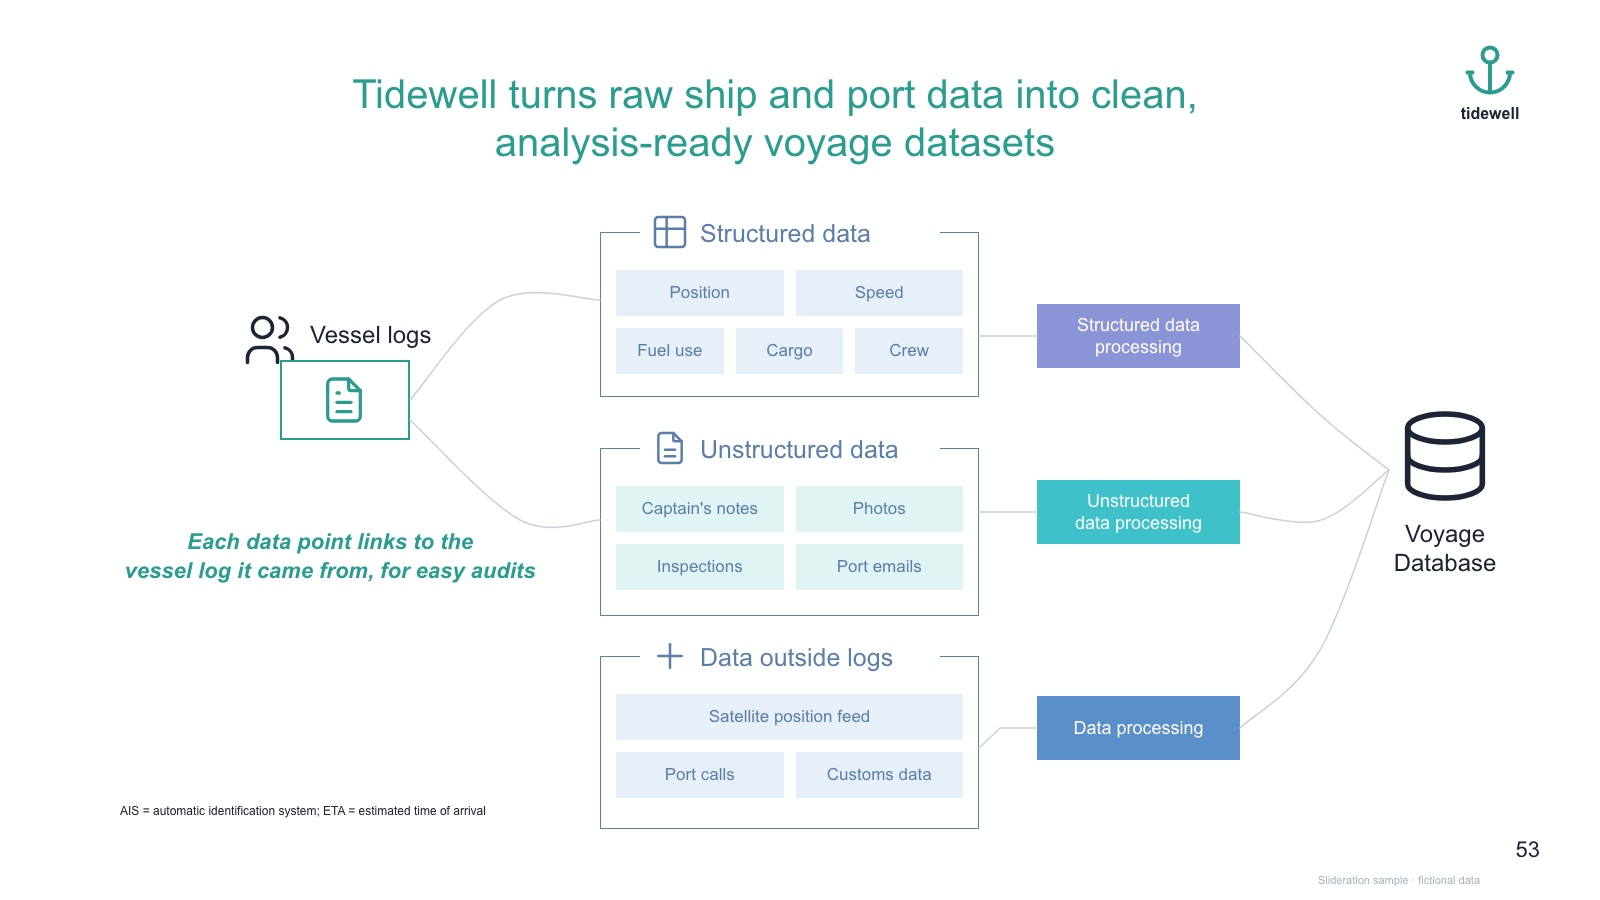
Source-to-database data flow — origin icon, three grouped tag panels, processing boxes and a cylinder

Source-to-database data flow — origin icon, three grouped tag panels, processing boxes and a cylinder

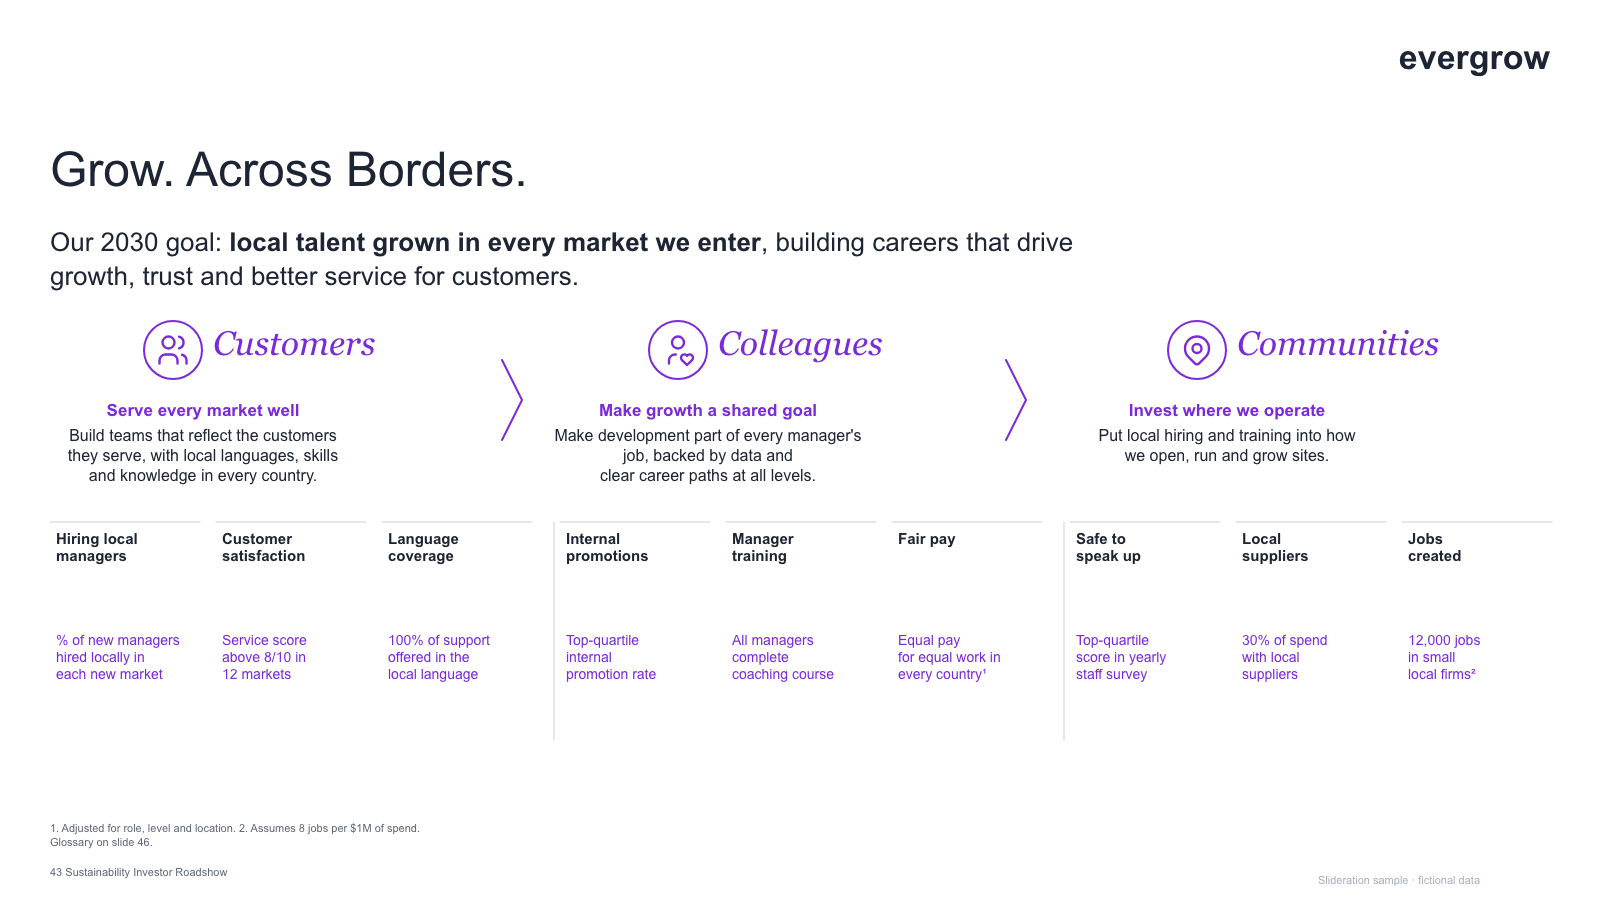
Ambition statement, three icon-led pillars with chevrons, and a nine-column KPI strip

Ambition statement, three icon-led pillars with chevrons, and a nine-column KPI strip

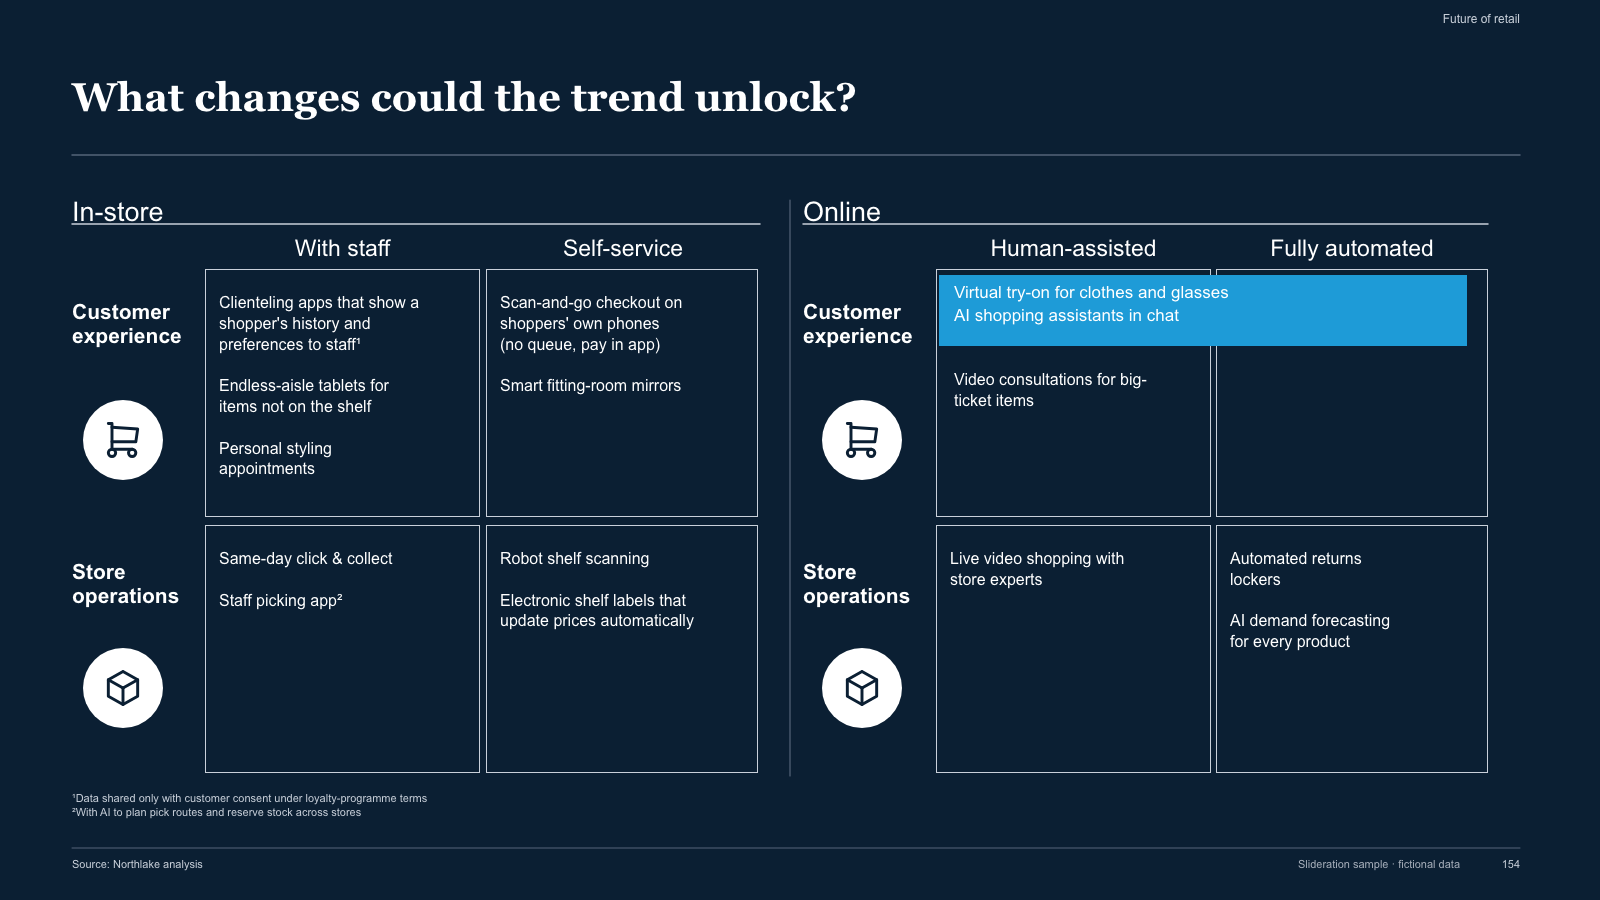
Dark 2x2x2 opportunity grid — two domains, each split into two modes and two use-case rows

Dark 2x2x2 opportunity grid — two domains, each split into two modes and two use-case rows

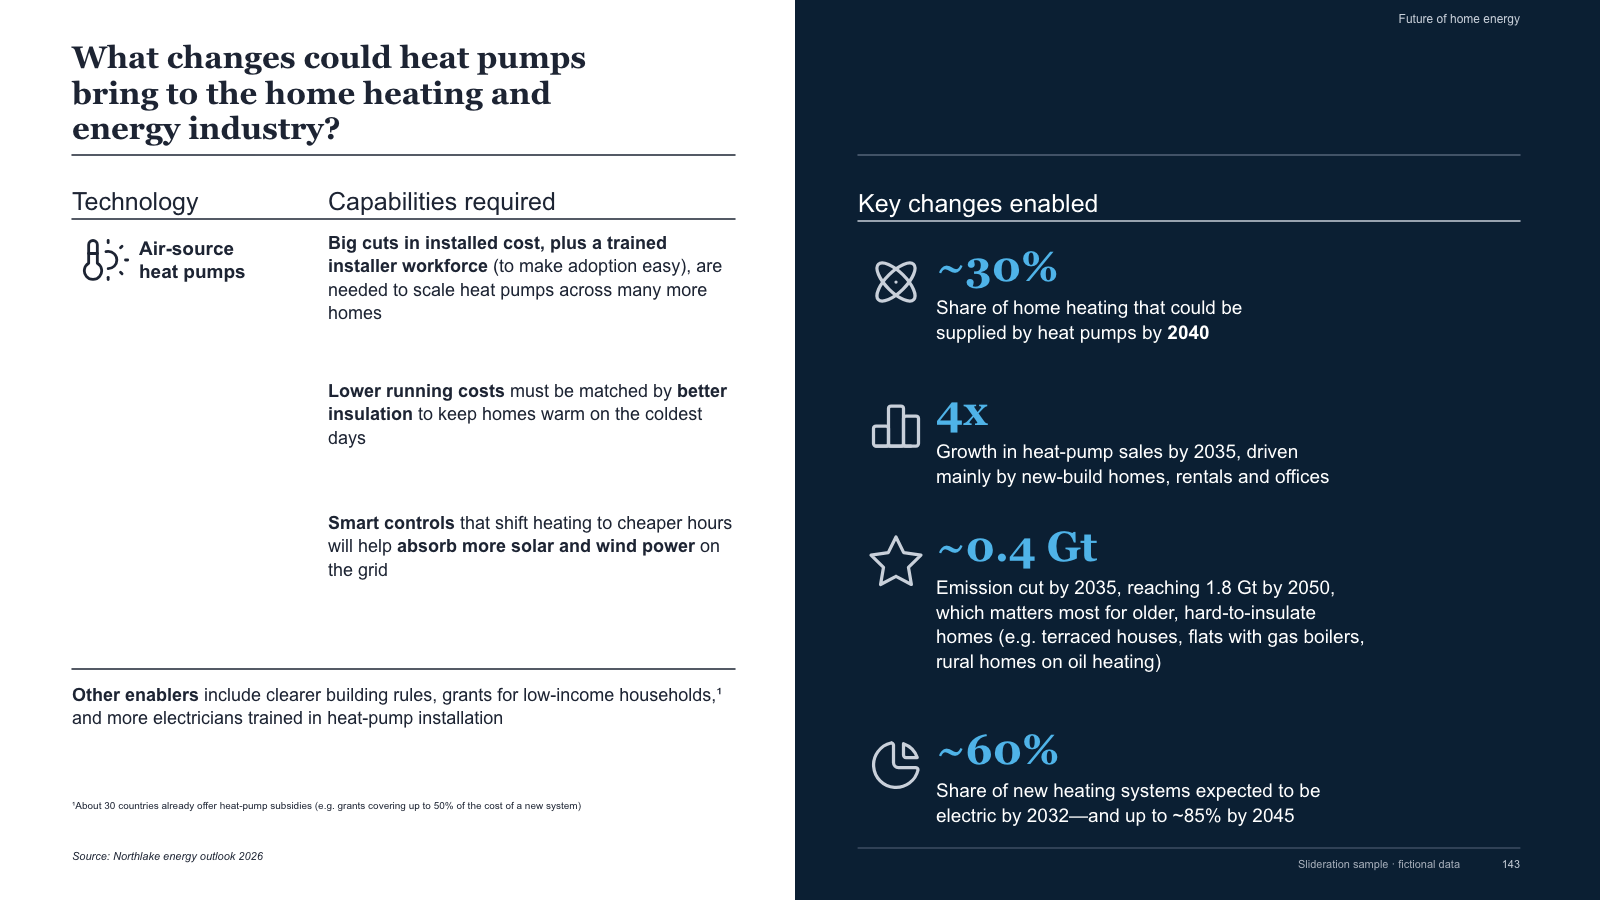
Split slide — technology/capabilities table on white, dark panel of four big-number disruptions

Split slide — technology/capabilities table on white, dark panel of four big-number disruptions

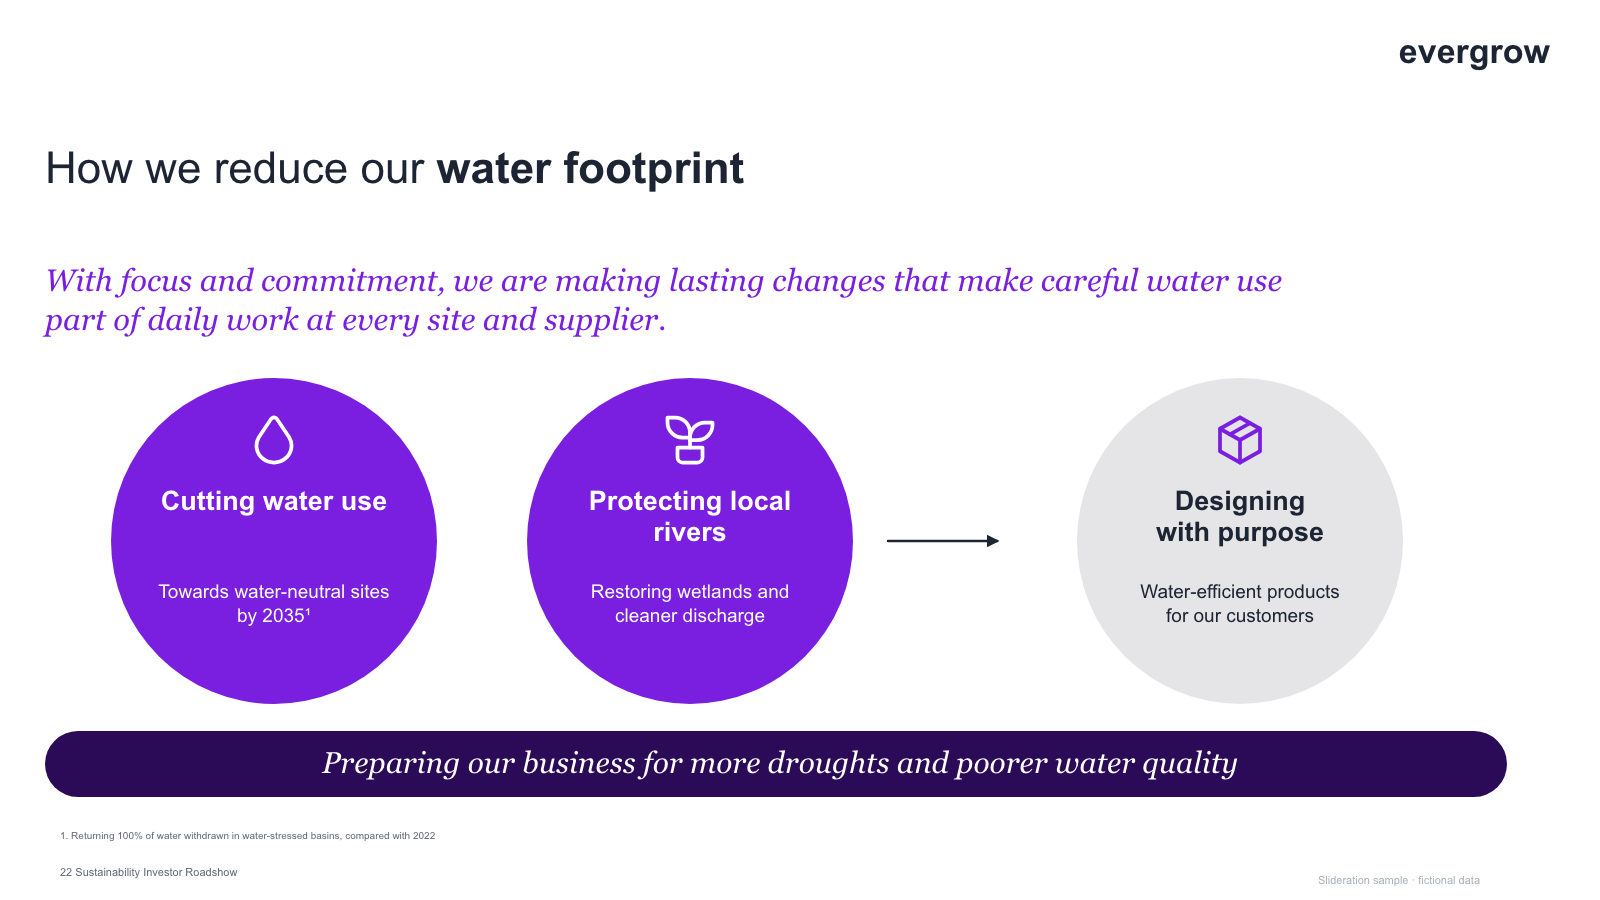
Italic purpose statement, three large circles (two filled, arrow, one muted) and a closing banner

Italic purpose statement, three large circles (two filled, arrow, one muted) and a closing banner

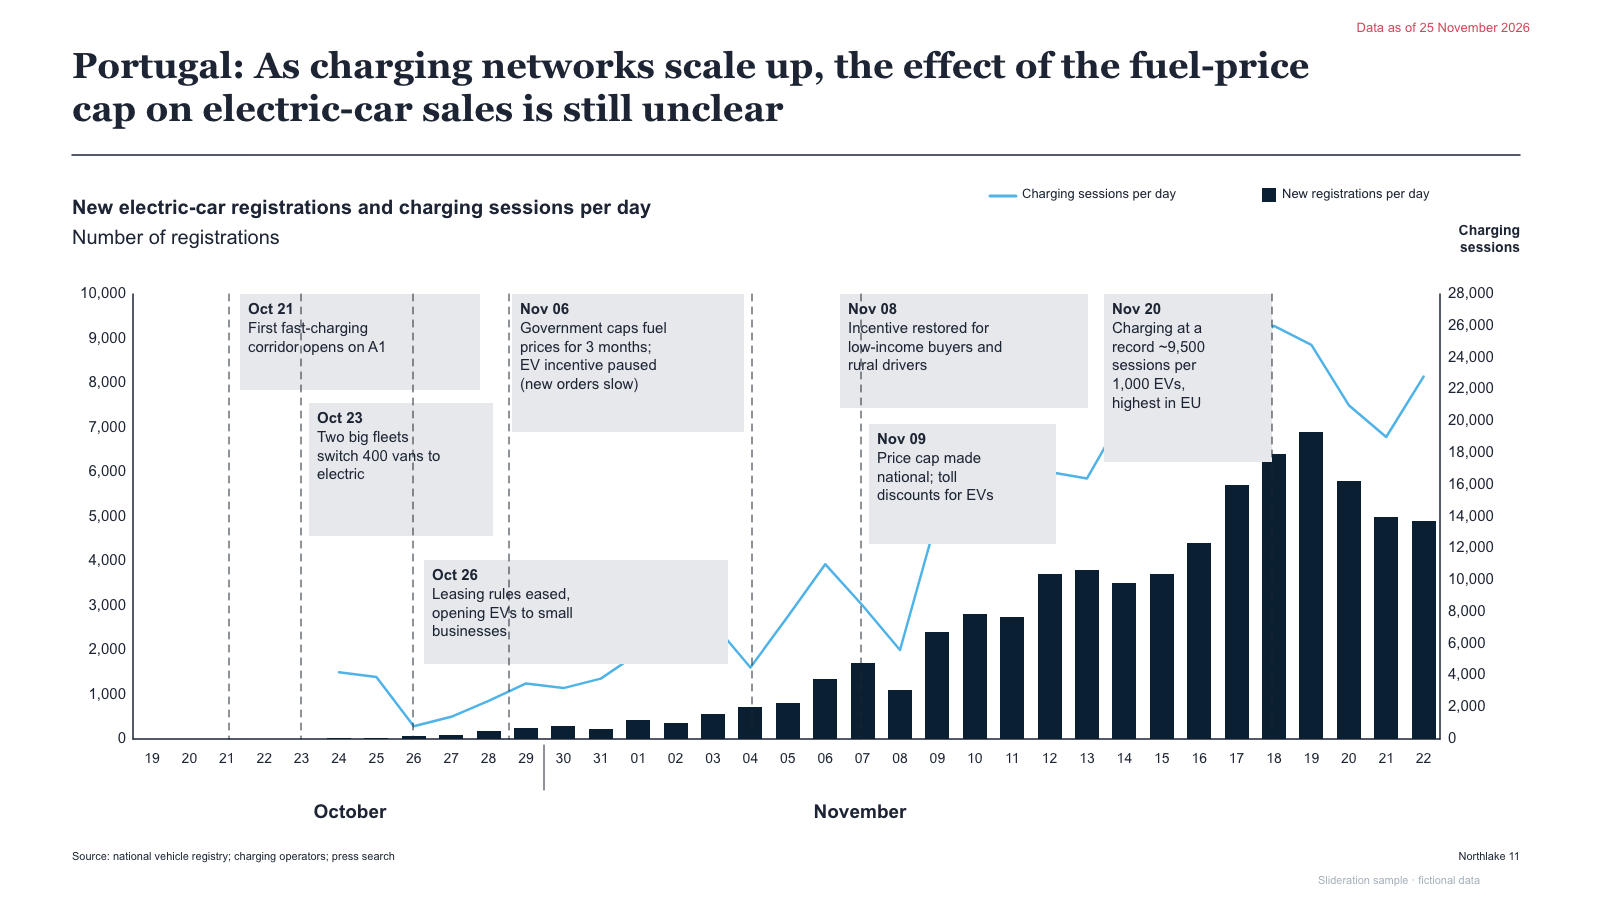
Daily bar + line combo chart on dual axes with dated annotation callouts and dashed markers

Daily bar + line combo chart on dual axes with dated annotation callouts and dashed markers

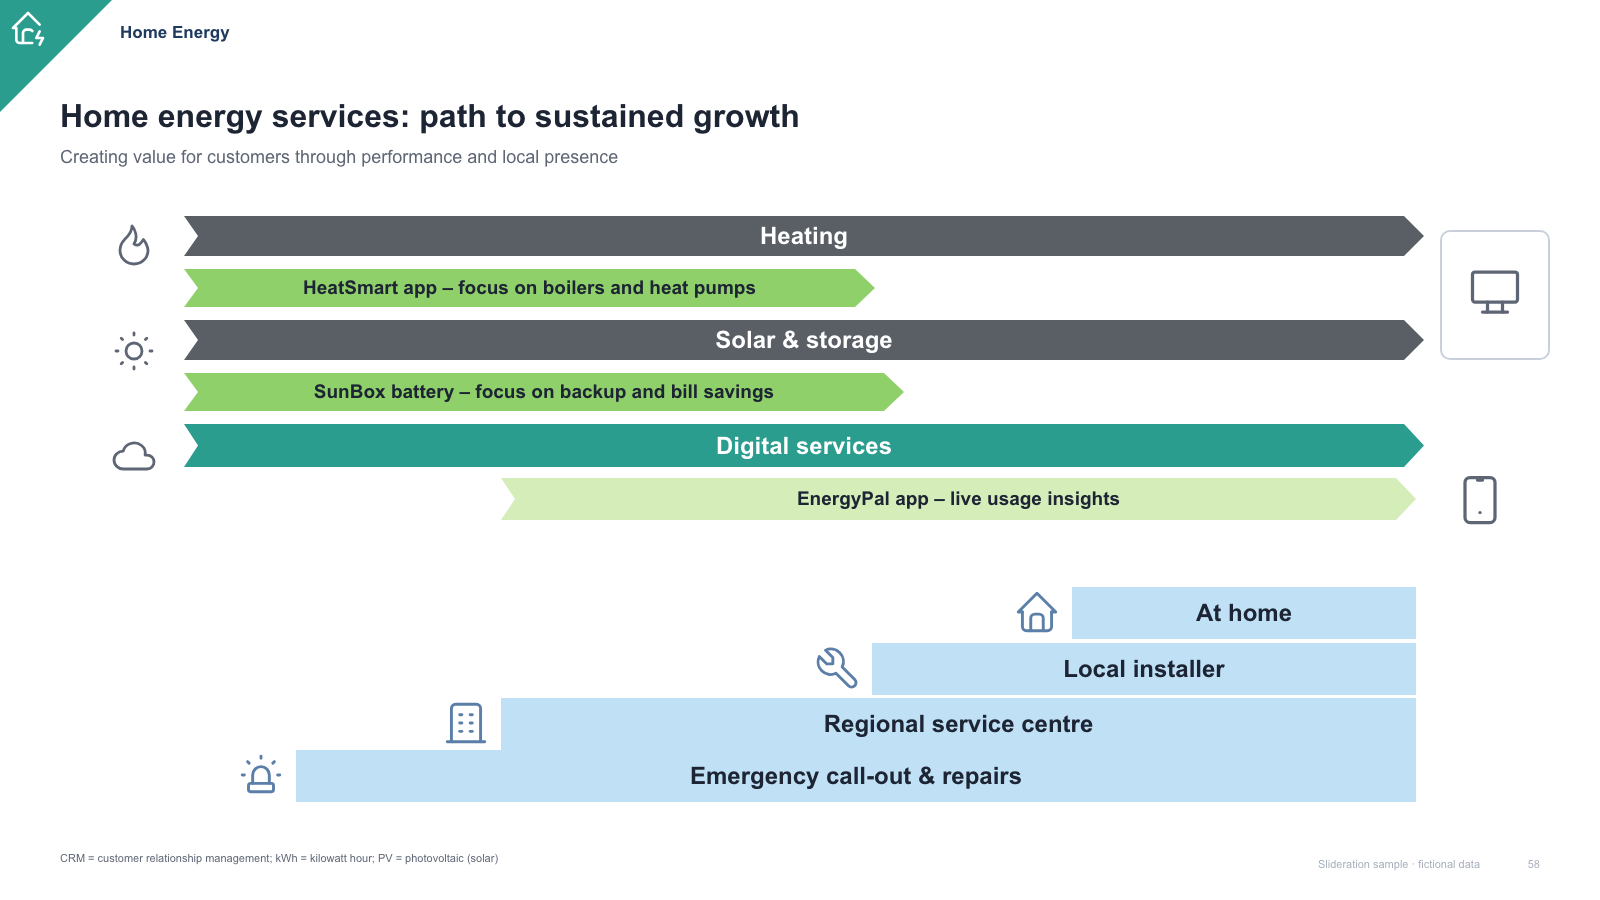
Stacked arrow ribbons (segments with nested offer arrows) above a staircase of service settings

Stacked arrow ribbons (segments with nested offer arrows) above a staircase of service settings

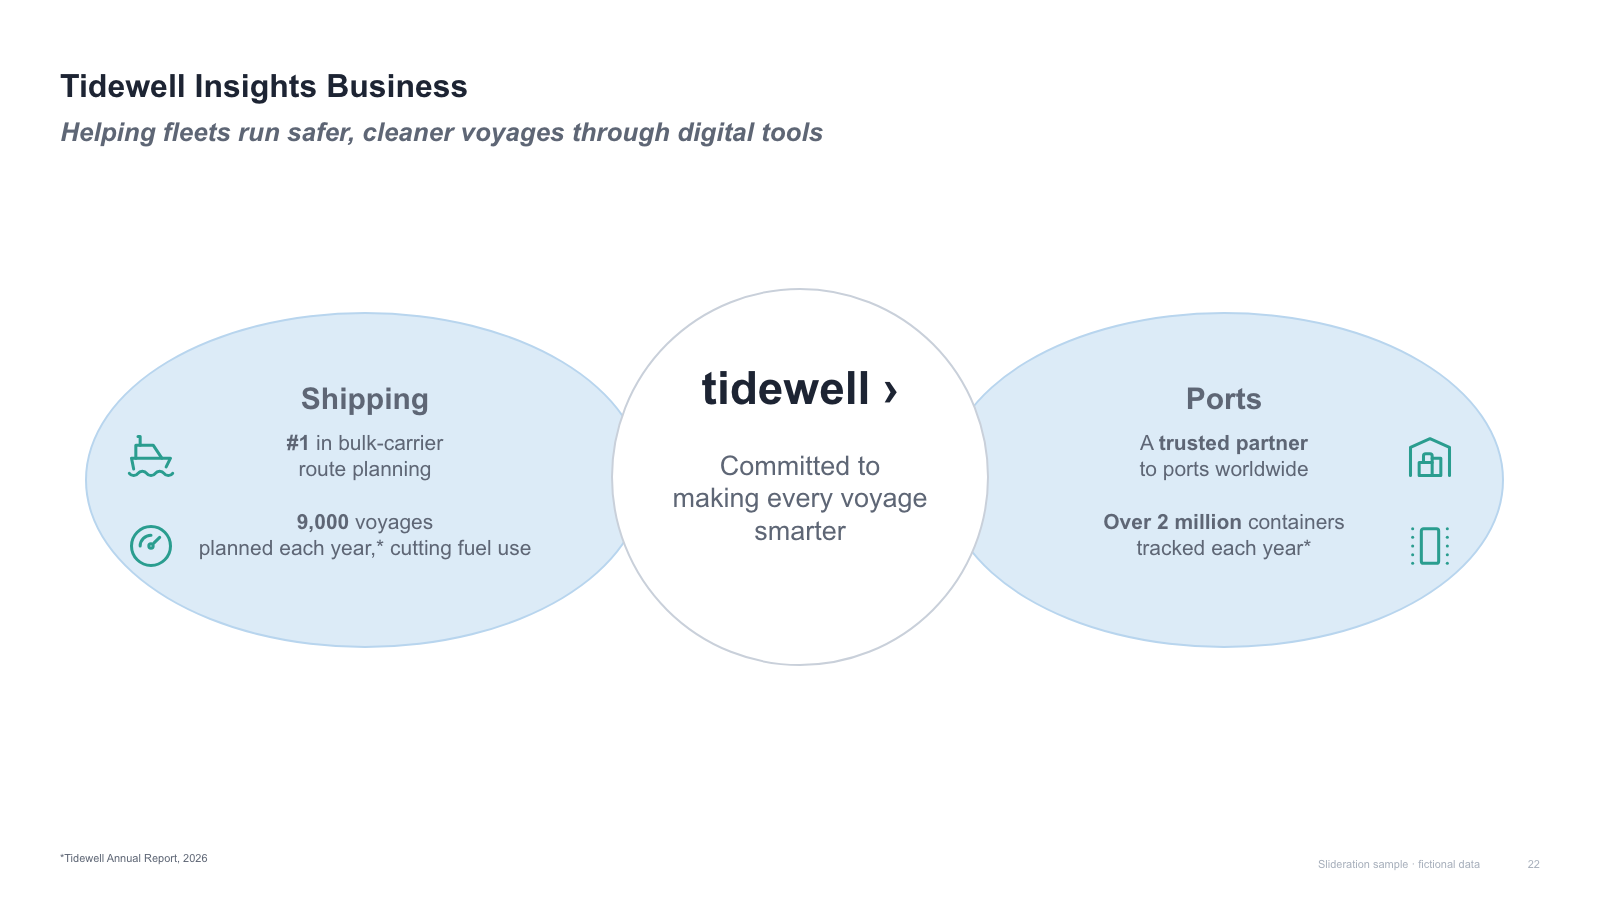
Two side ellipses bridged by a central white circle, each with headline, stats and icons

Two side ellipses bridged by a central white circle, each with headline, stats and icons

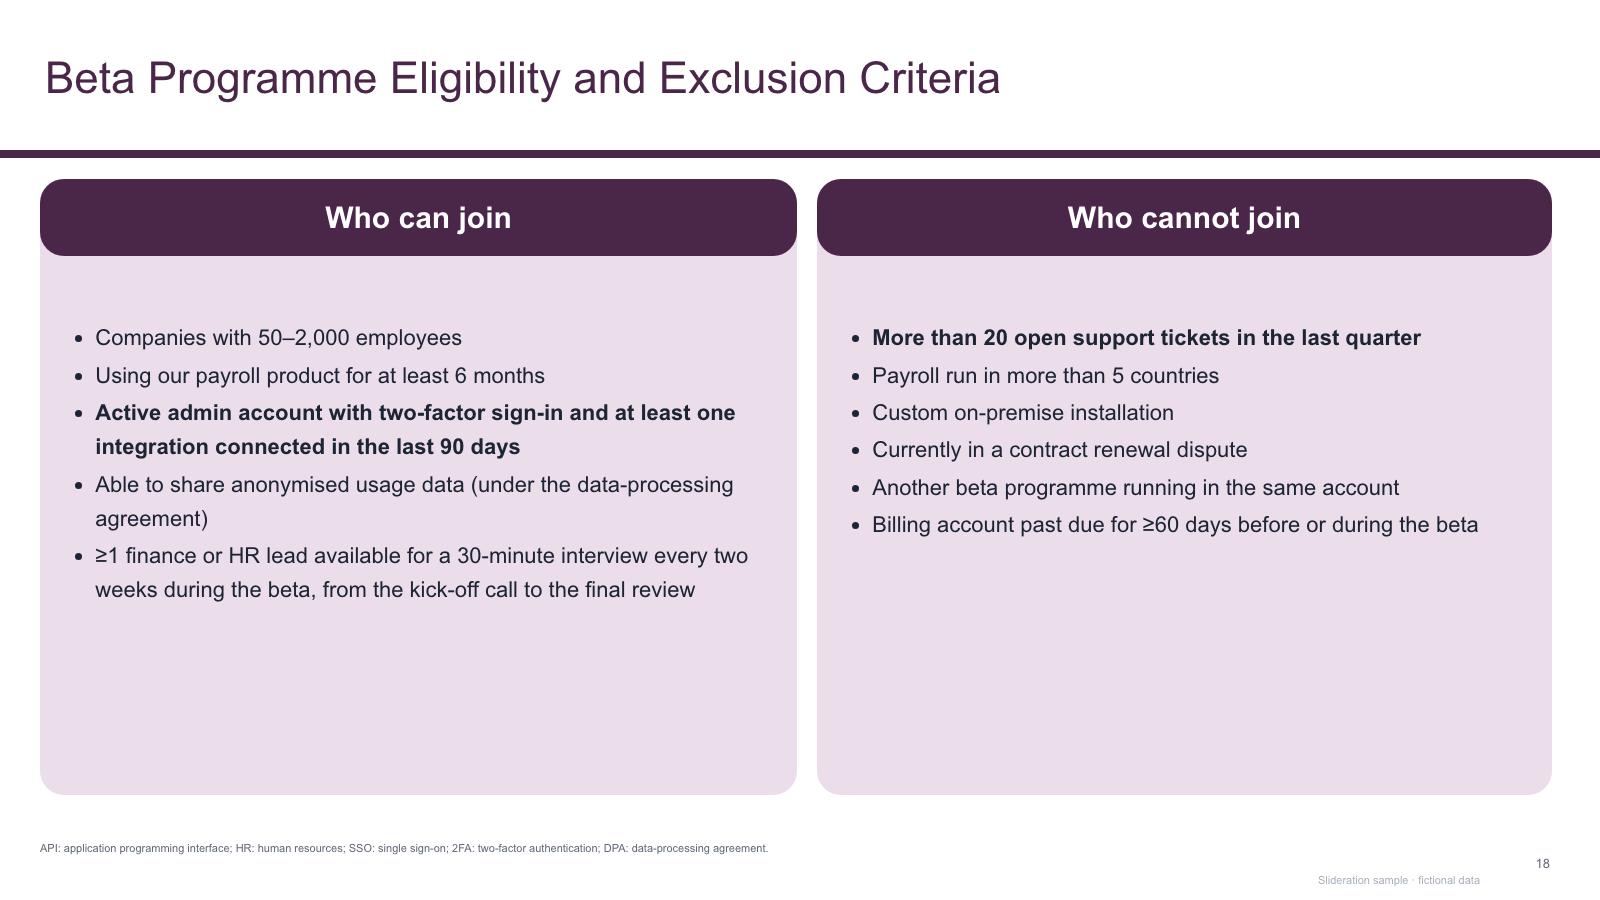
Two criteria panels with dark rounded headers and tinted bullet bodies

Two criteria panels with dark rounded headers and tinted bullet bodies

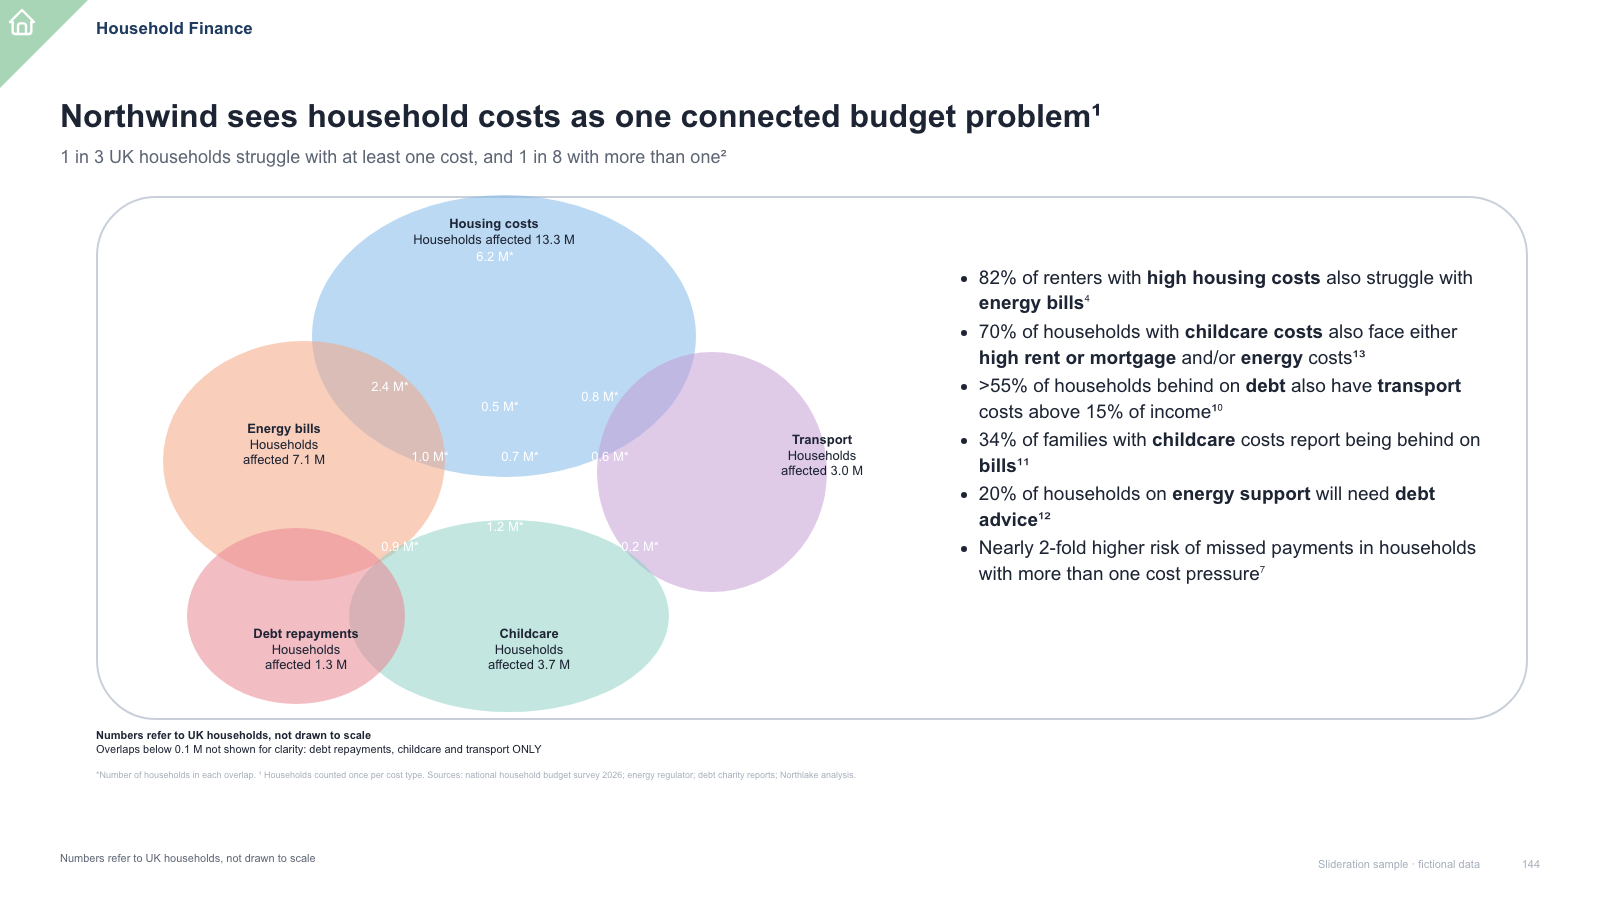
Rounded frame holding an overlapping multi-set Venn diagram with counts, plus bullet statistics

Rounded frame holding an overlapping multi-set Venn diagram with counts, plus bullet statistics

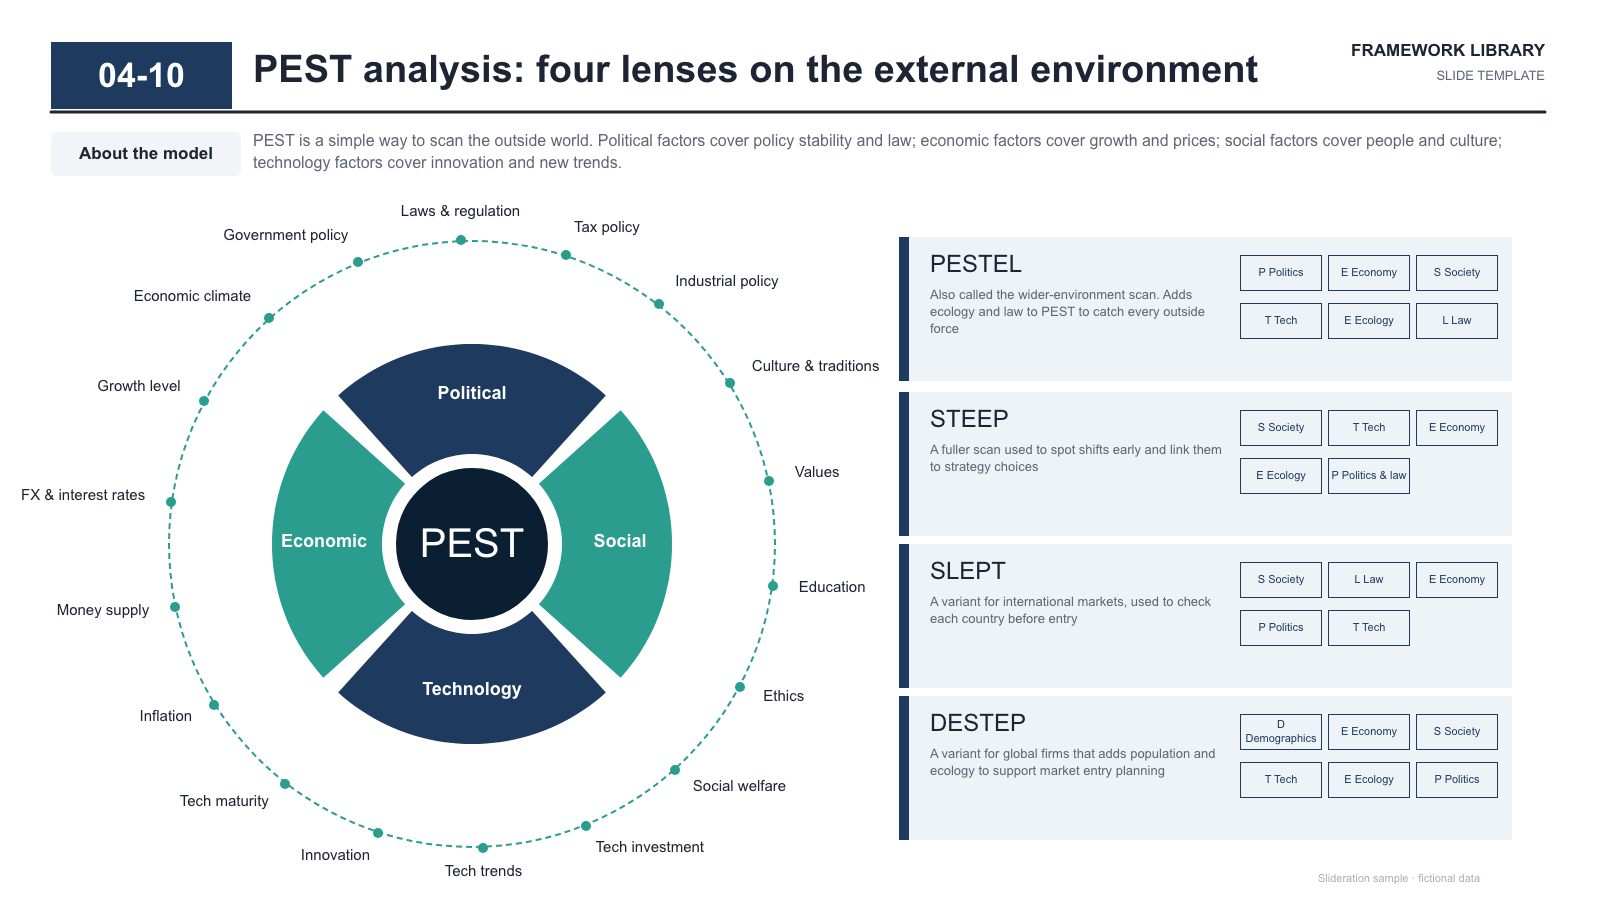
Four-segment ring framework with an outer dotted ring of factor labels and four variant panels

Four-segment ring framework with an outer dotted ring of factor labels and four variant panels

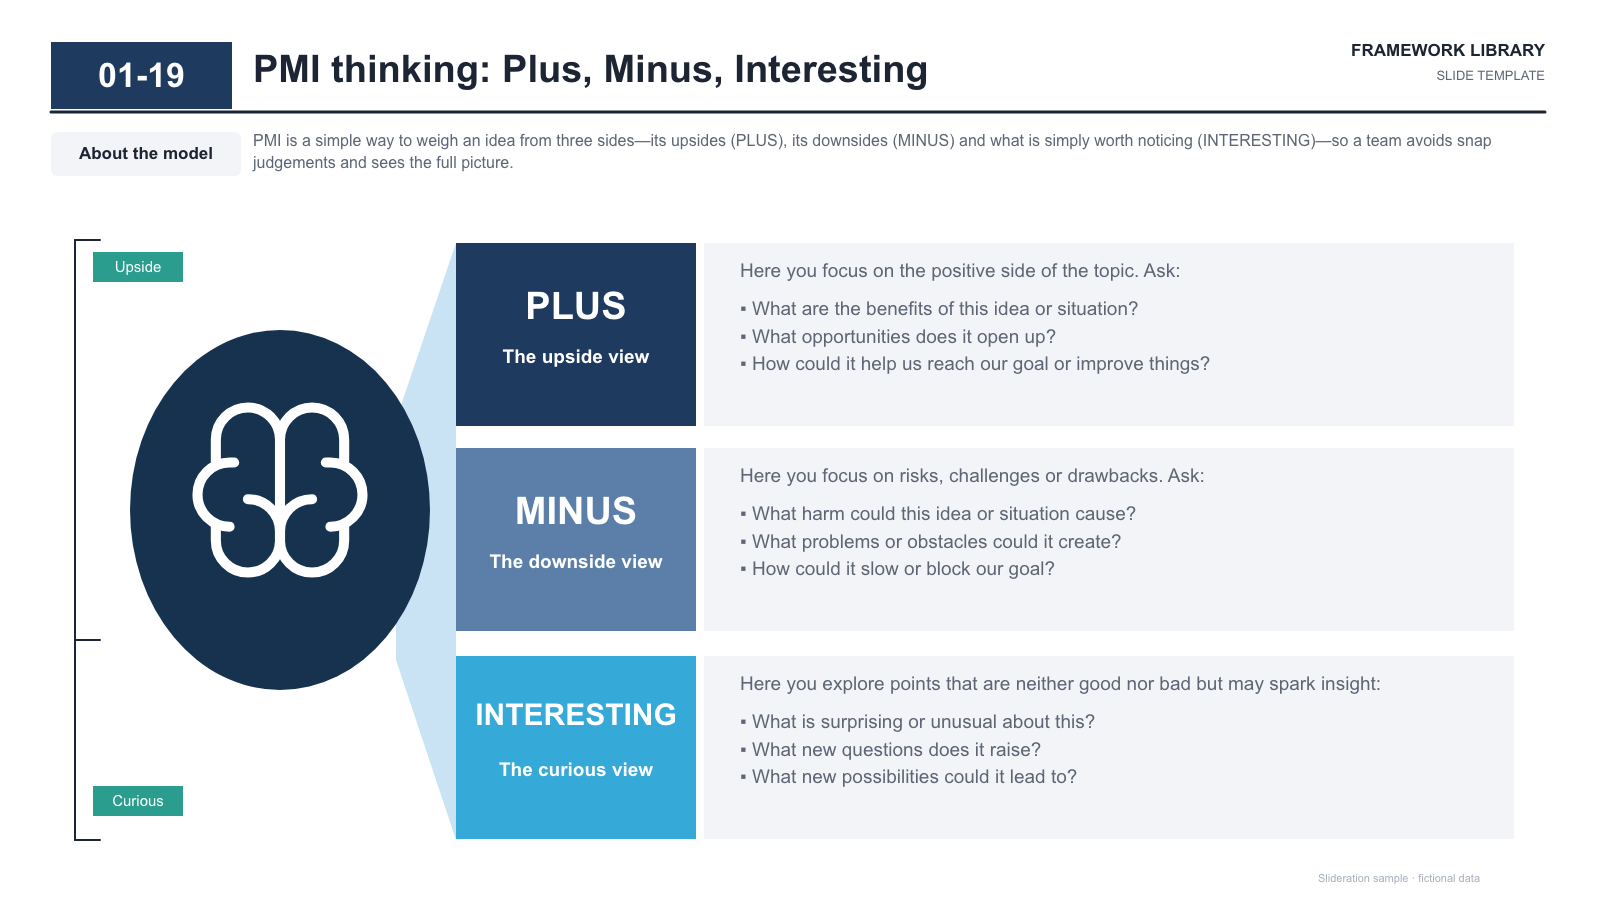
Head icon with light beam fanning into three labelled tiles, each with a question panel

Head icon with light beam fanning into three labelled tiles, each with a question panel

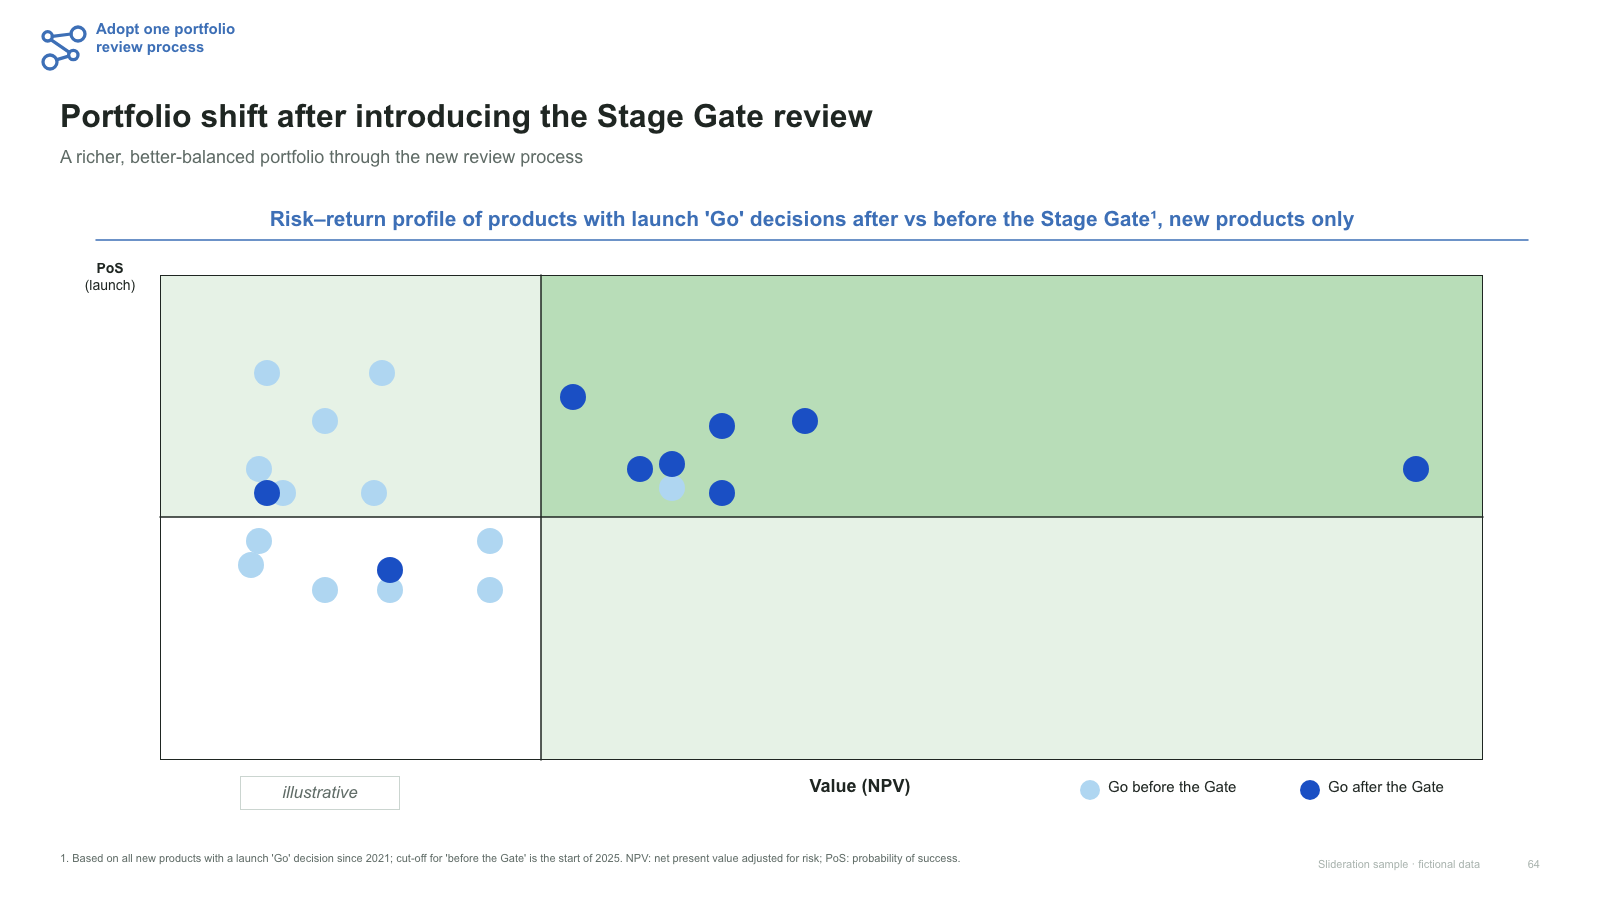
Quadrant scatter chart comparing two cohorts, with tinted quadrants, axis labels and legend

Quadrant scatter chart comparing two cohorts, with tinted quadrants, axis labels and legend

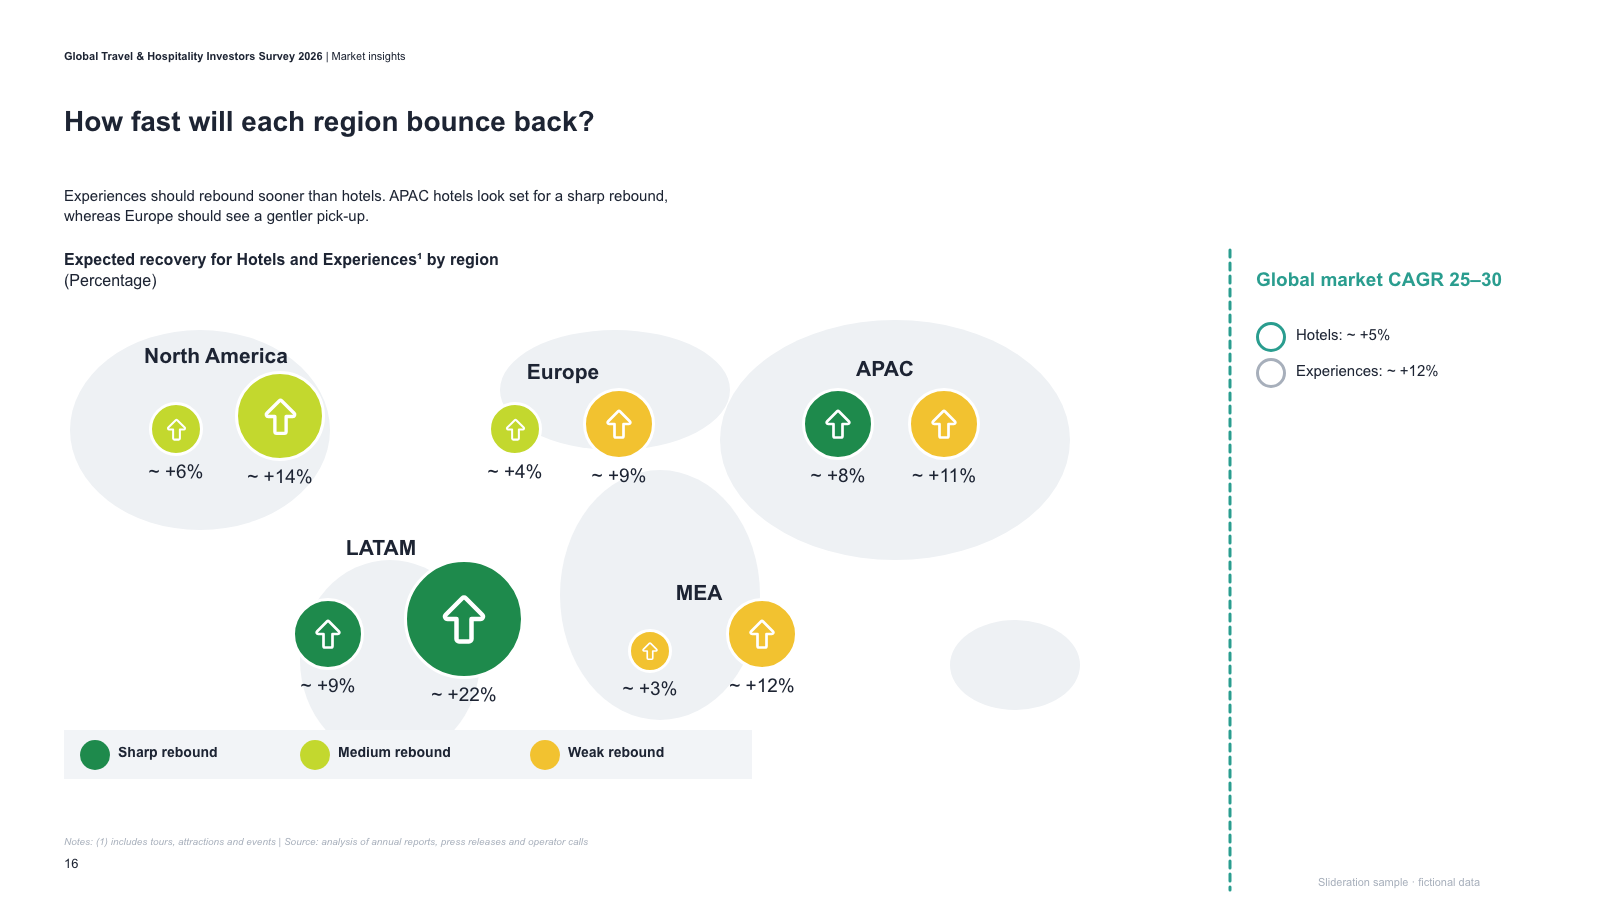
Map-style regional panel with paired recovery badges and values, legend and a side CAGR note

Map-style regional panel with paired recovery badges and values, legend and a side CAGR note

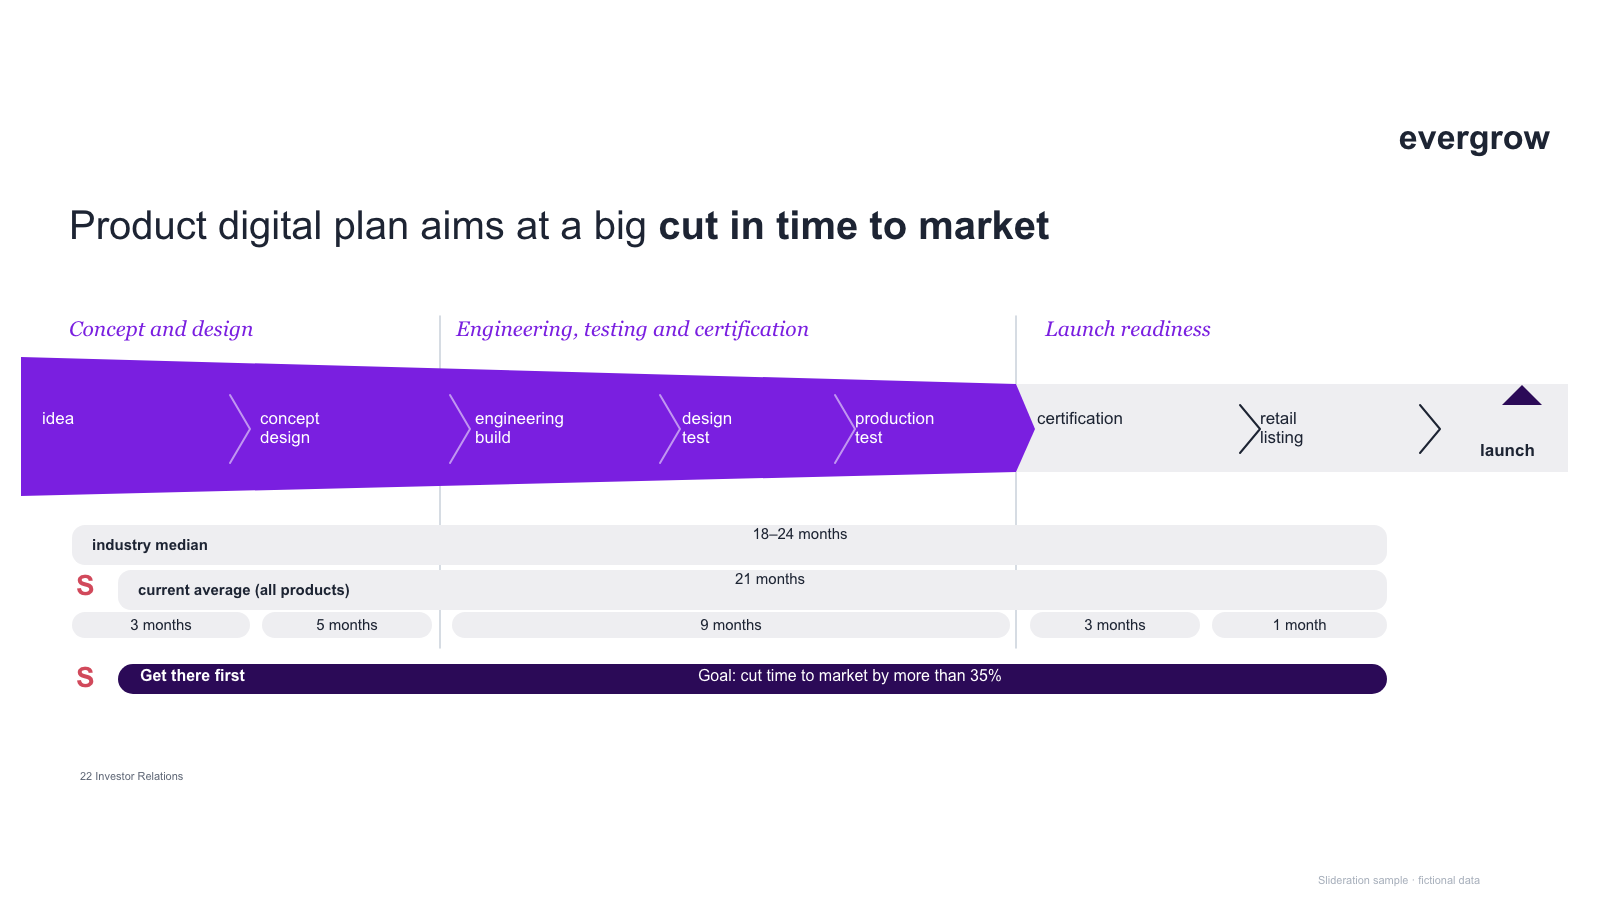
Phase ribbon (coloured arrow band + grey tail with milestone) over timeline pill rows and a goal bar

Phase ribbon (coloured arrow band + grey tail with milestone) over timeline pill rows and a goal bar

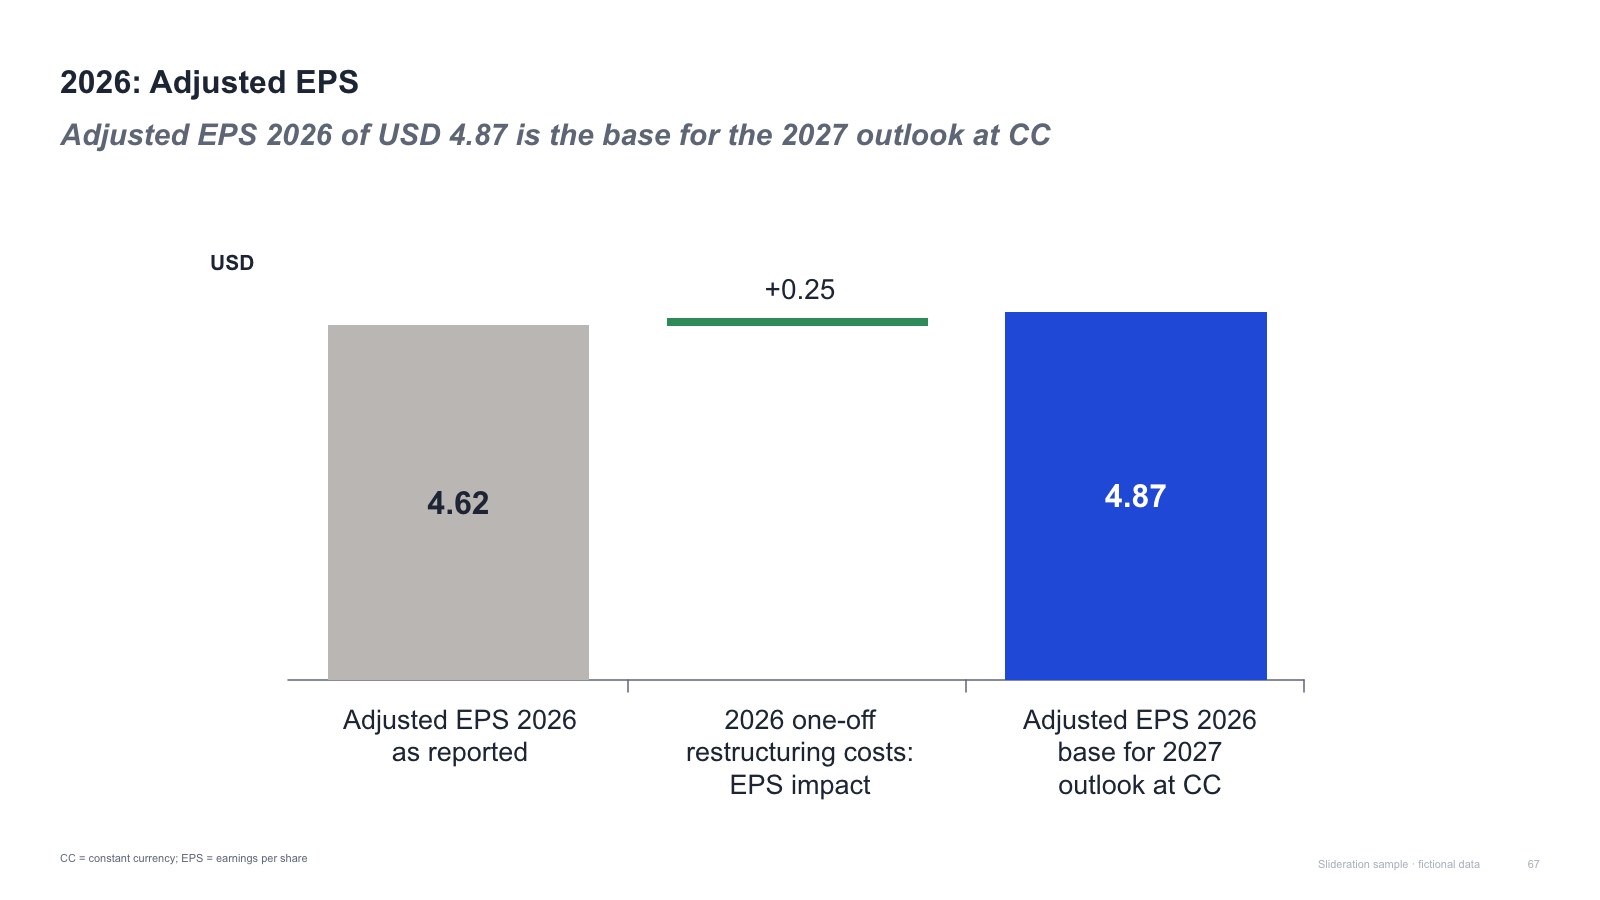
Three-bar bridge — reported value, a single small step and the adjusted base value

Three-bar bridge — reported value, a single small step and the adjusted base value

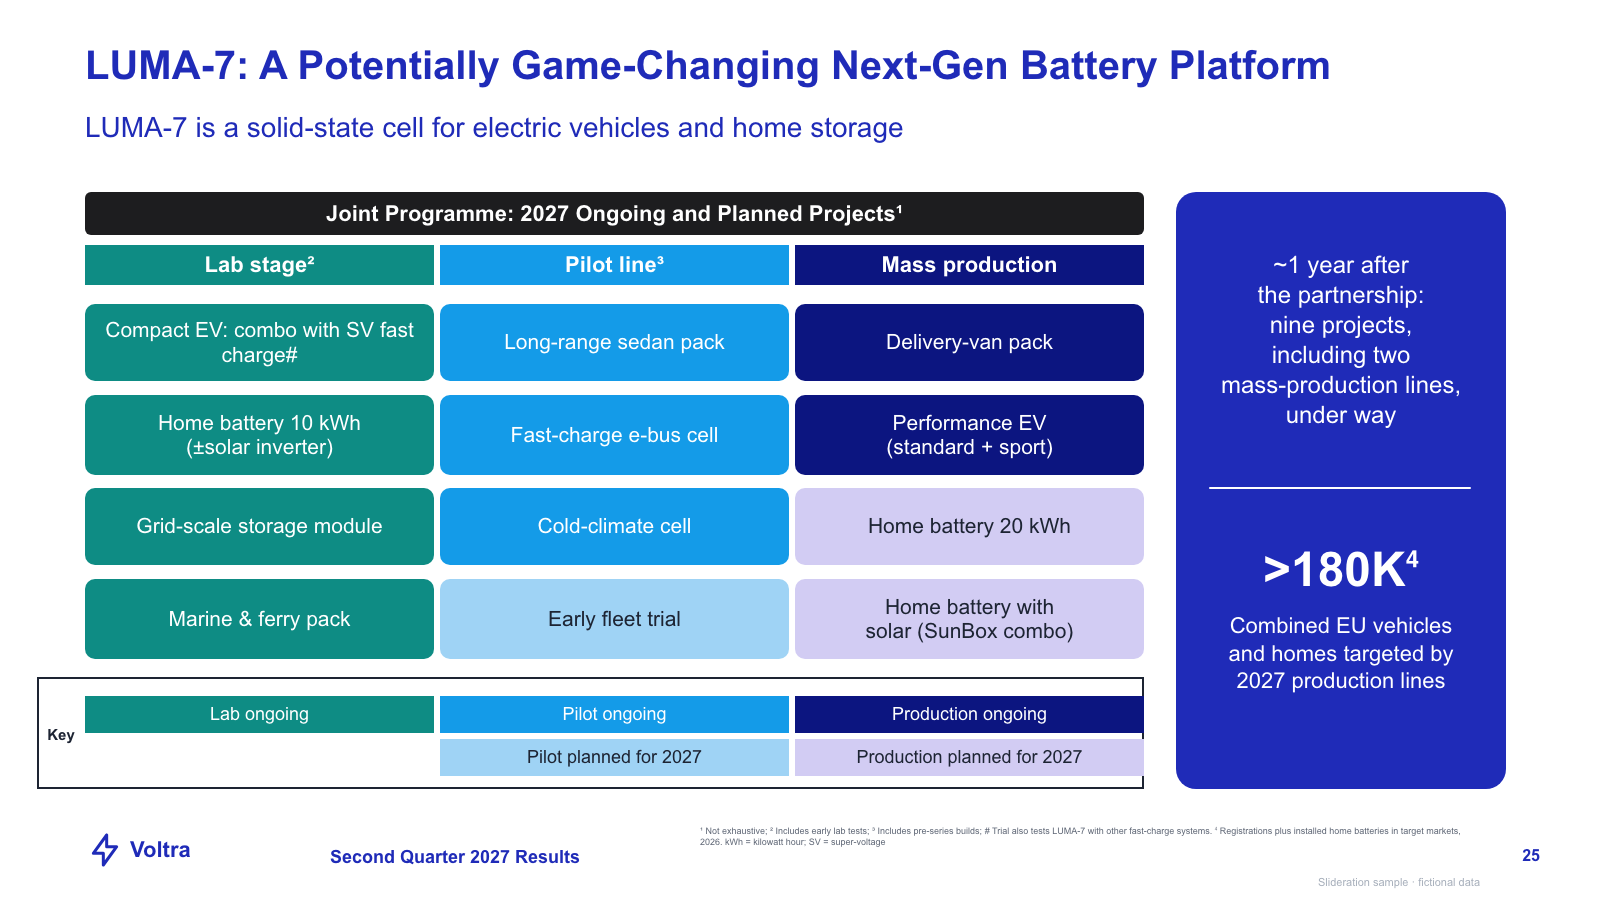
Programme matrix — dark title bar, three phase columns of coloured study cells, legend and stat panel

Programme matrix — dark title bar, three phase columns of coloured study cells, legend and stat panel

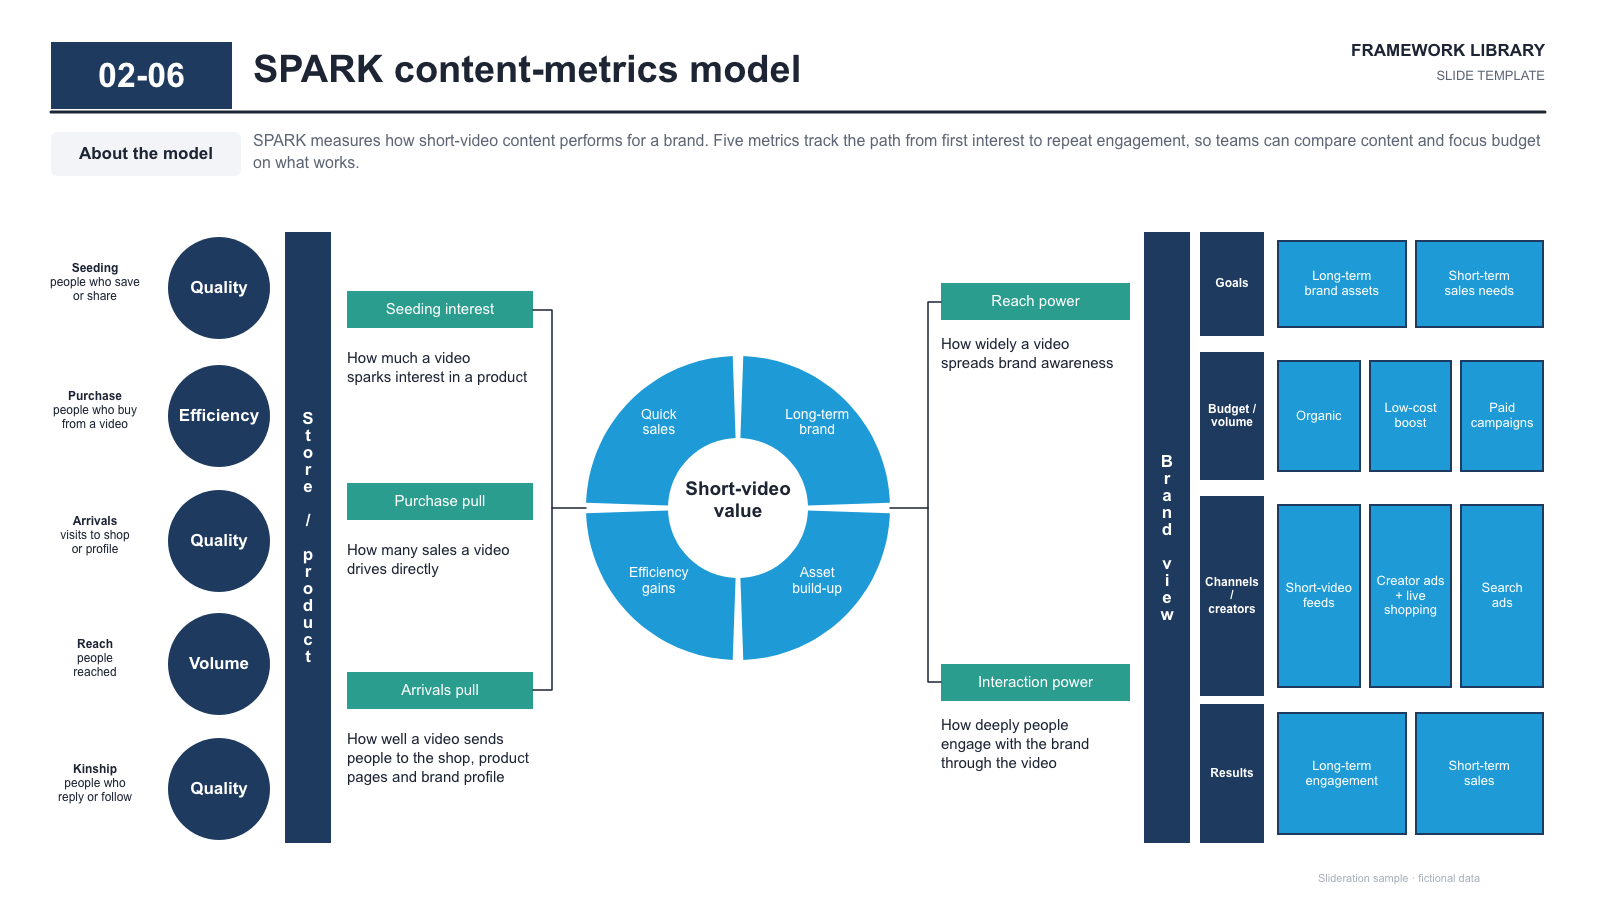
Metrics model — five labelled metric circles, side bars, bracketed notes around a split ring, stage grid

Metrics model — five labelled metric circles, side bars, bracketed notes around a split ring, stage grid

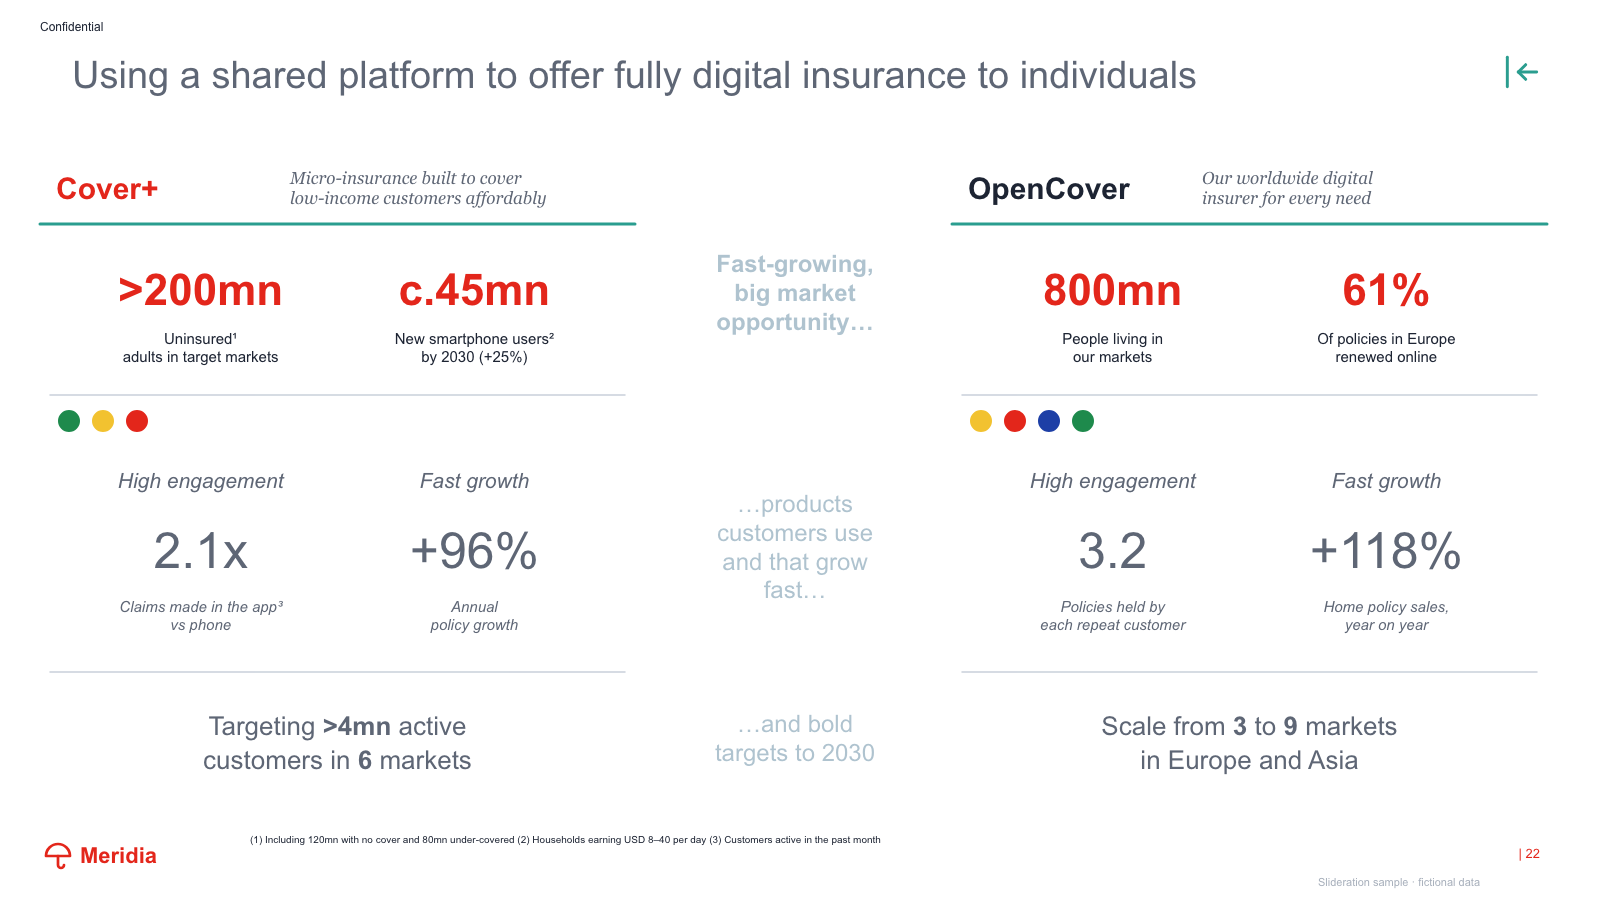
Two brand scorecards (headline stats, flags, engagement/growth stats, target) around a faded narrative column

Two brand scorecards (headline stats, flags, engagement/growth stats, target) around a faded narrative column

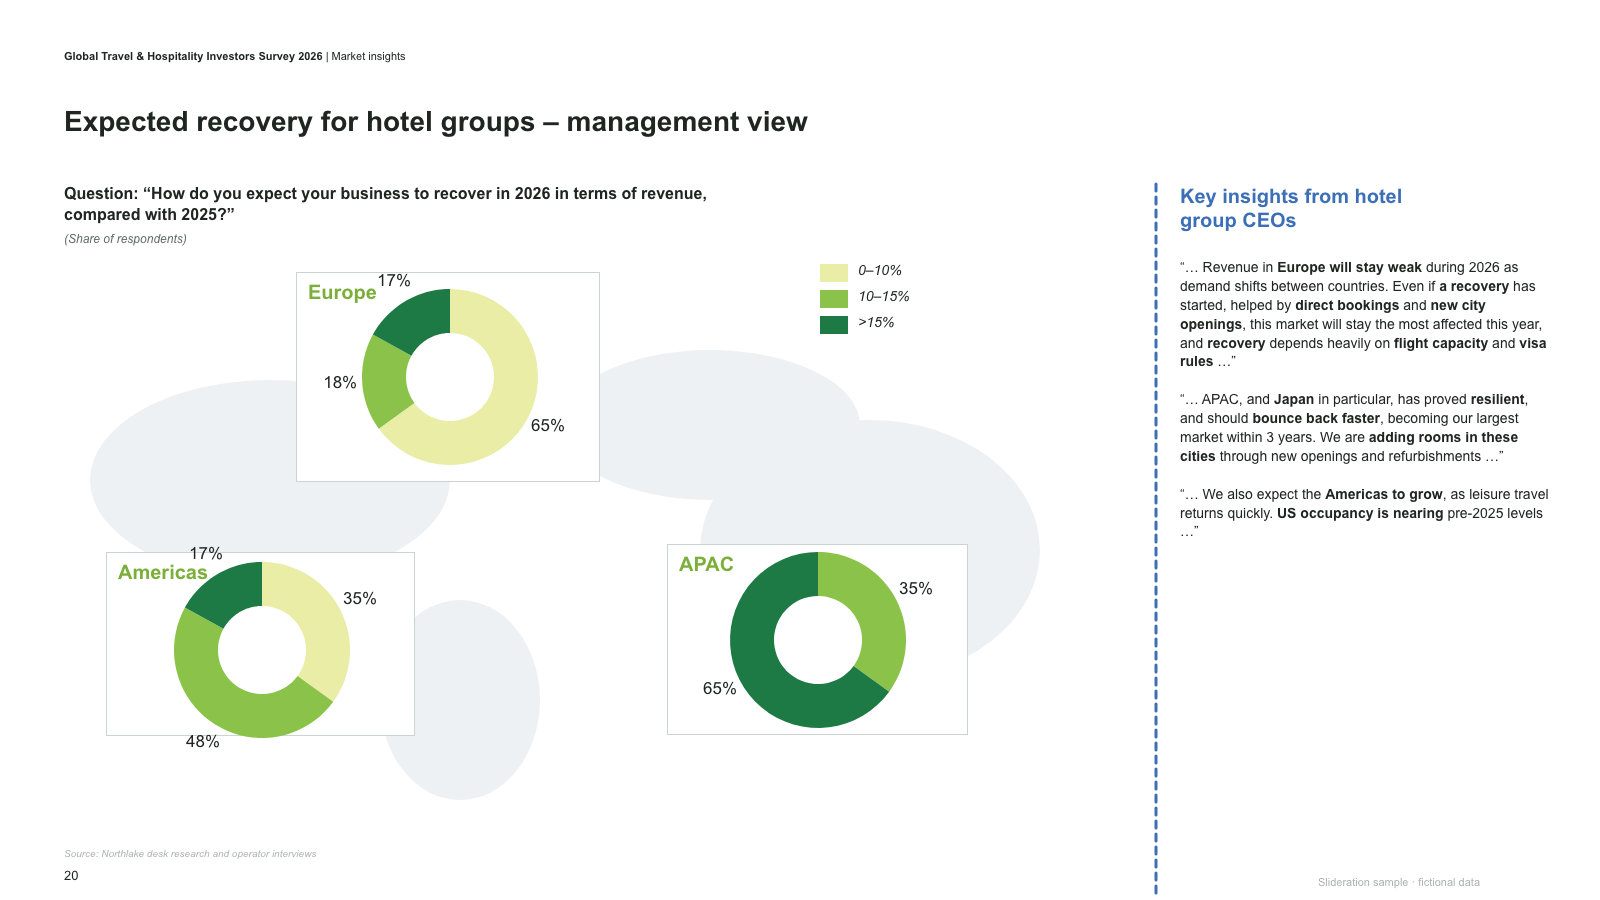
Map-style panel with three regional donut charts in boxes, legend and a quotes column

Map-style panel with three regional donut charts in boxes, legend and a quotes column

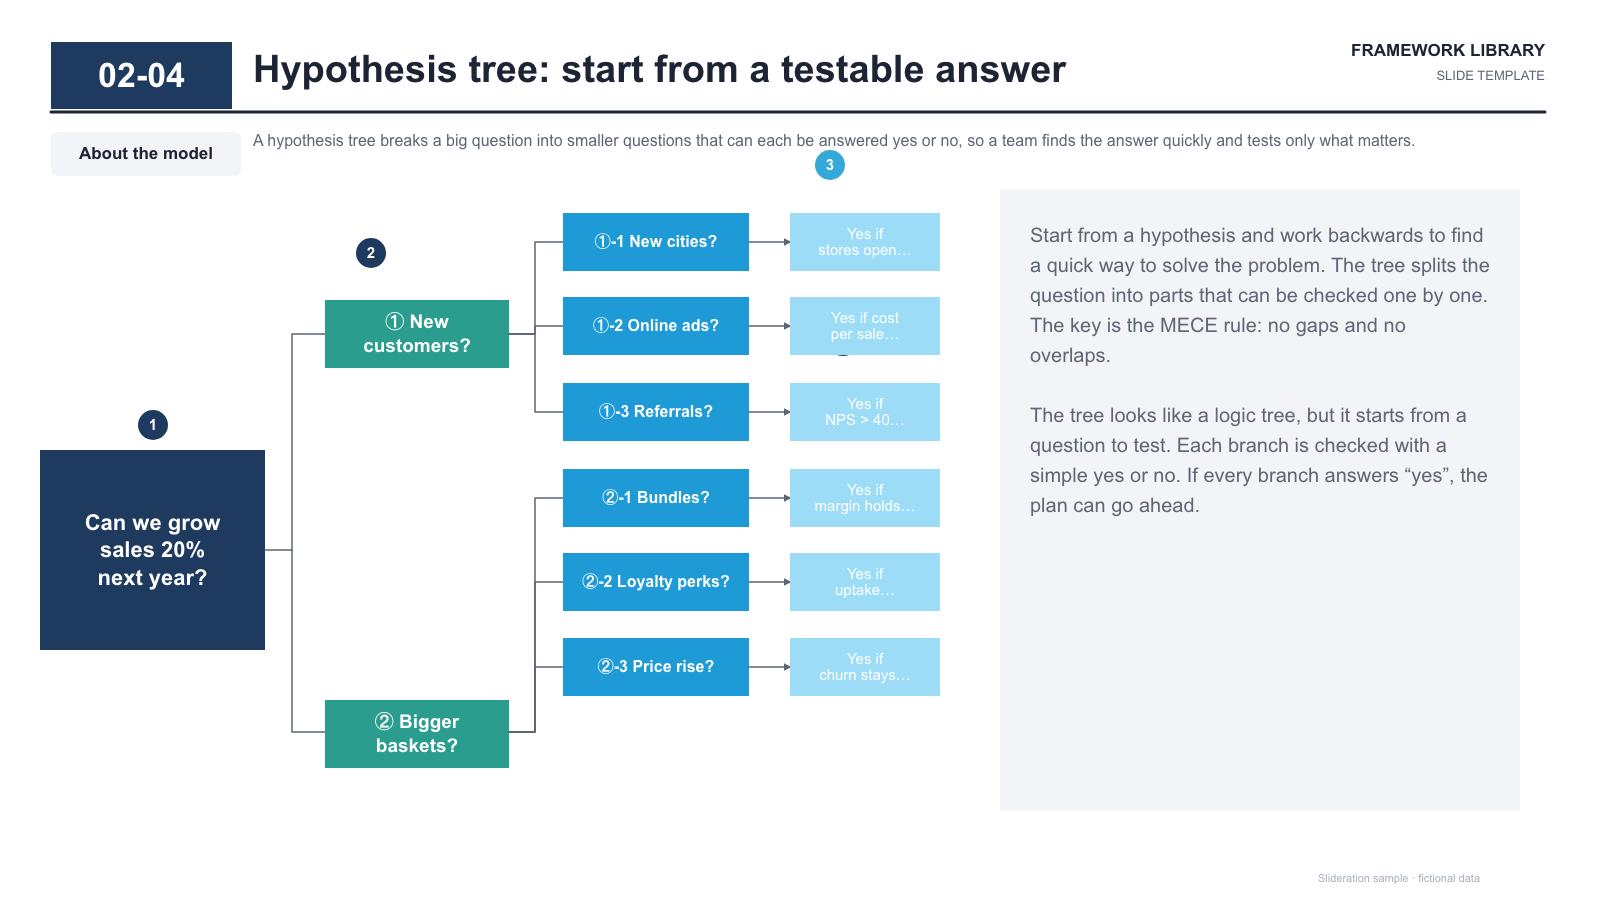
Hypothesis tree — root box, two branches, six sub-questions with arrowed check boxes and a notes panel

Hypothesis tree — root box, two branches, six sub-questions with arrowed check boxes and a notes panel

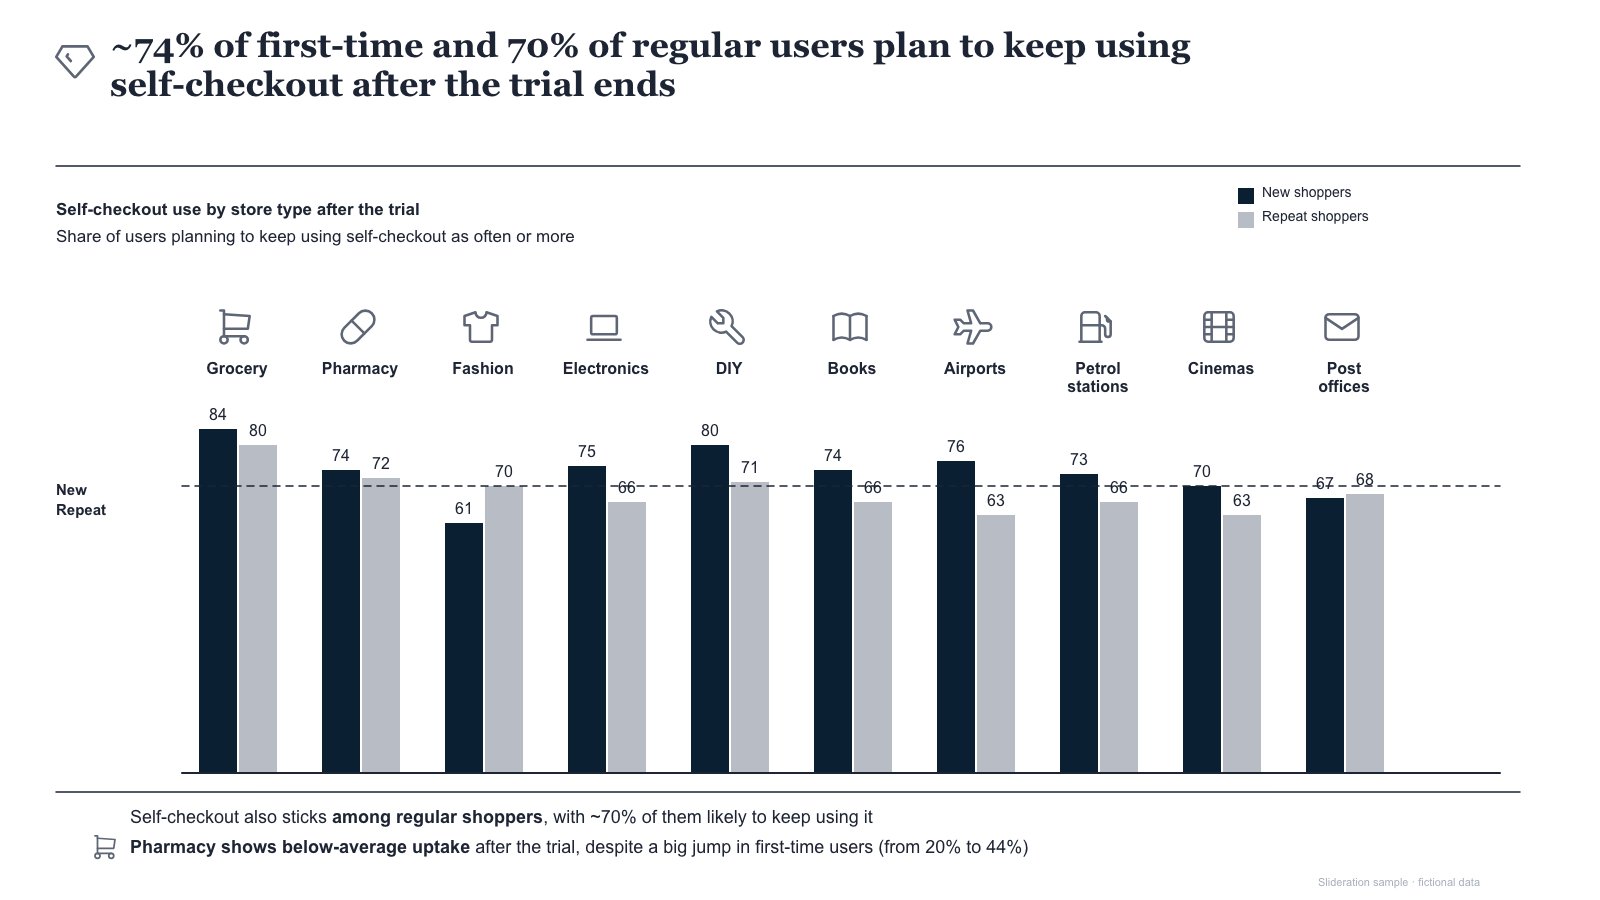
Grouped column pairs by sector with icons, value labels, dashed reference line and two icon takeaways

Grouped column pairs by sector with icons, value labels, dashed reference line and two icon takeaways

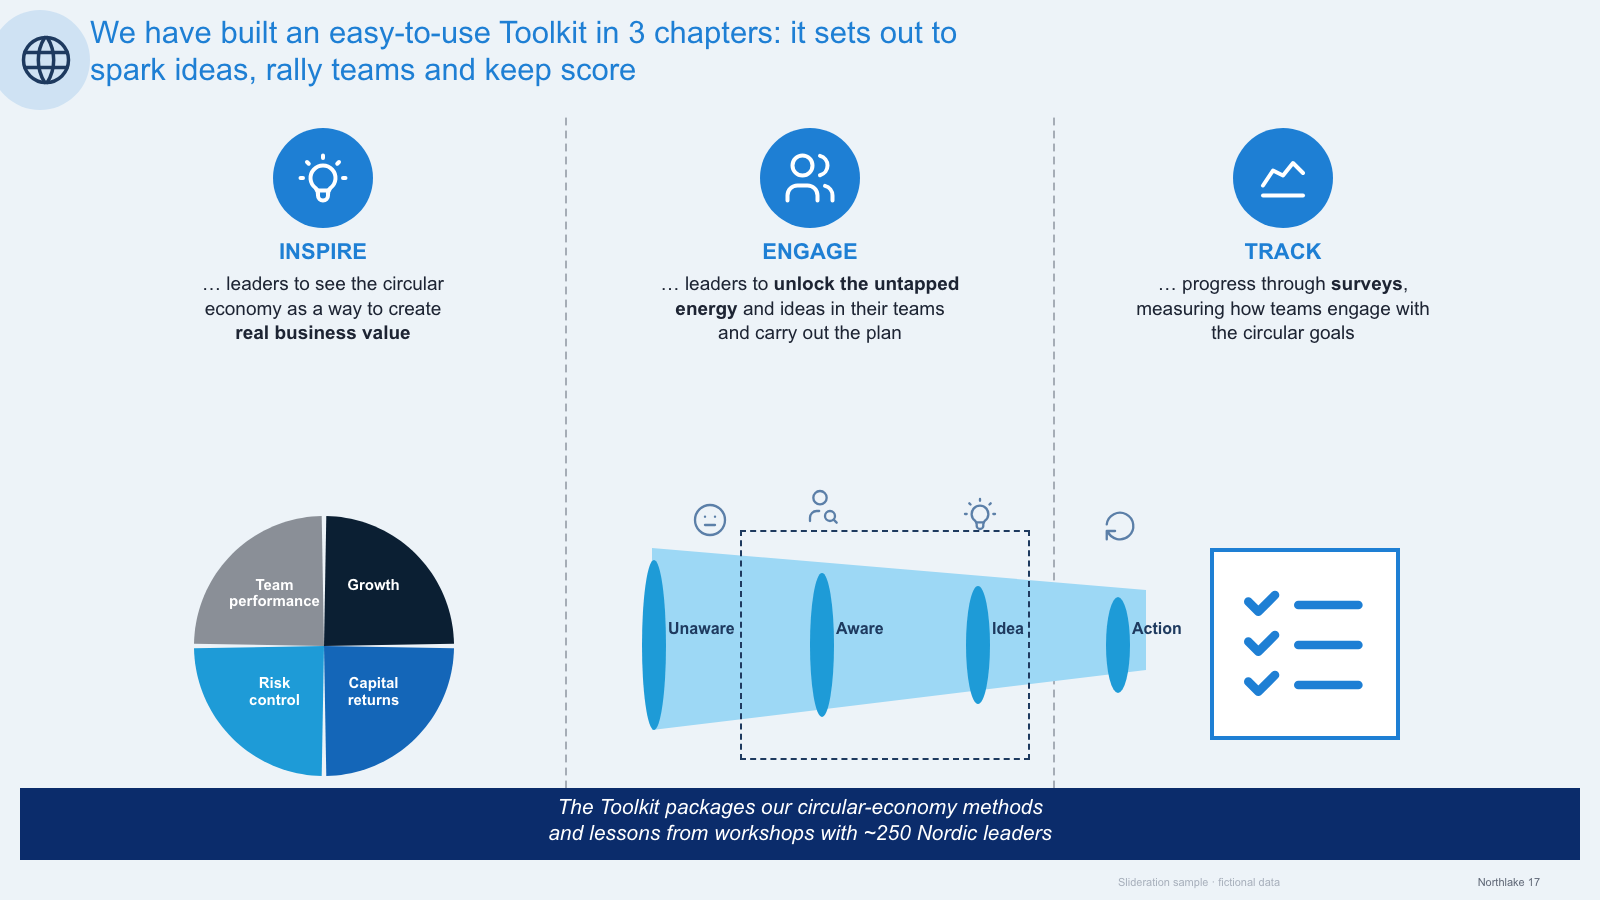
Three-part guide — icon badges with headings, pie quadrant, funnel of stages, checklist icon, closing band

Three-part guide — icon badges with headings, pie quadrant, funnel of stages, checklist icon, closing band

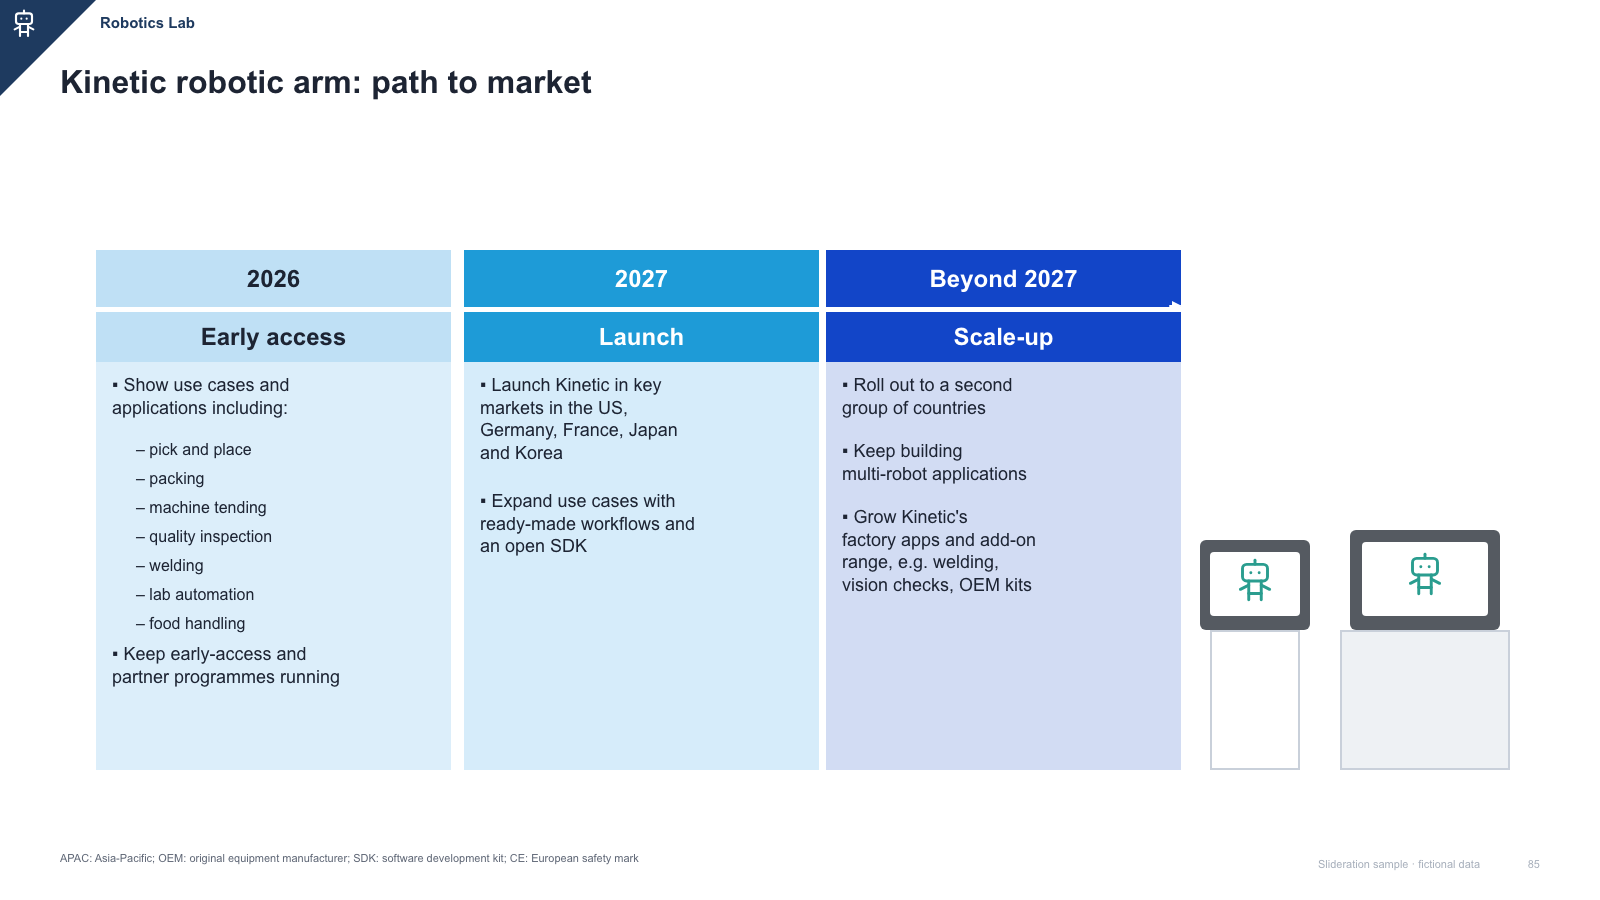
Three-phase roadmap table with year headers, phase labels, bullet columns and device icons

Three-phase roadmap table with year headers, phase labels, bullet columns and device icons

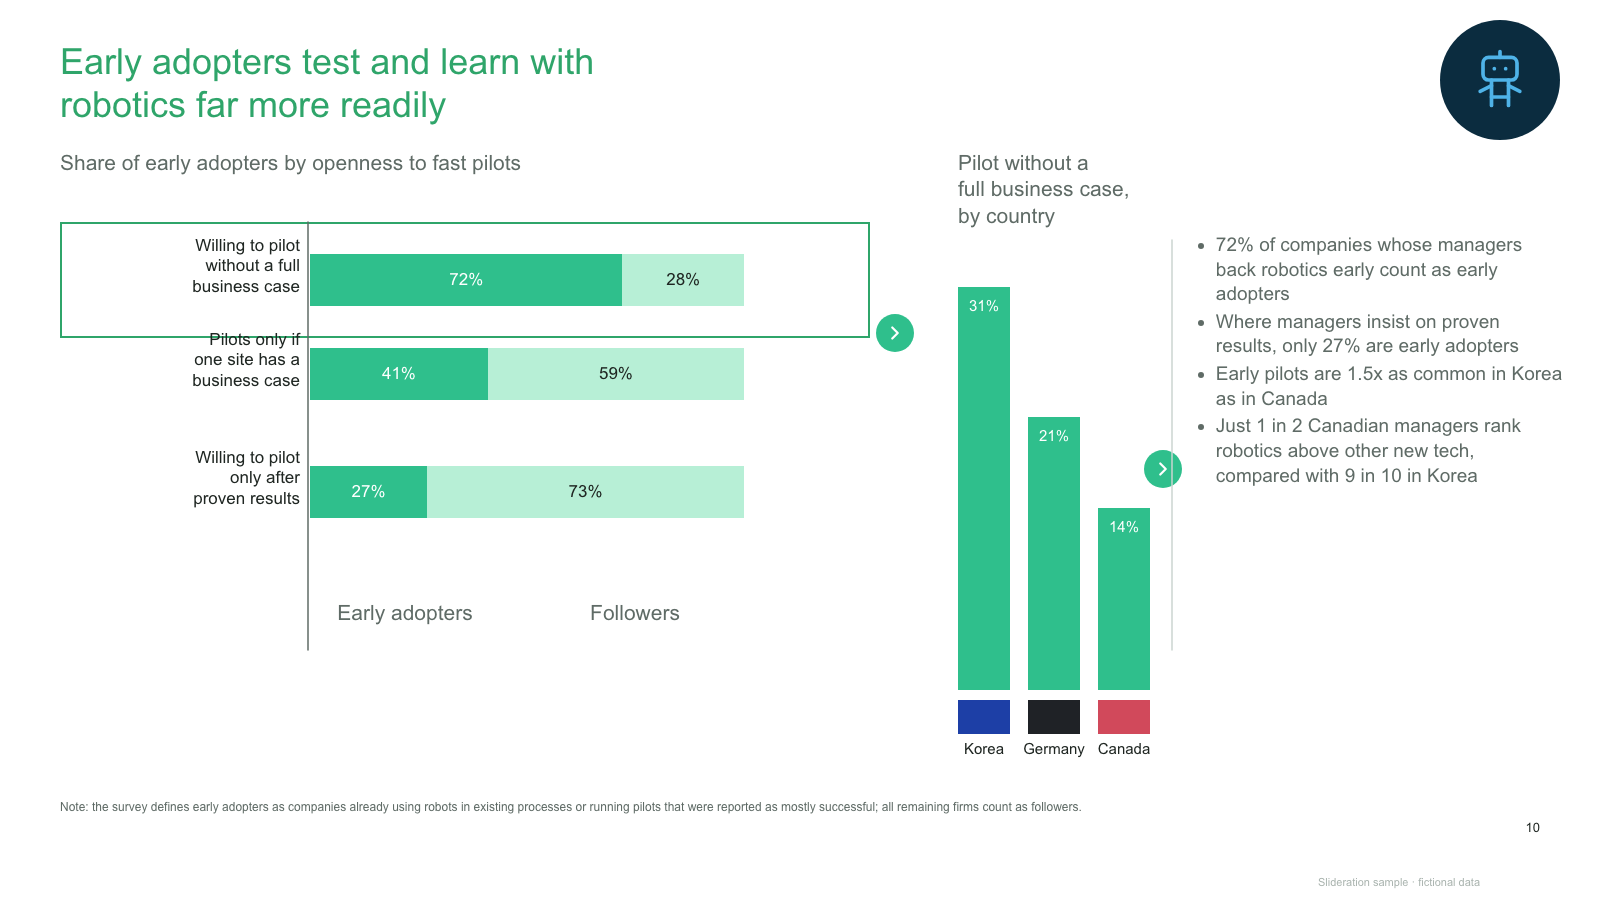
Highlighted 100% bar comparison of three groups with arrows to a country column chart and bullet takeaways

Highlighted 100% bar comparison of three groups with arrows to a country column chart and bullet takeaways

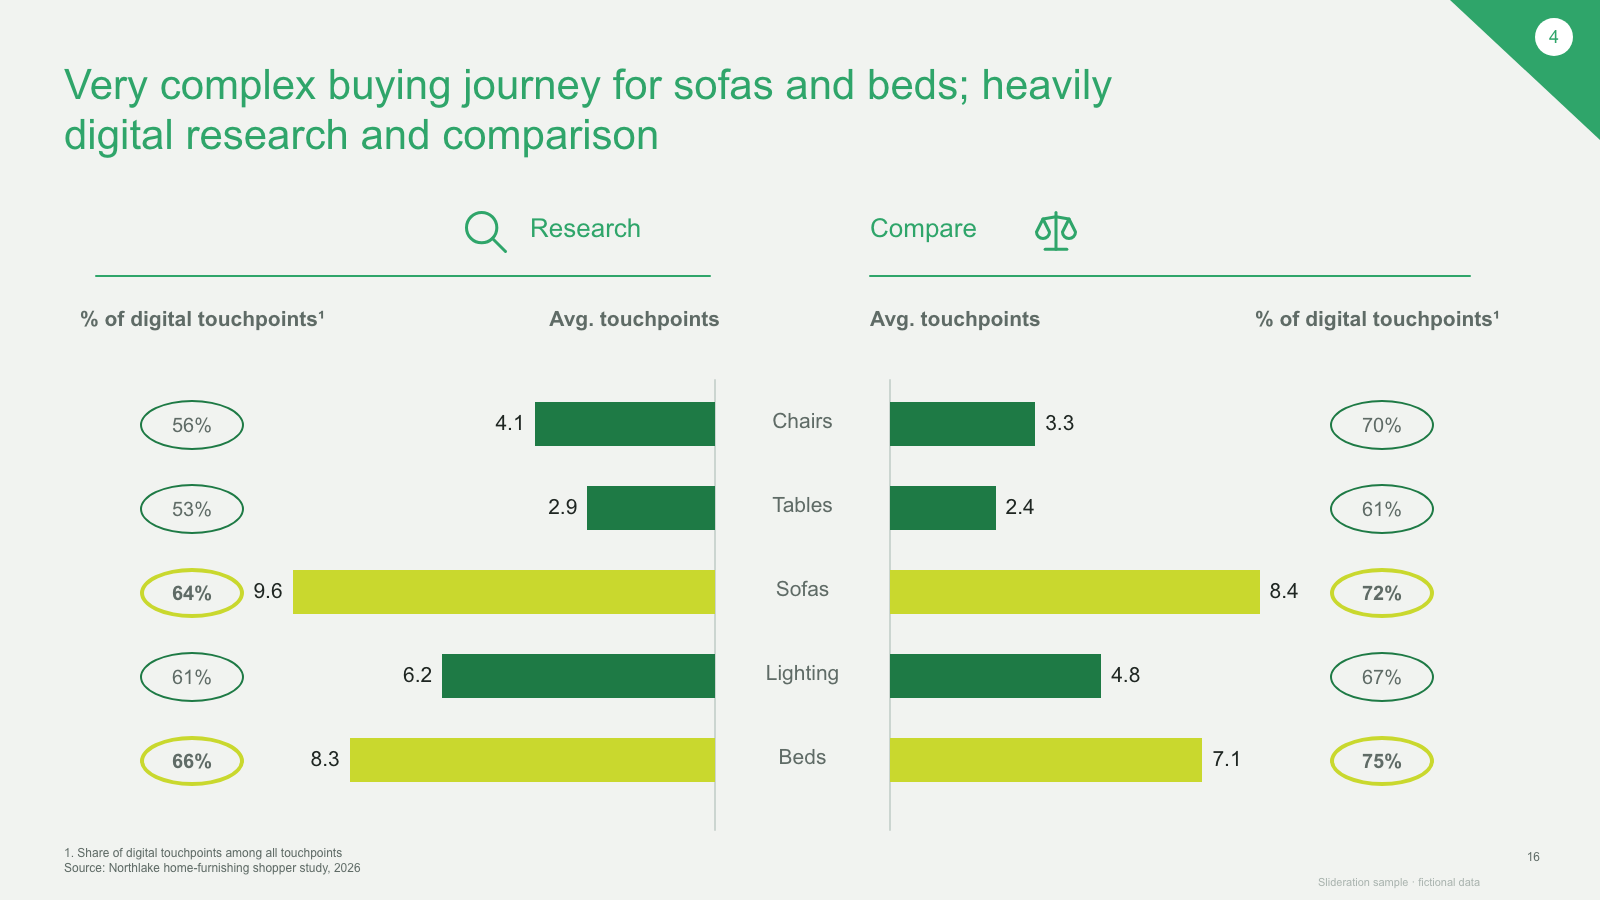
Butterfly bar chart — two stages with circled percentages on outer edges and shared category labels

Butterfly bar chart — two stages with circled percentages on outer edges and shared category labels

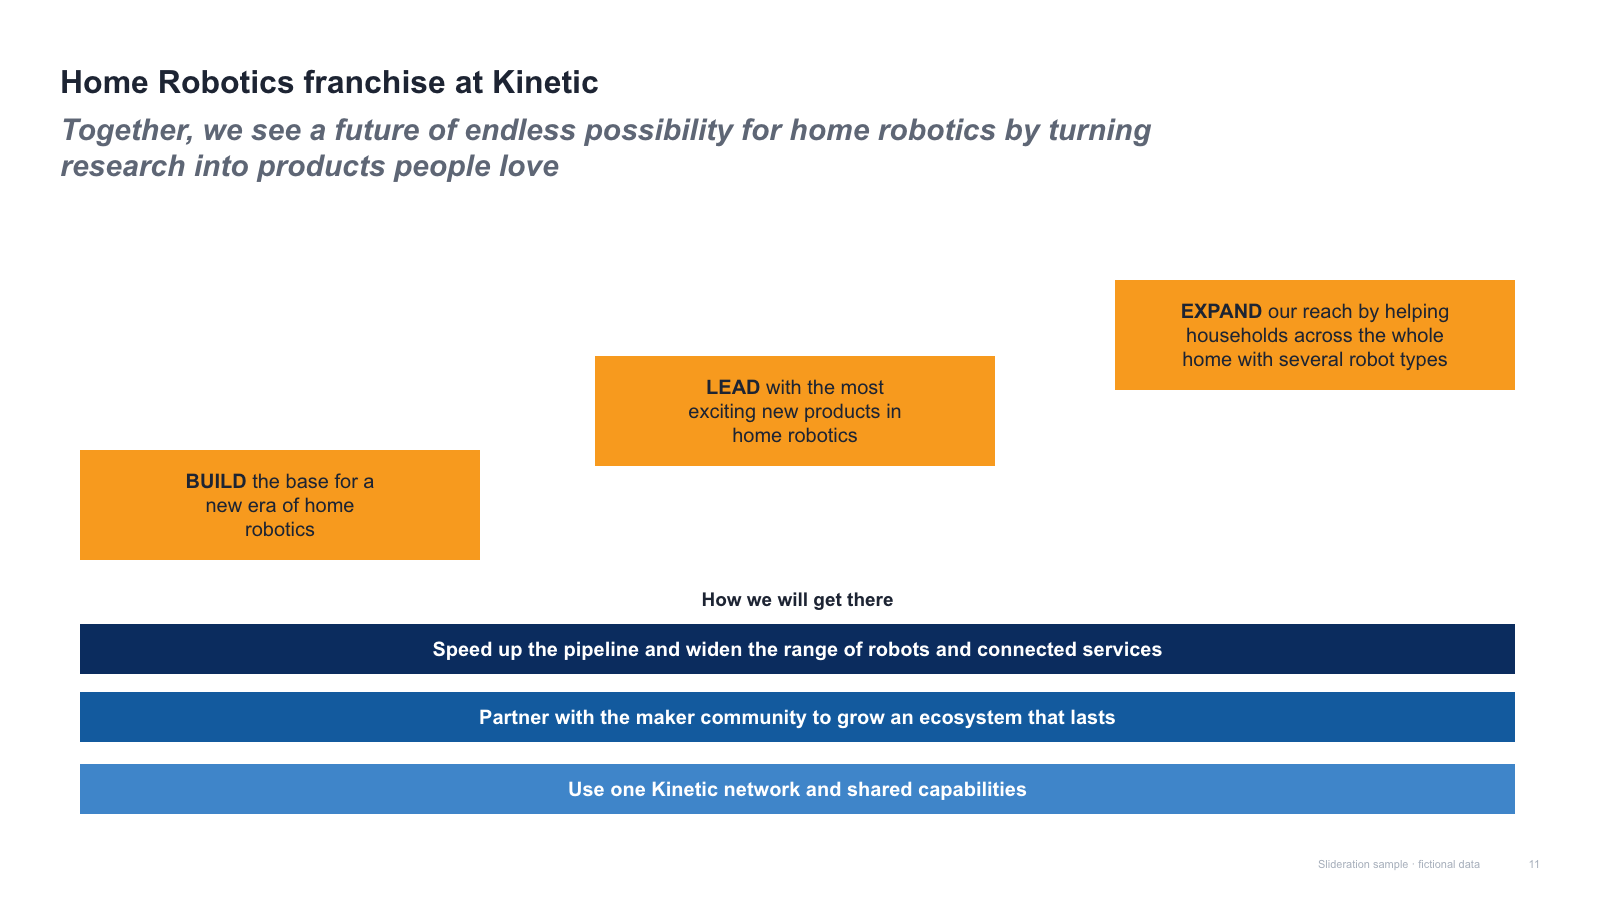
Staggered ambition boxes (build / lead / expand) above three stacked building-block bars

Staggered ambition boxes (build / lead / expand) above three stacked building-block bars

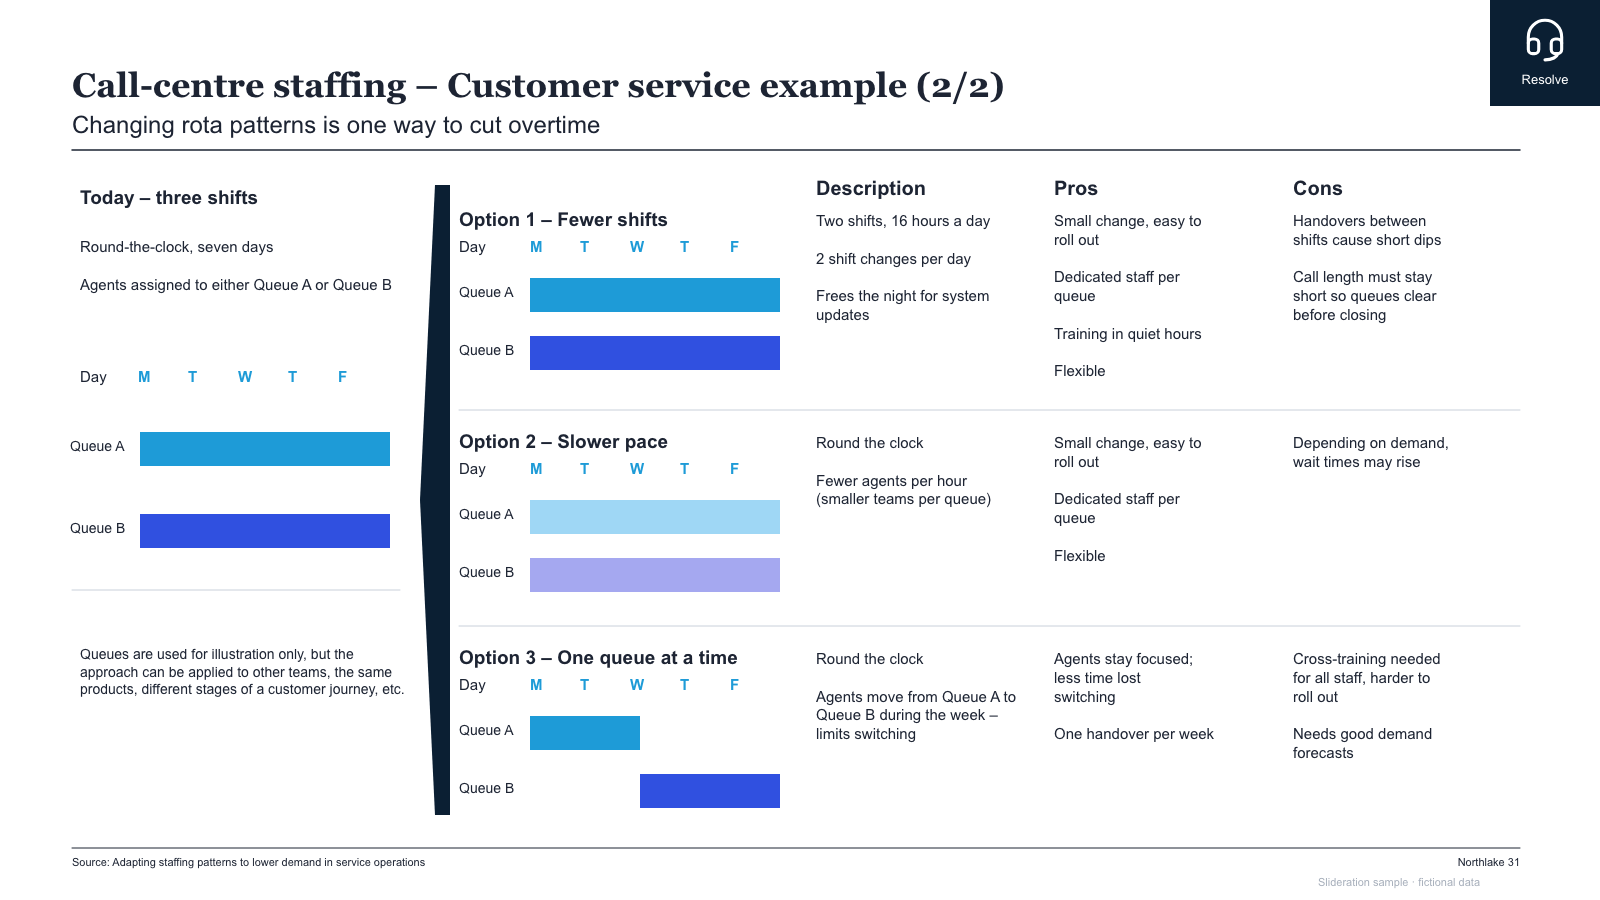
Option comparison — baseline schedule, three option rows each with a mini weekday grid and description/pros/cons columns

Option comparison — baseline schedule, three option rows each with a mini weekday grid and description/pros/cons columns

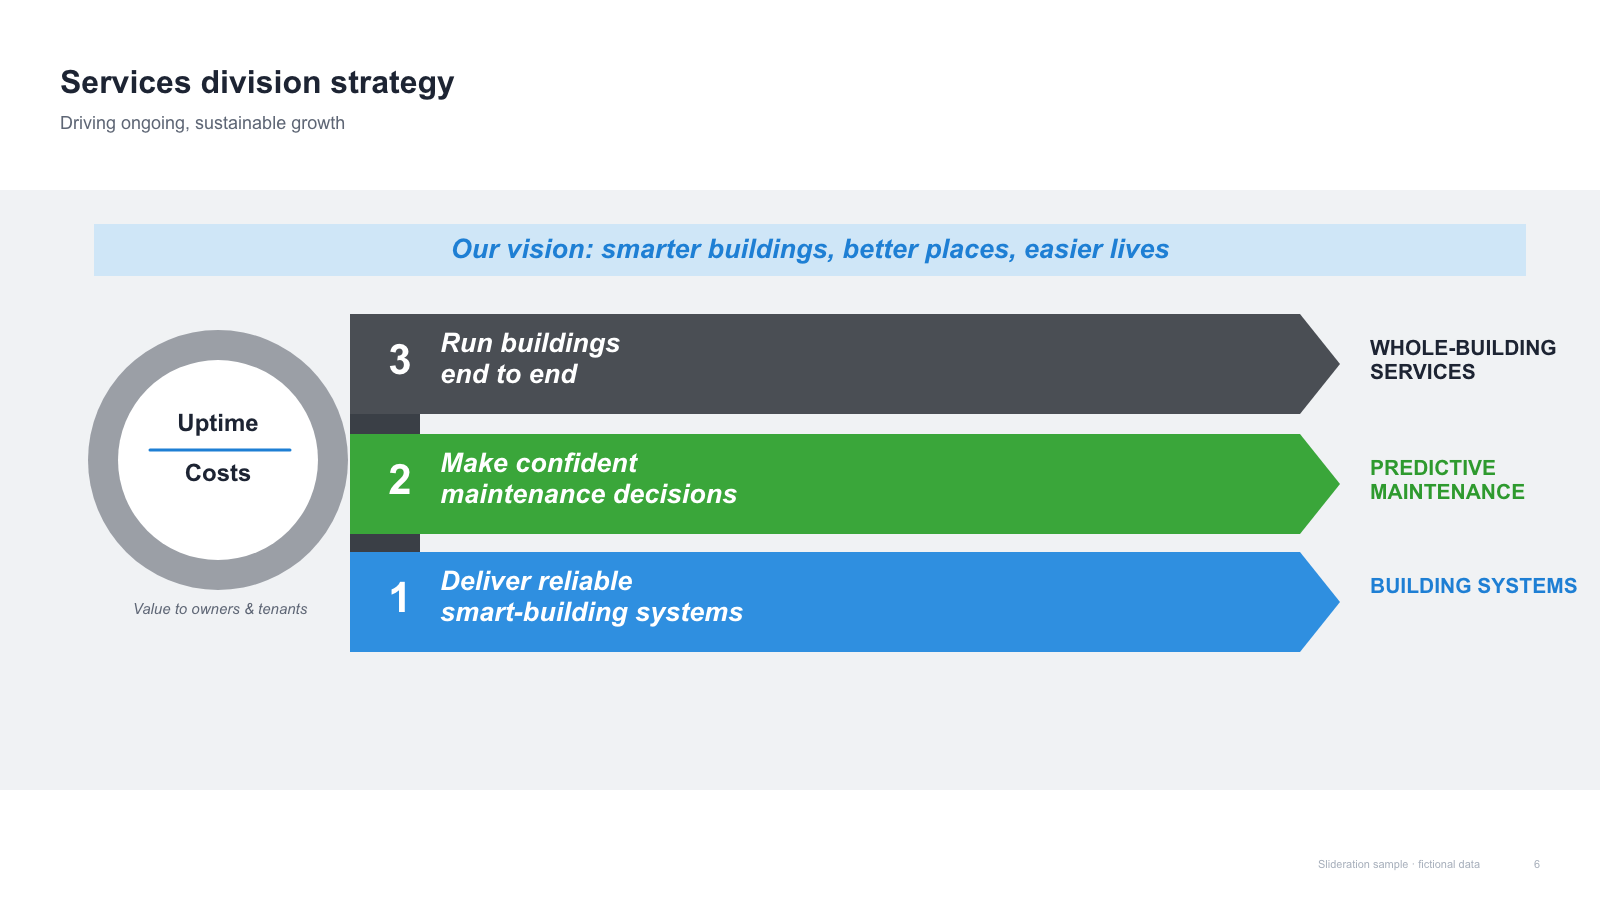
Vision banner over a ringed badge with three stacked numbered ribbons pointing to right-hand labels

Vision banner over a ringed badge with three stacked numbered ribbons pointing to right-hand labels

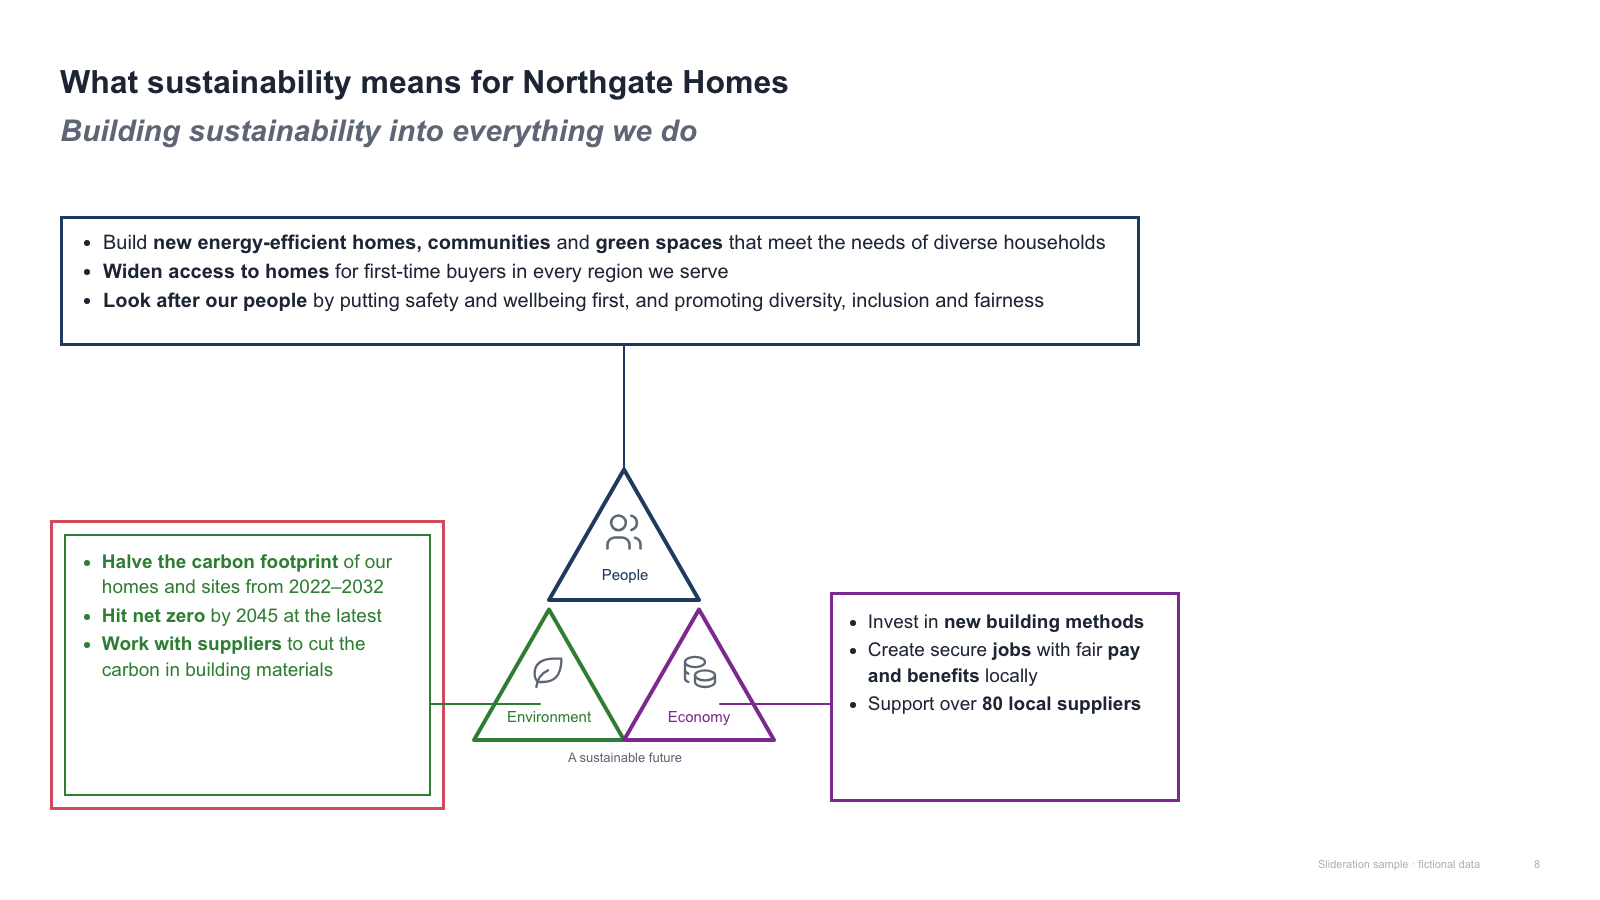
Three-point commitment box feeding a triad of triangles, flanked by two outlined bullet boxes

Three-point commitment box feeding a triad of triangles, flanked by two outlined bullet boxes

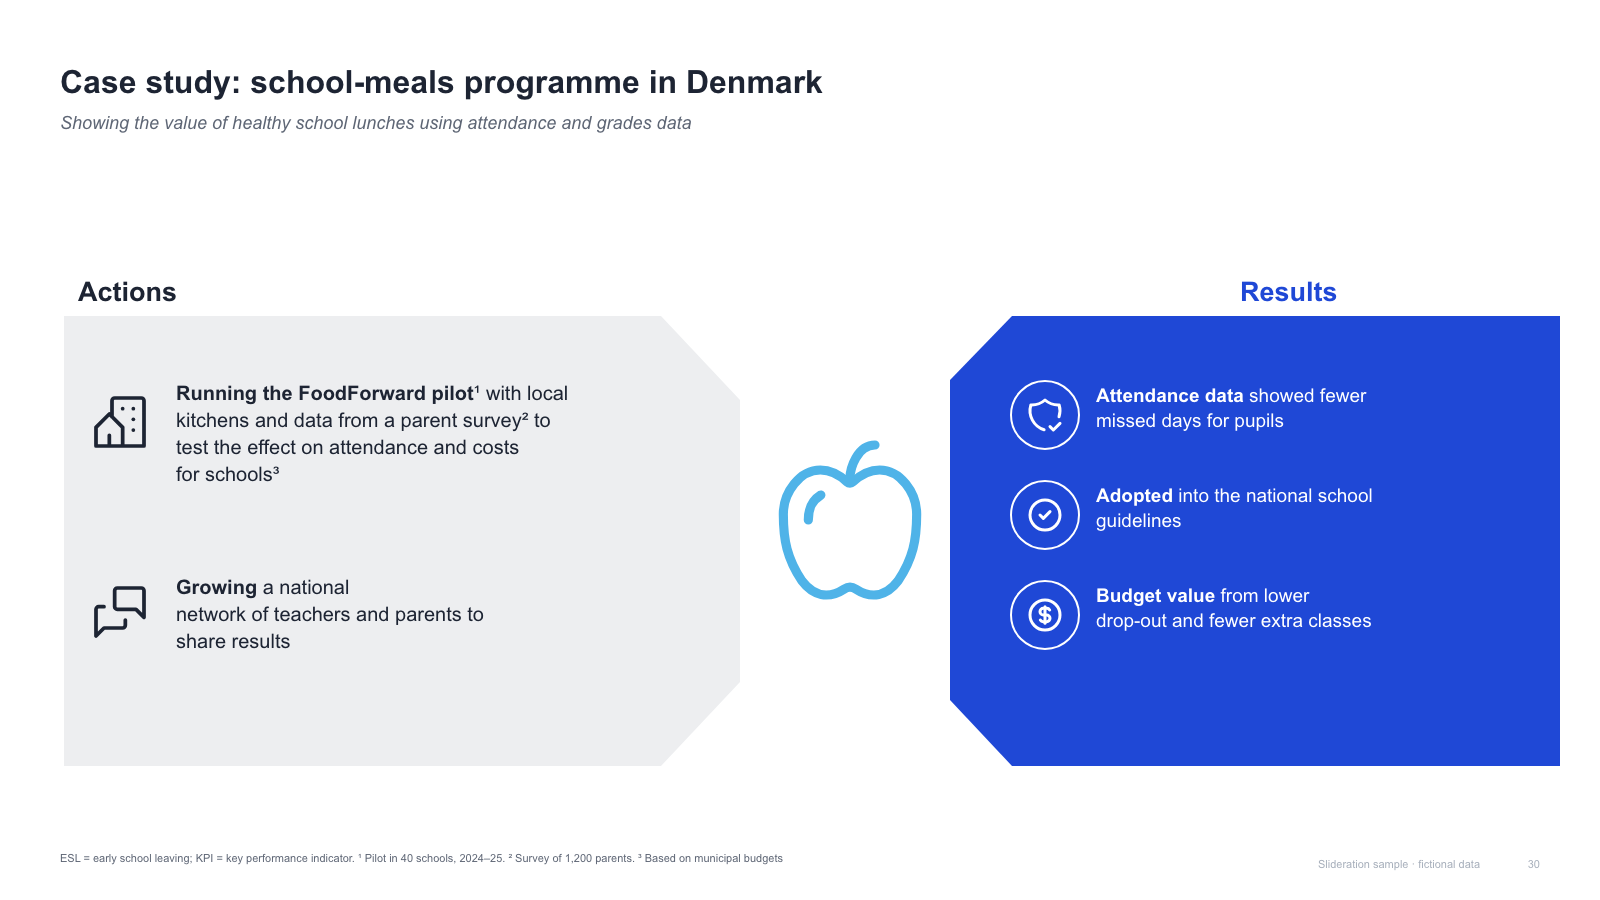
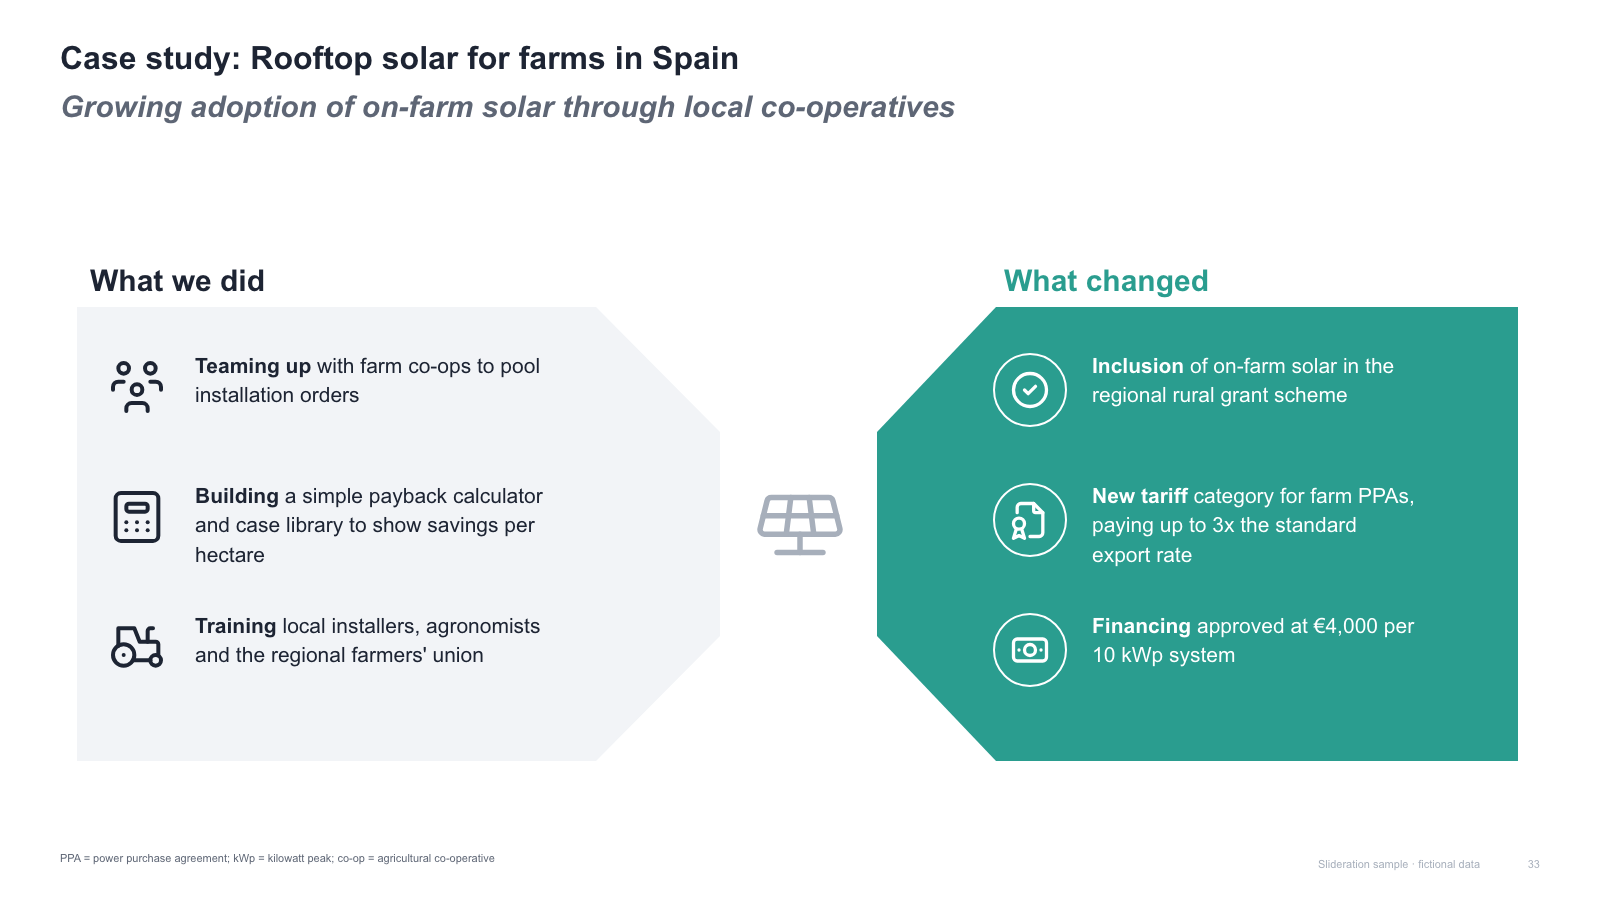
Case study — shaded actions panel with icons, central emblem, and a blue results panel with icon bullets

Case study — shaded actions panel with icons, central emblem, and a blue results panel with icon bullets

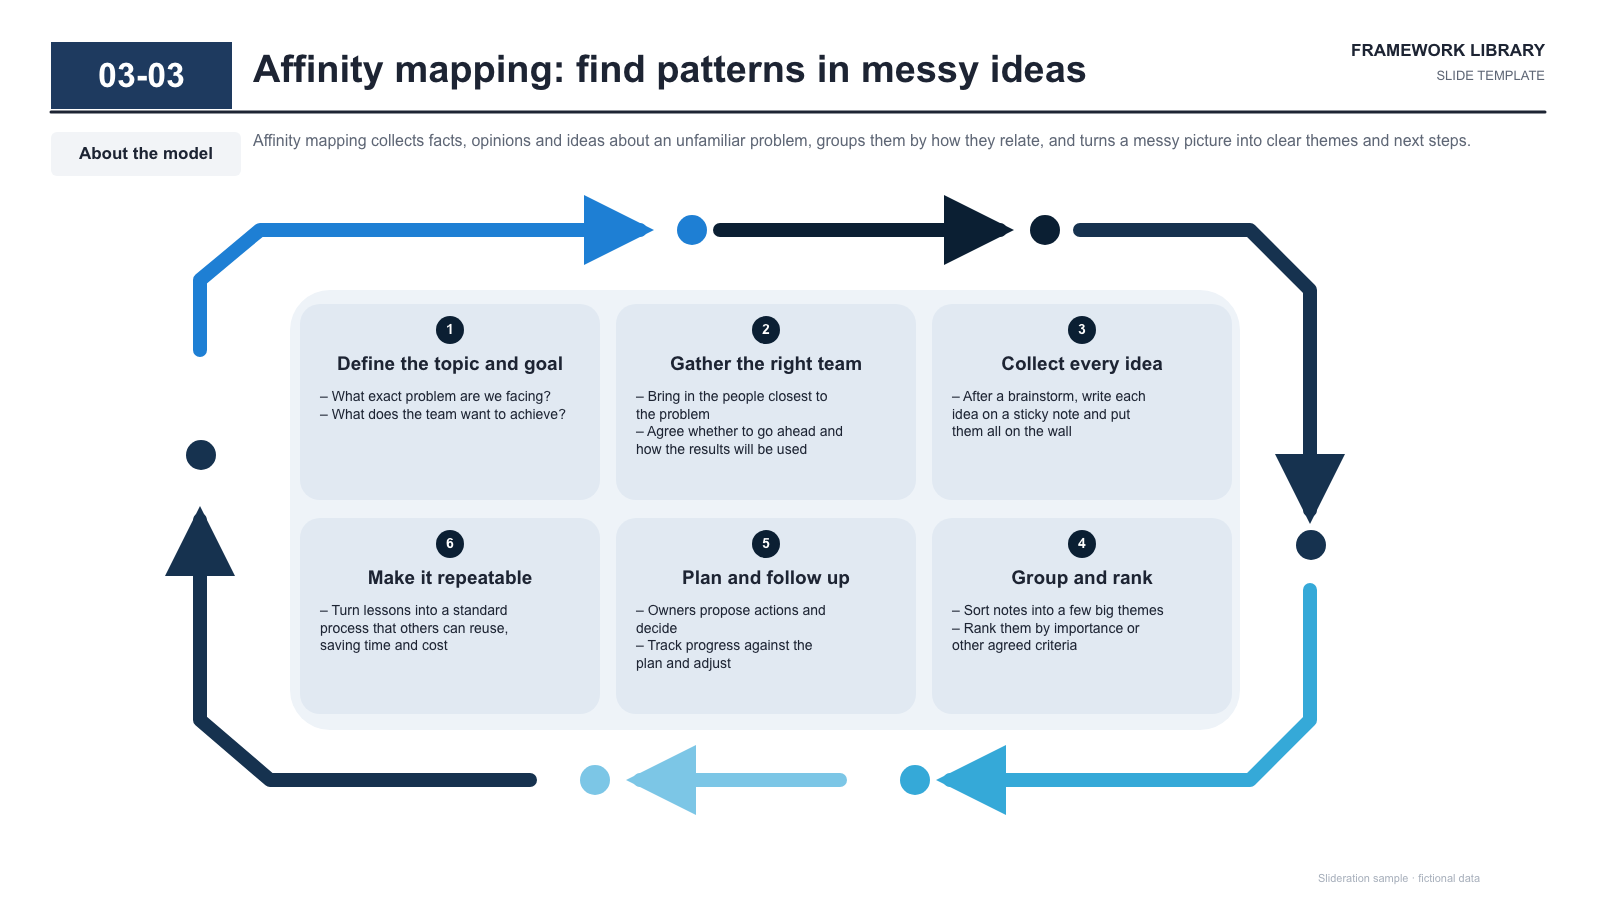
Six-step cycle — rounded loop of arrows framing a 3x2 grid of numbered step cards

Six-step cycle — rounded loop of arrows framing a 3x2 grid of numbered step cards

Aspiration statement with two icon-led goals and a large illustrative image on the right

Aspiration statement with two icon-led goals and a large illustrative image on the right

Segmented ring around a core circle beside a numbered list of characteristics with arrow-linked evidence bars

Segmented ring around a core circle beside a numbered list of characteristics with arrow-linked evidence bars

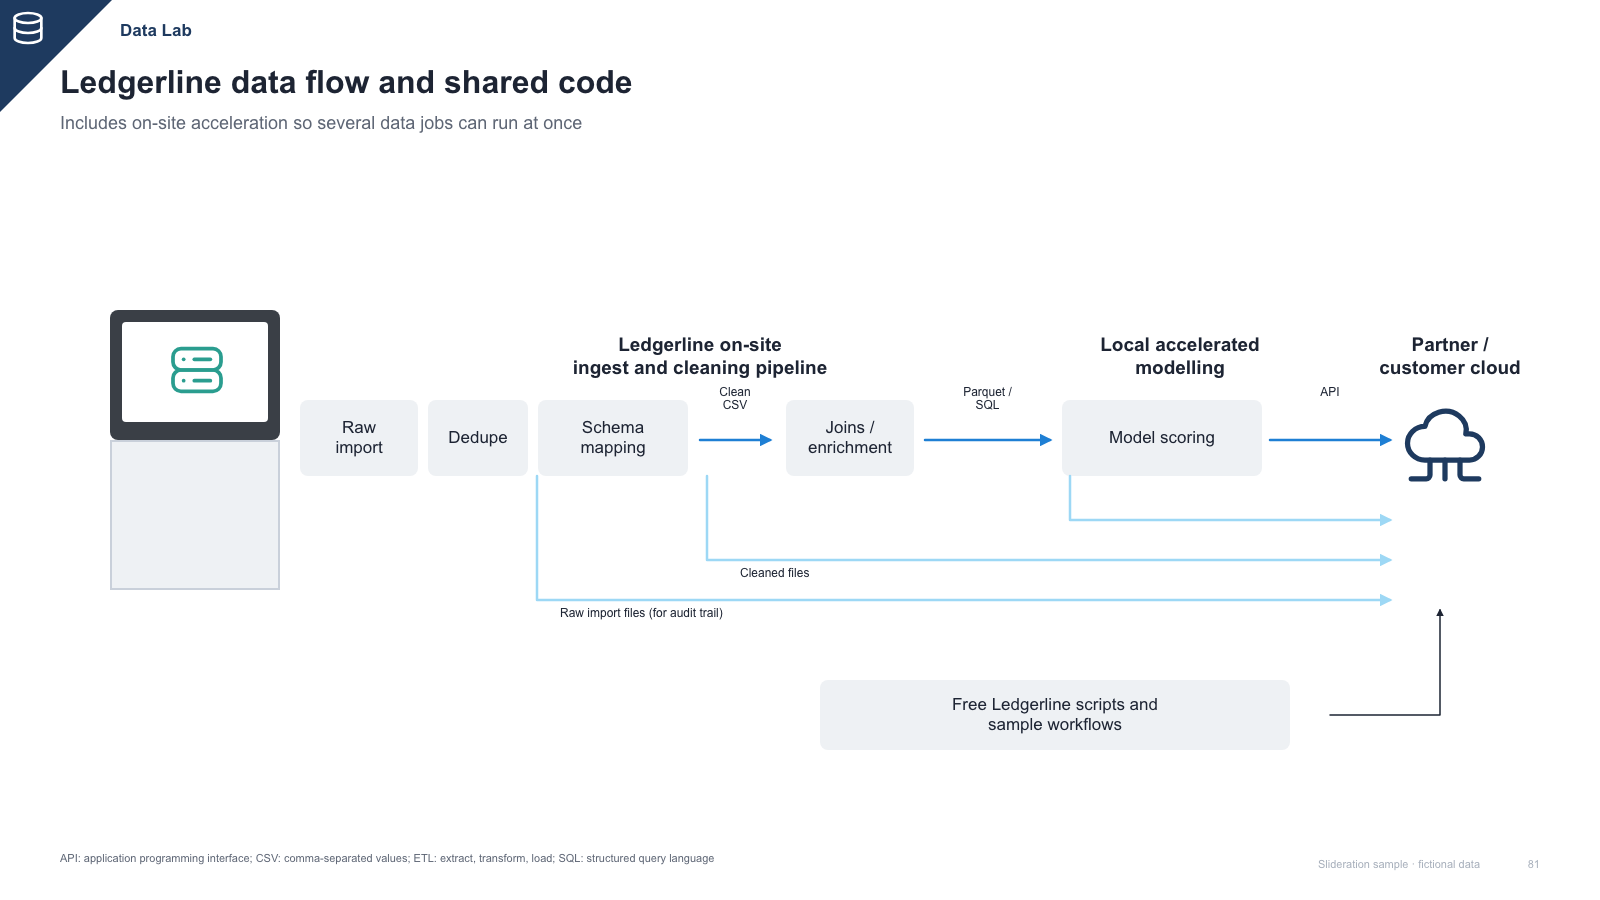
Device image feeding a horizontal pipeline of step boxes with small arrow labels, branch lines and a cloud target

Device image feeding a horizontal pipeline of step boxes with small arrow labels, branch lines and a cloud target

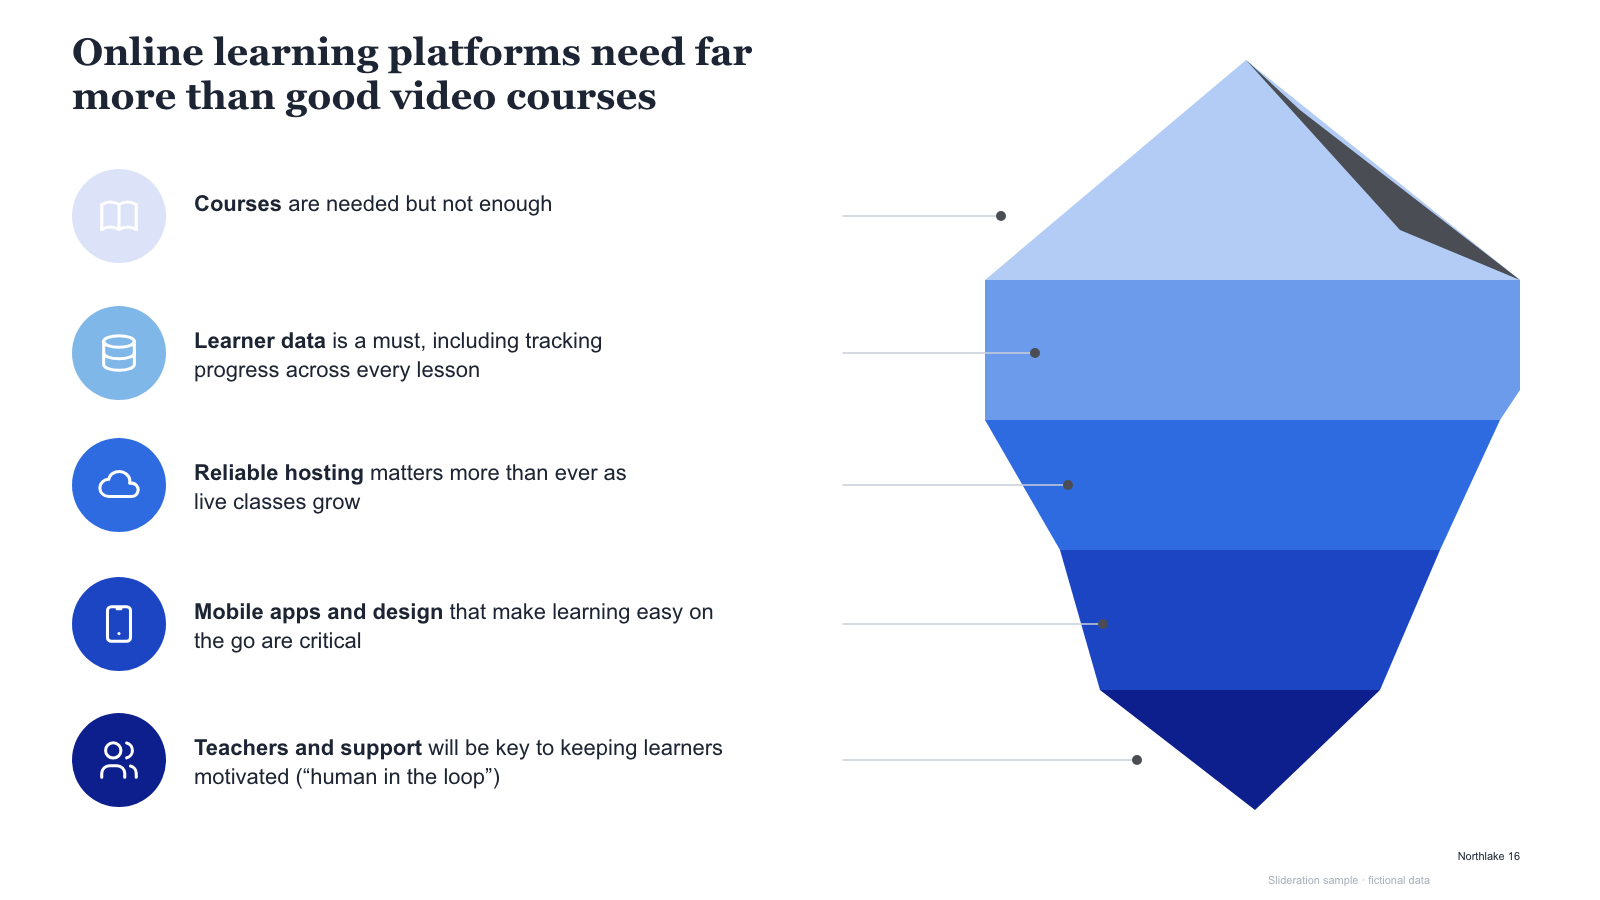
Iceberg of stacked layers with leader lines to five icon-led statements

Iceberg of stacked layers with leader lines to five icon-led statements

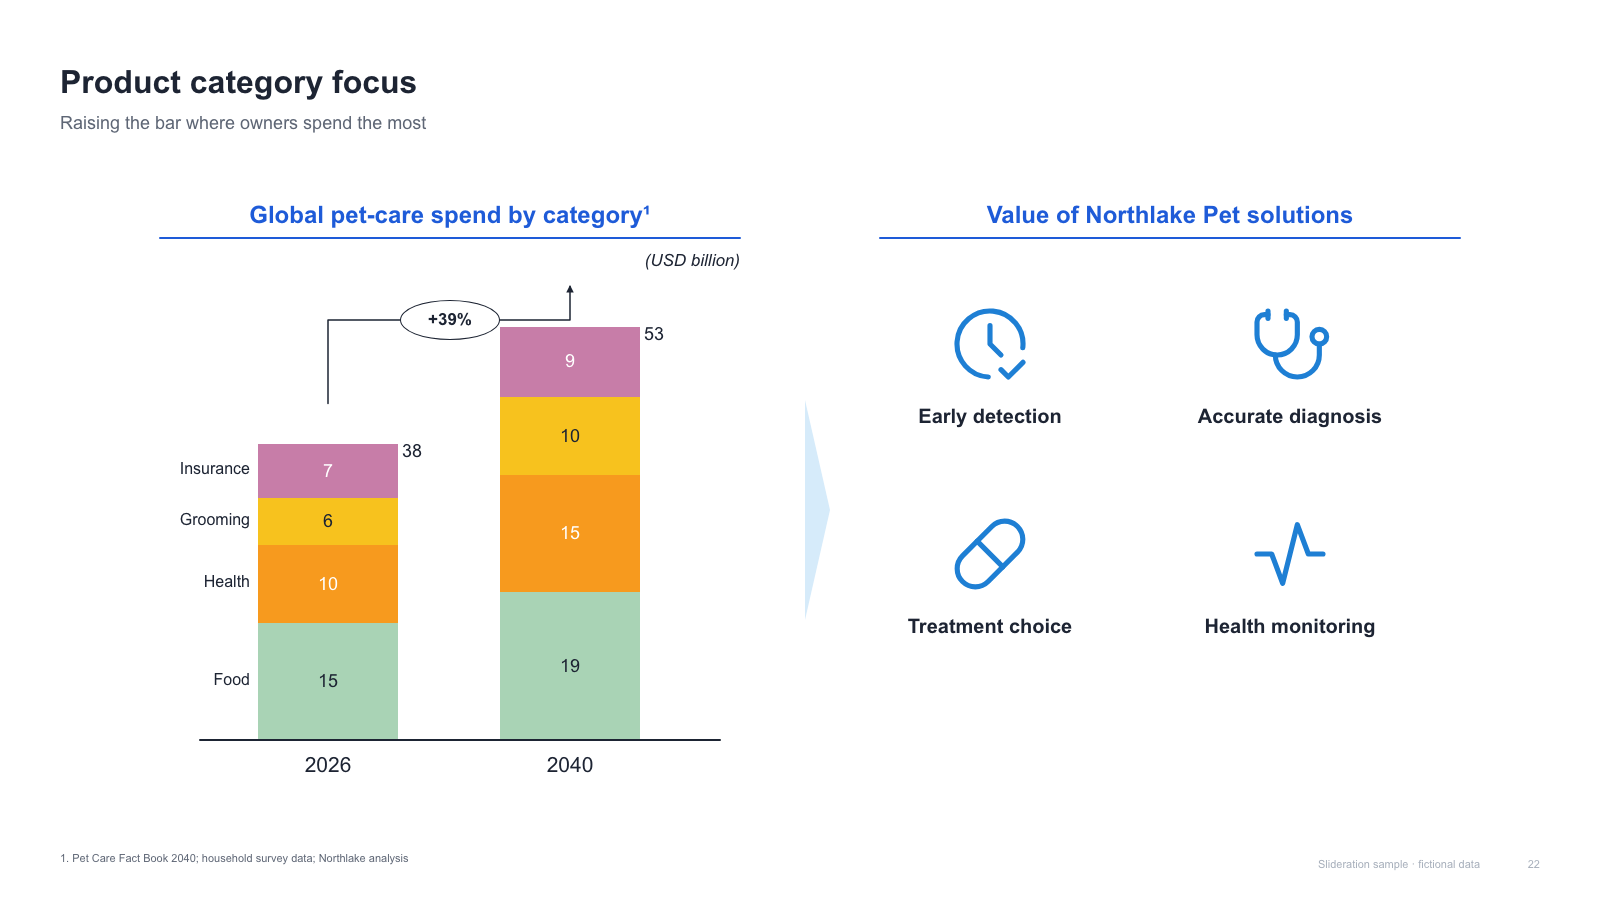
Two stacked columns with a growth bracket, a chevron divider and a 2x2 icon grid of solution values

Two stacked columns with a growth bracket, a chevron divider and a 2x2 icon grid of solution values

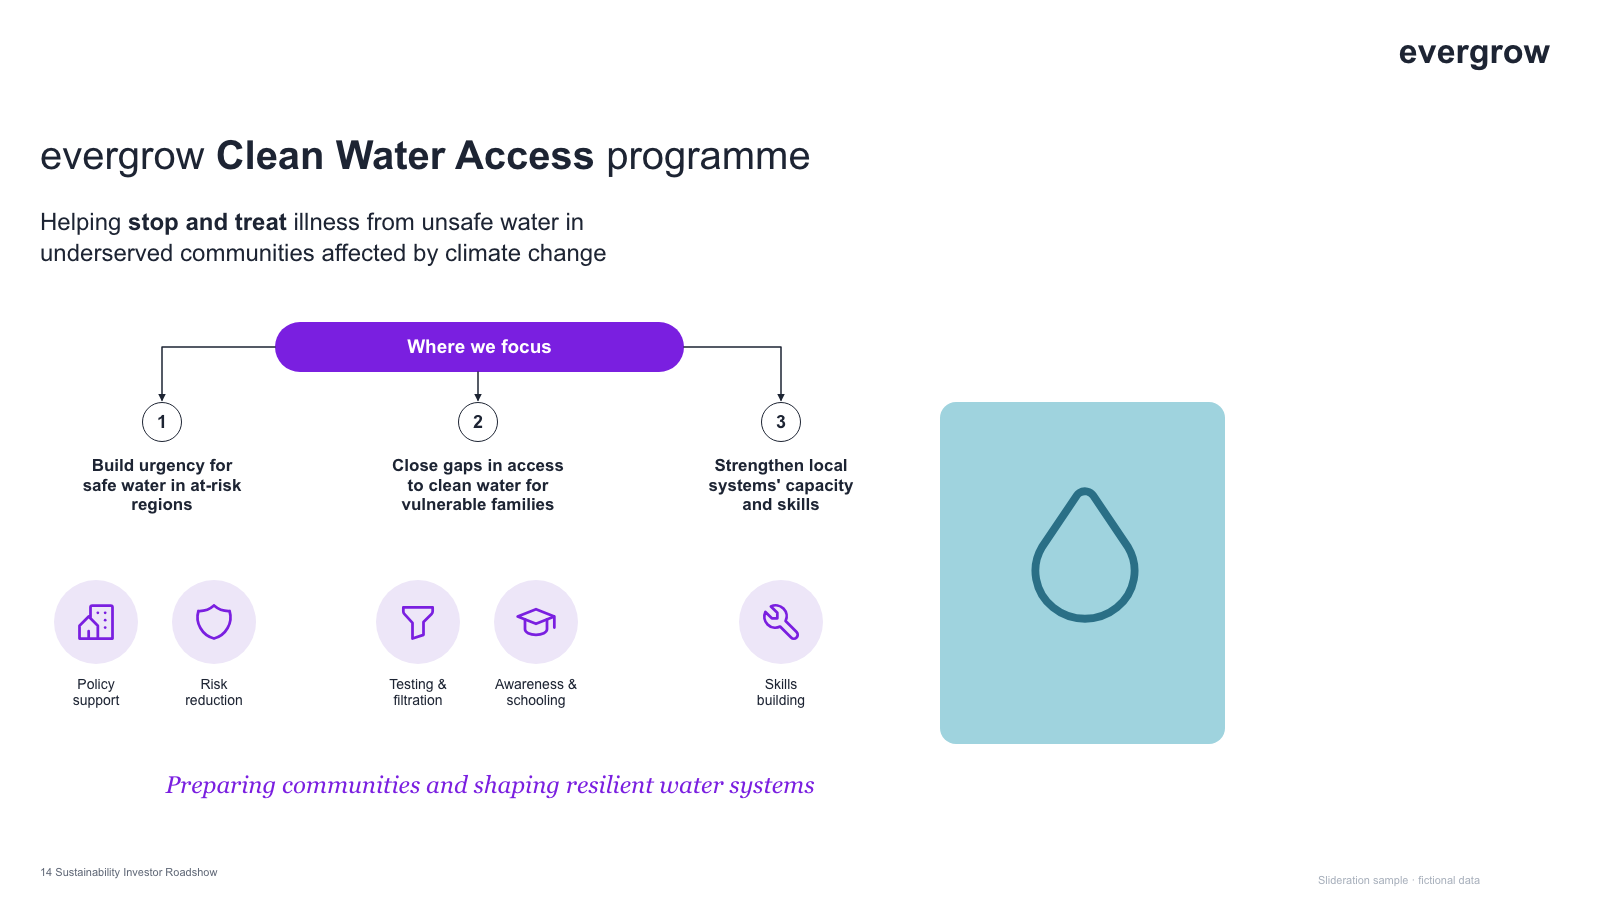
Programme headline, focus pill branching to three numbered pillars with icon circles, image panel and tagline

Programme headline, focus pill branching to three numbered pillars with icon circles, image panel and tagline

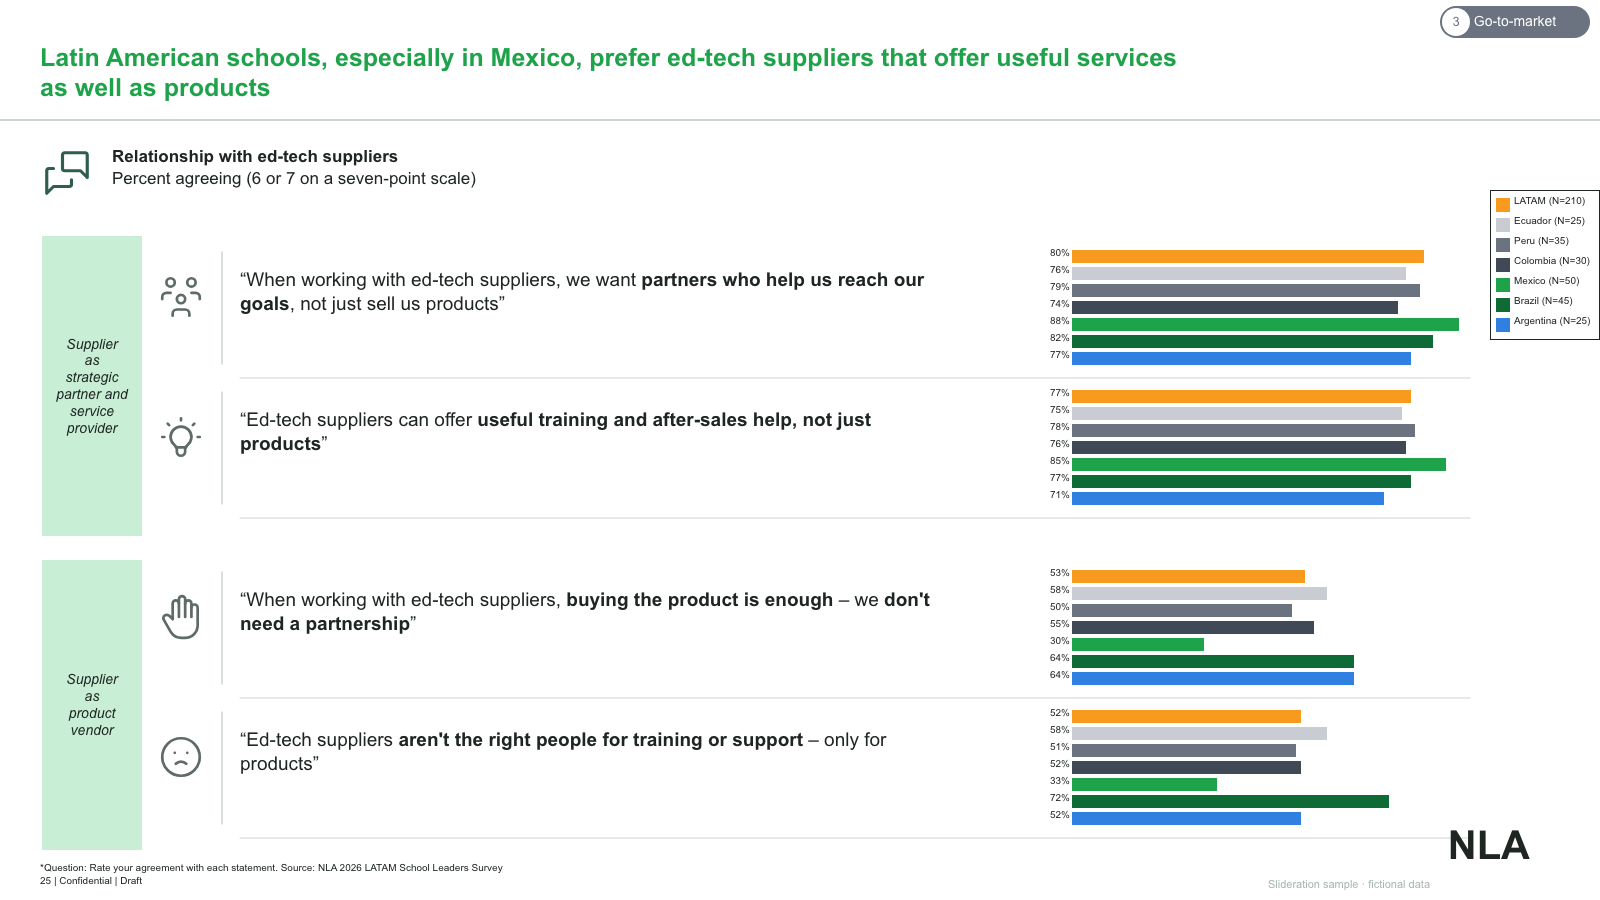
Grouped horizontal bars per statement (seven countries), grouped by two stances, with quotes and a legend

Grouped horizontal bars per statement (seven countries), grouped by two stances, with quotes and a legend

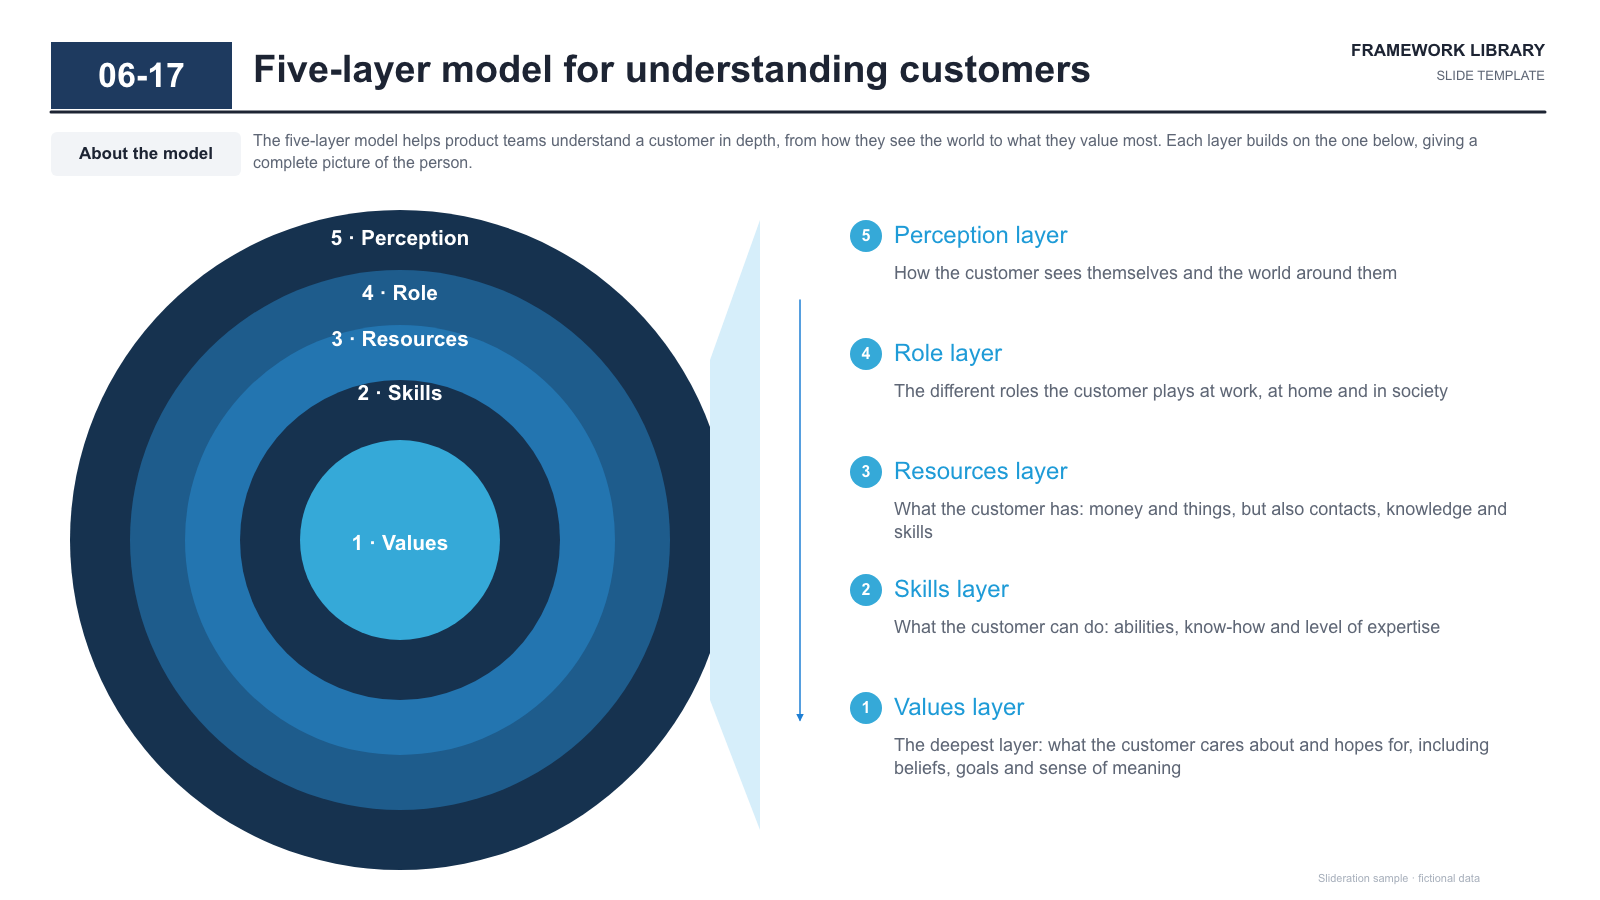
Five concentric rings with numbered labels, a light beam, and a numbered layer-by-layer description list

Five concentric rings with numbered labels, a light beam, and a numbered layer-by-layer description list

Segmented ring with icons around a central head icon, flanked by left and right tip panels

Segmented ring with icons around a central head icon, flanked by left and right tip panels

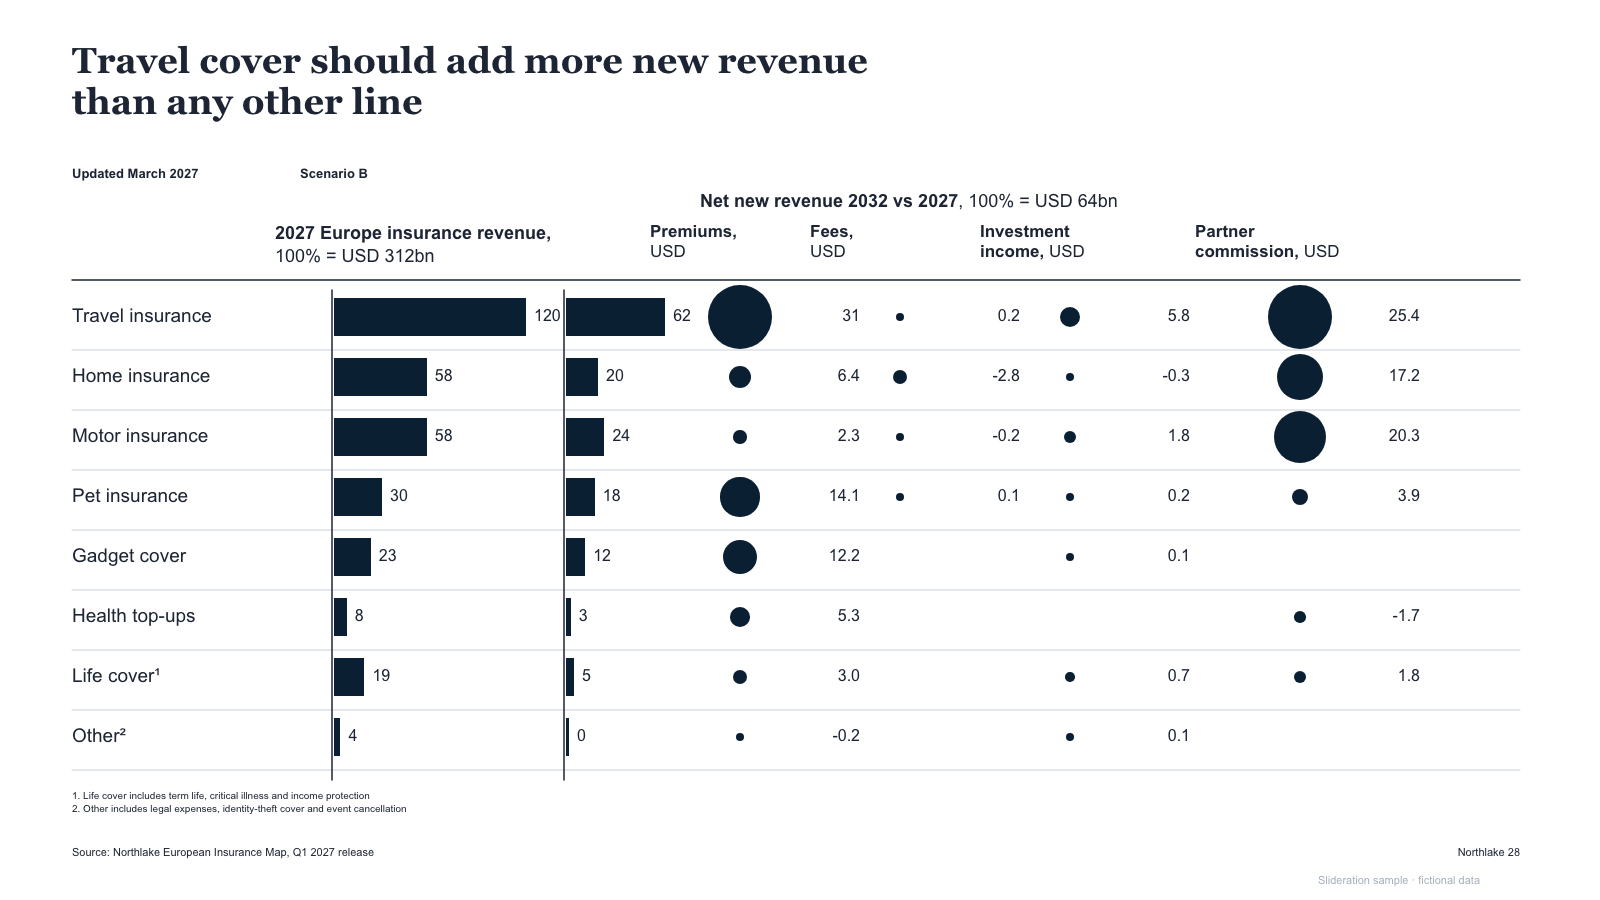
Multi-column table — base bars, second bar series, bubble columns with values, per category row

Multi-column table — base bars, second bar series, bubble columns with values, per category row

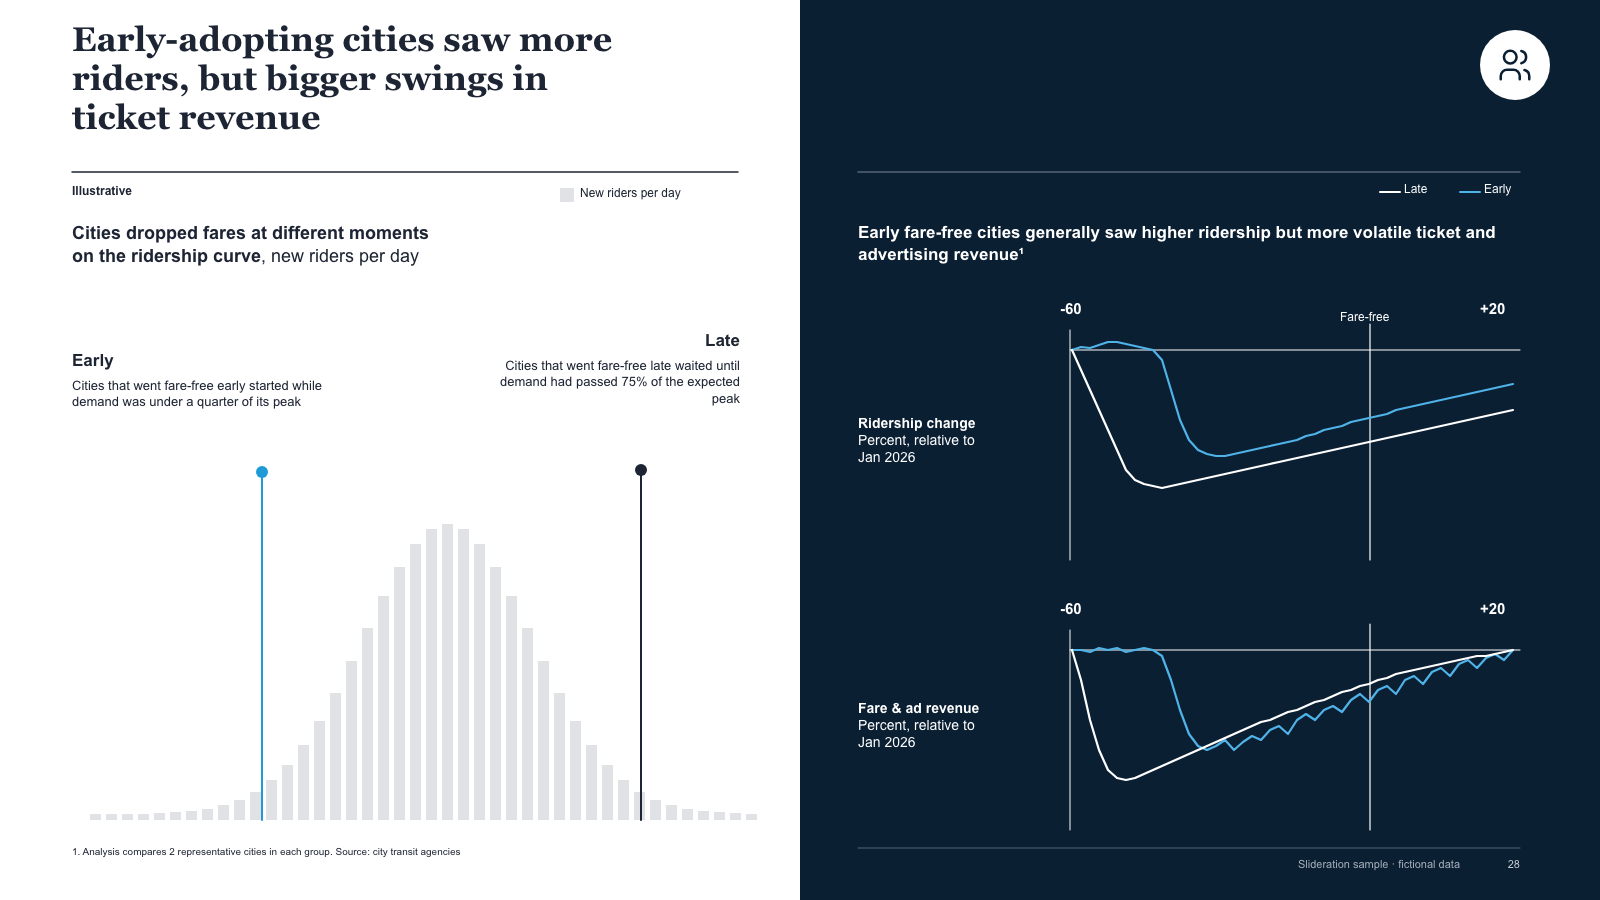
Split slide — illustrative histogram with early/late markers on white, dark panel of two paired line charts

Split slide — illustrative histogram with early/late markers on white, dark panel of two paired line charts

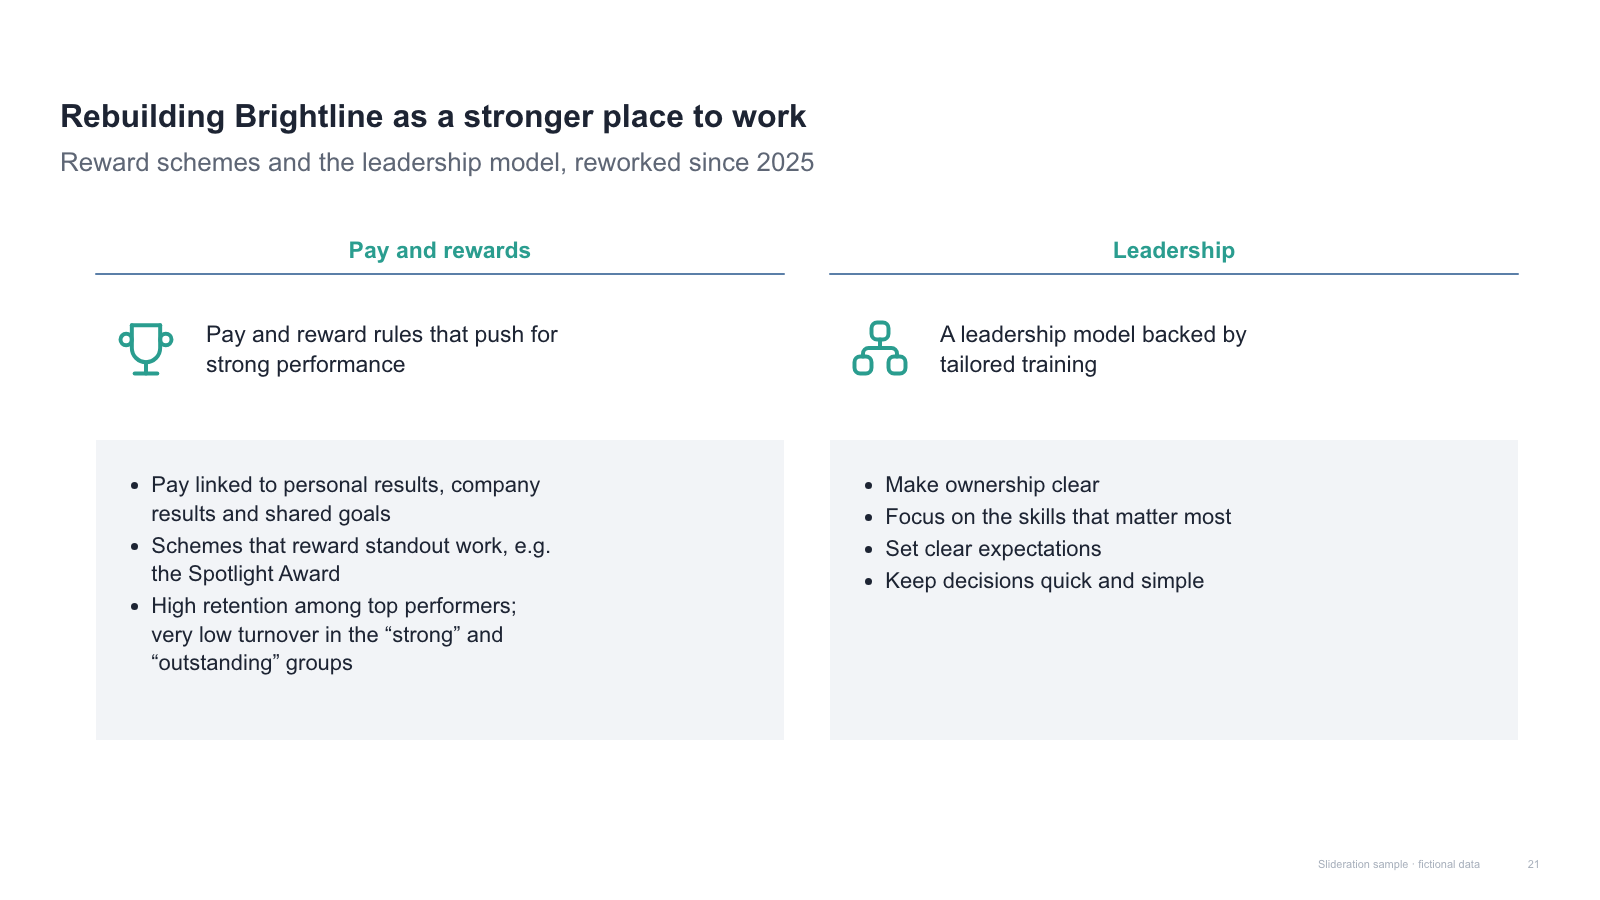
Two labelled columns, each with an icon statement and a grey bullet panel

Two labelled columns, each with an icon statement and a grey bullet panel

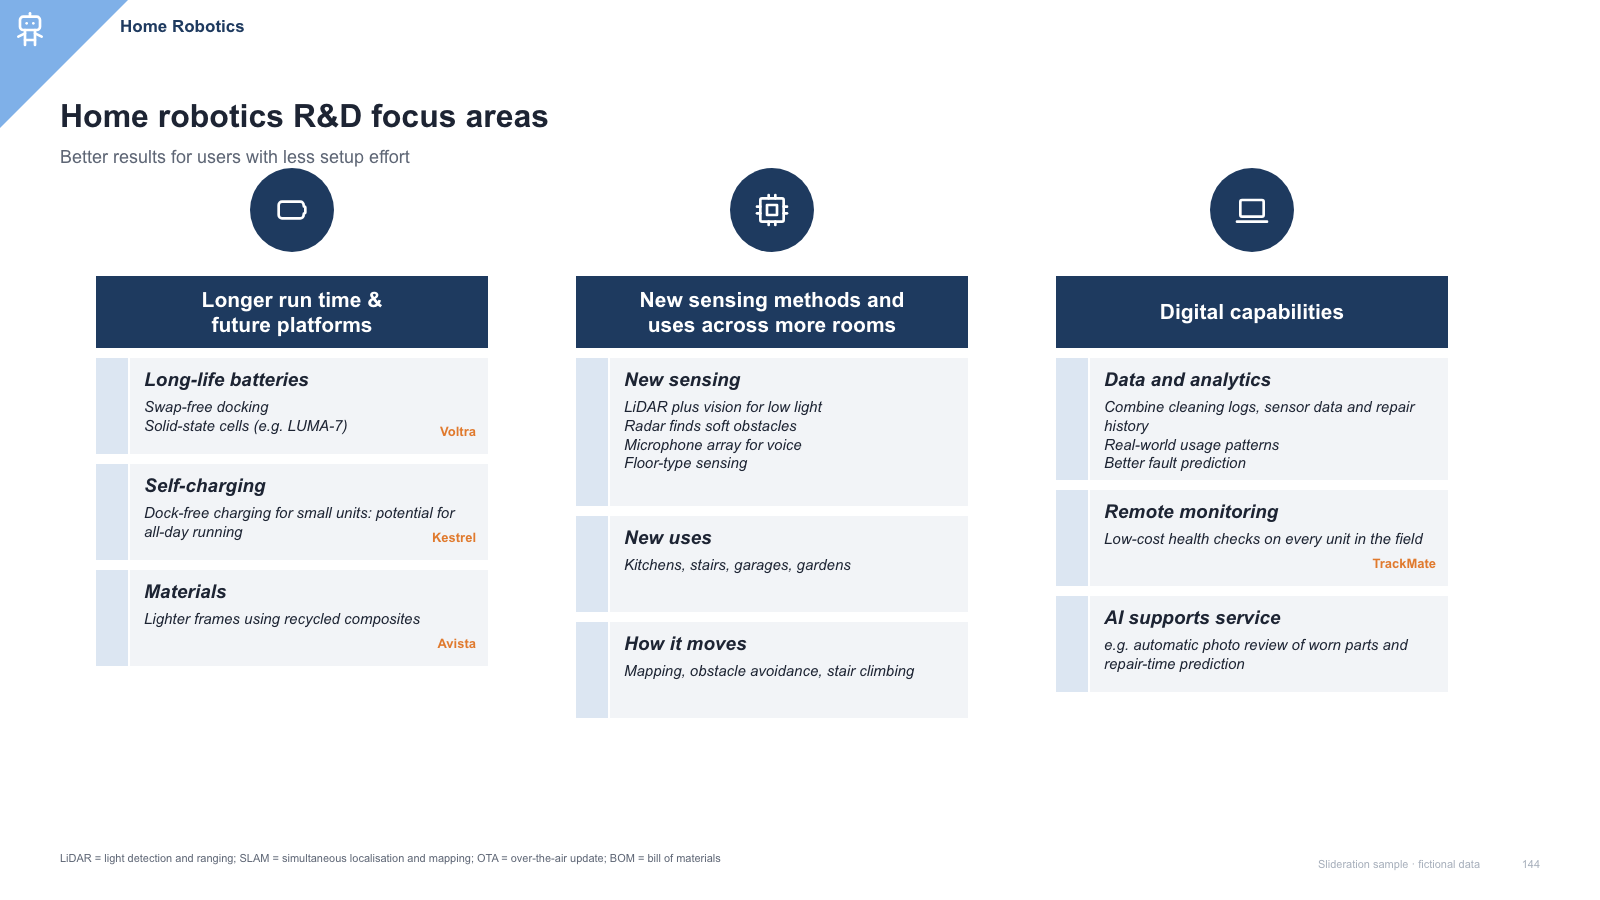
Three icon-topped focus columns, each a header bar over stacked sub-topic cells with partner marks

Three icon-topped focus columns, each a header bar over stacked sub-topic cells with partner marks

Dark comparison table — two technology columns with description and benefit rows, plus row icons

Dark comparison table — two technology columns with description and benefit rows, plus row icons

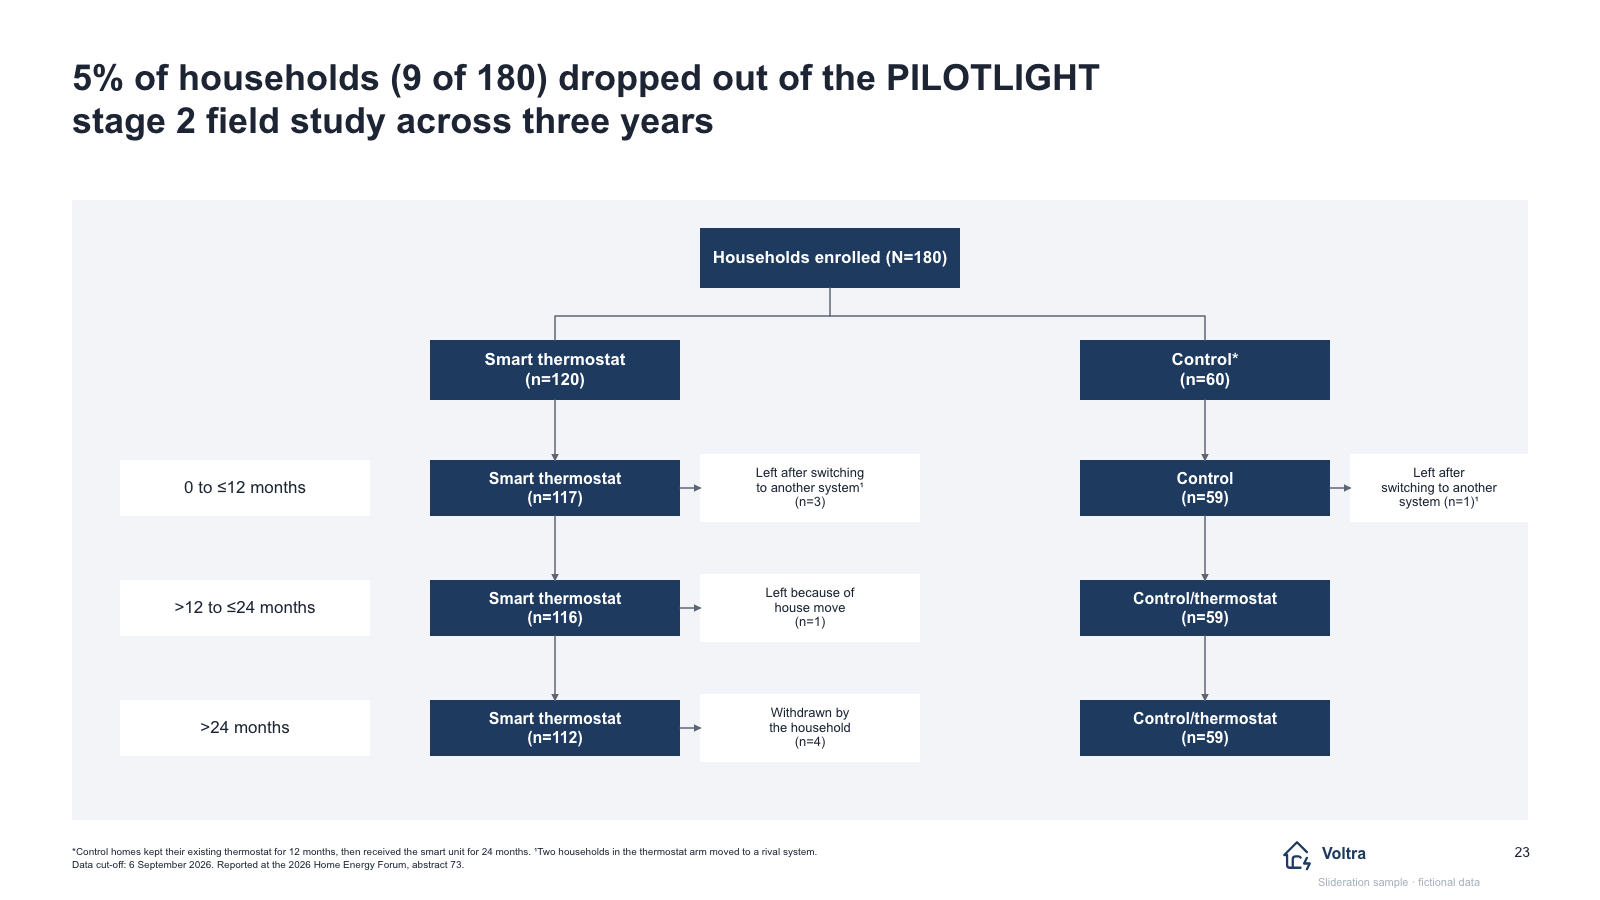
Trial-flow tree — enrolled box splitting into two arms across three time rows with withdrawal boxes

Trial-flow tree — enrolled box splitting into two arms across three time rows with withdrawal boxes

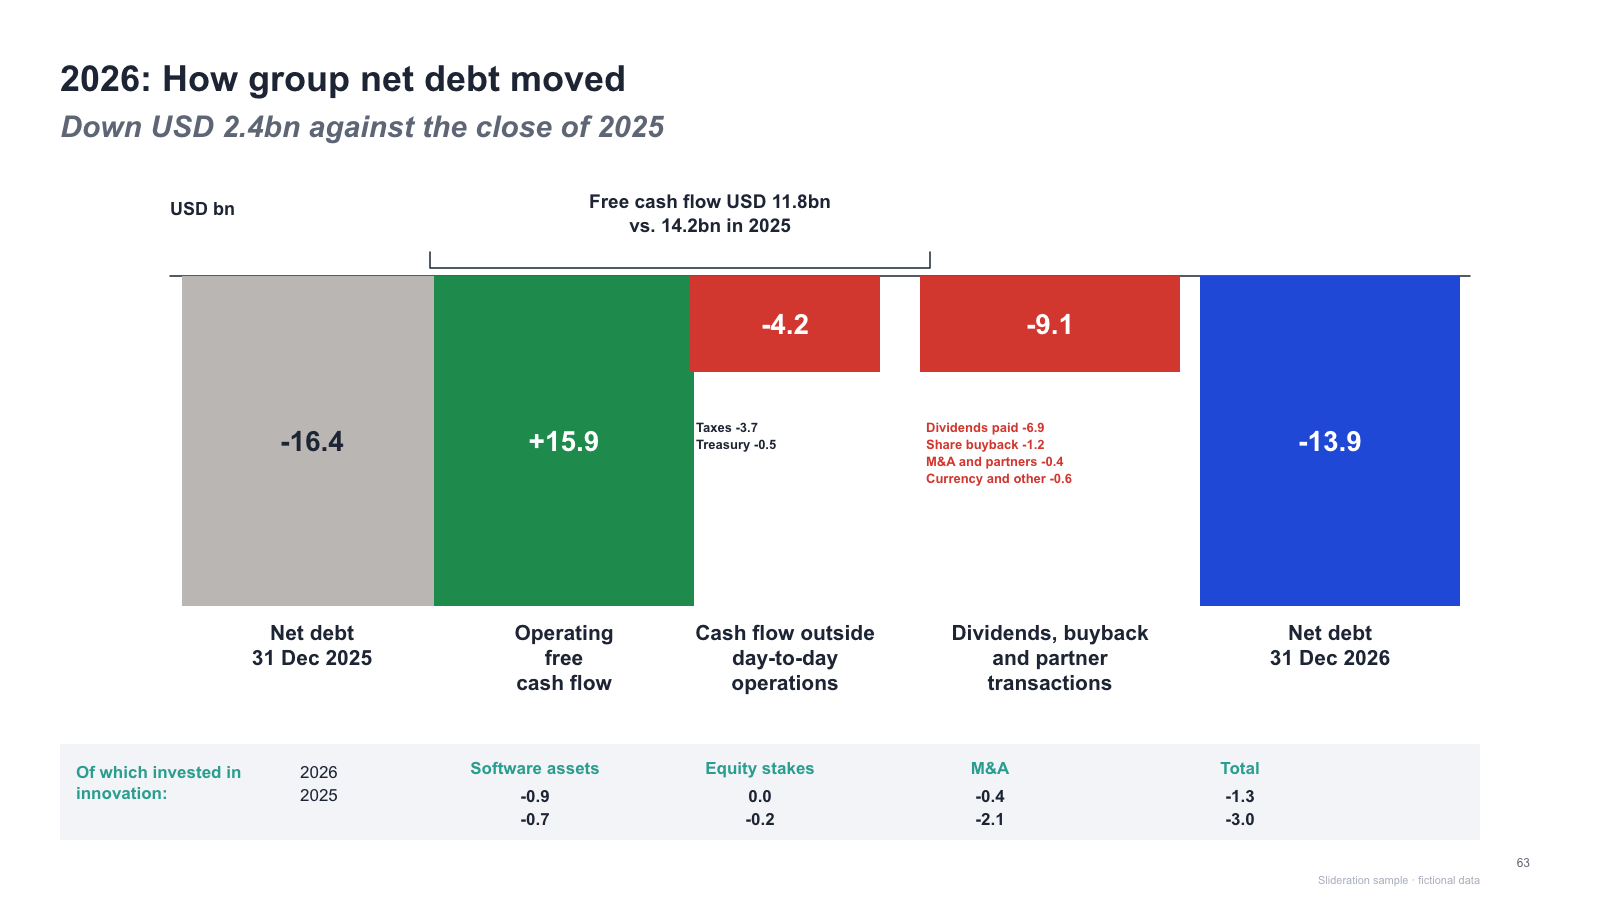
Net-debt bridge of five wide bars with bracket, per-bar breakdown notes and a footer investment table

Net-debt bridge of five wide bars with bracket, per-bar breakdown notes and a footer investment table

Roof banner over four pillar headers, three detail panels, driver rows and a foundation stack

Roof banner over four pillar headers, three detail panels, driver rows and a foundation stack

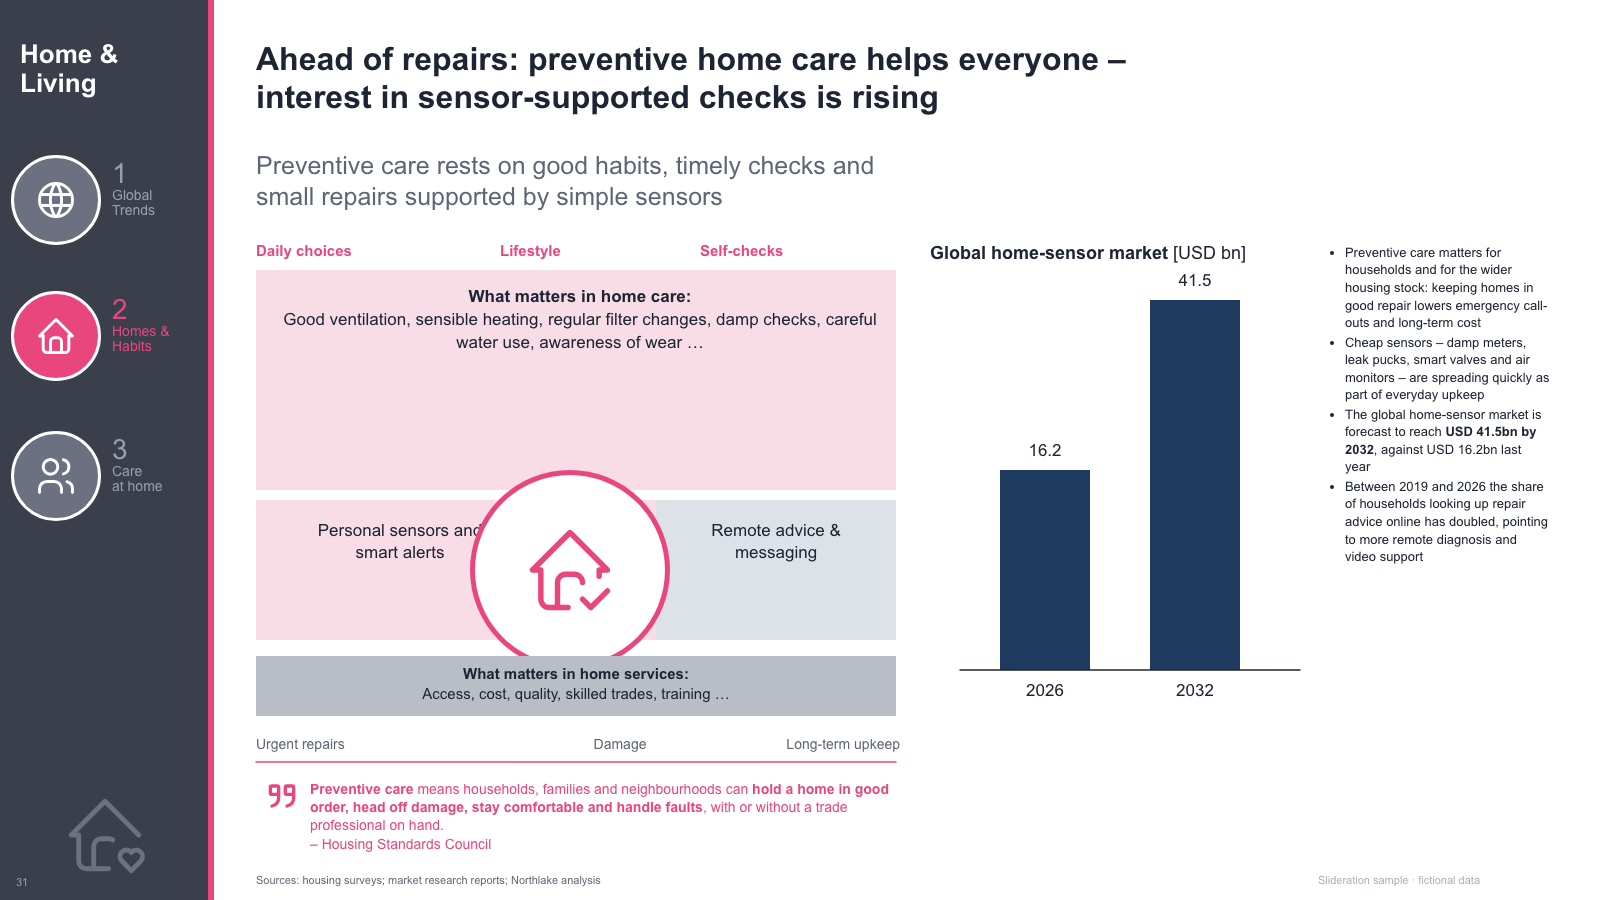
Side rail, tinted factor blocks with a circular emblem, a bar chart panel, bullet column and pull quote

Side rail, tinted factor blocks with a circular emblem, a bar chart panel, bullet column and pull quote

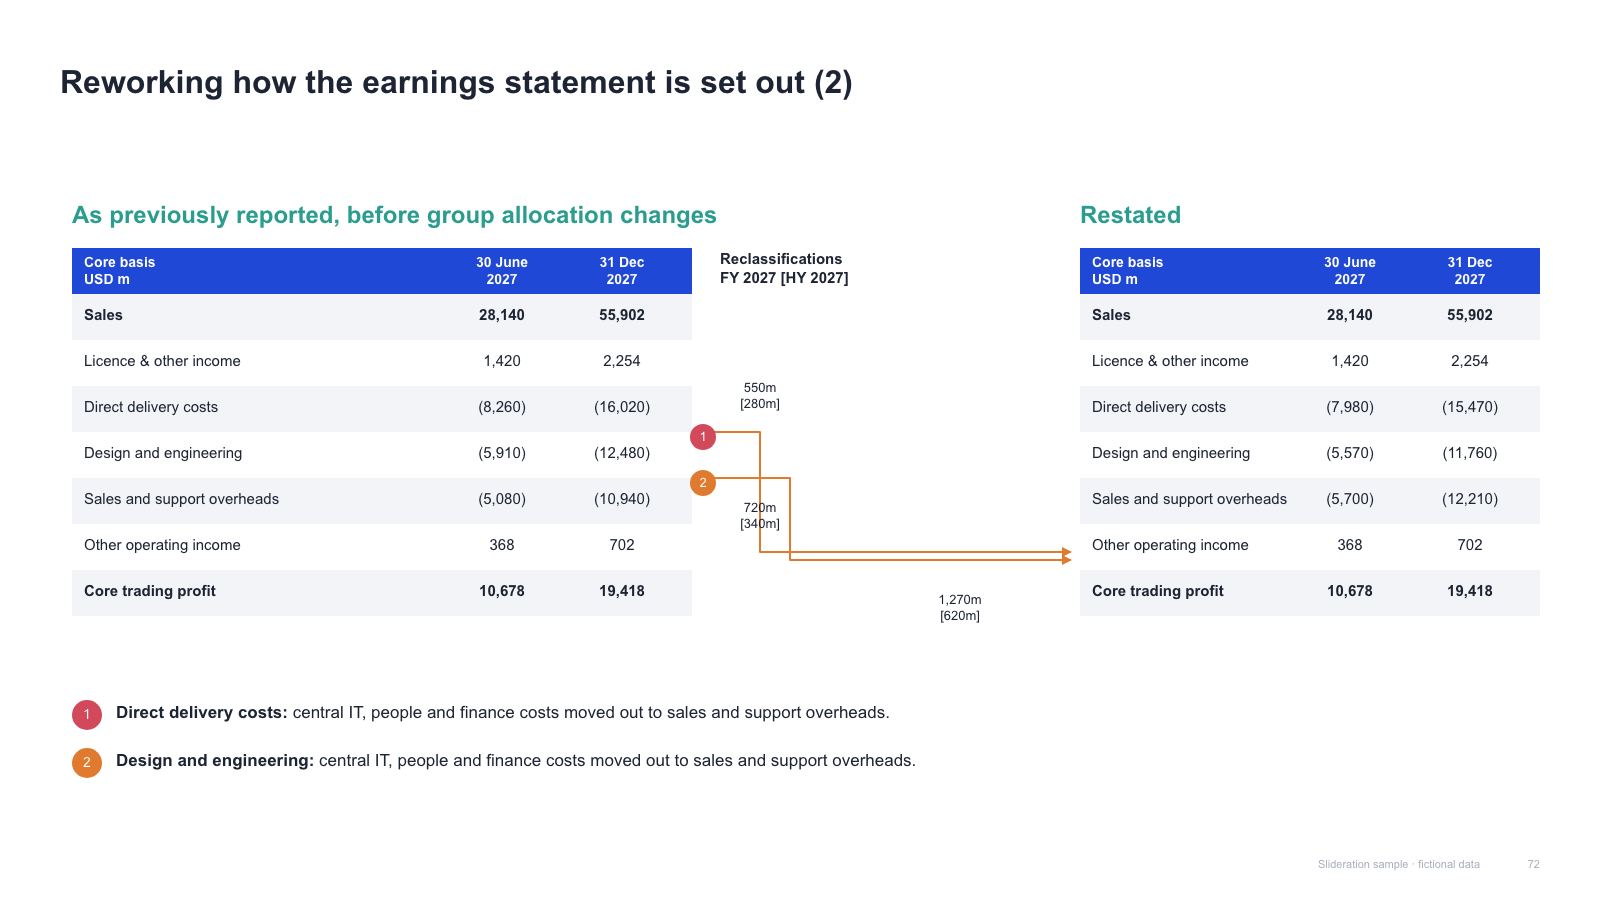
Two financial tables (before / restated) with reclassification arrows and numbered footnotes

Two financial tables (before / restated) with reclassification arrows and numbered footnotes

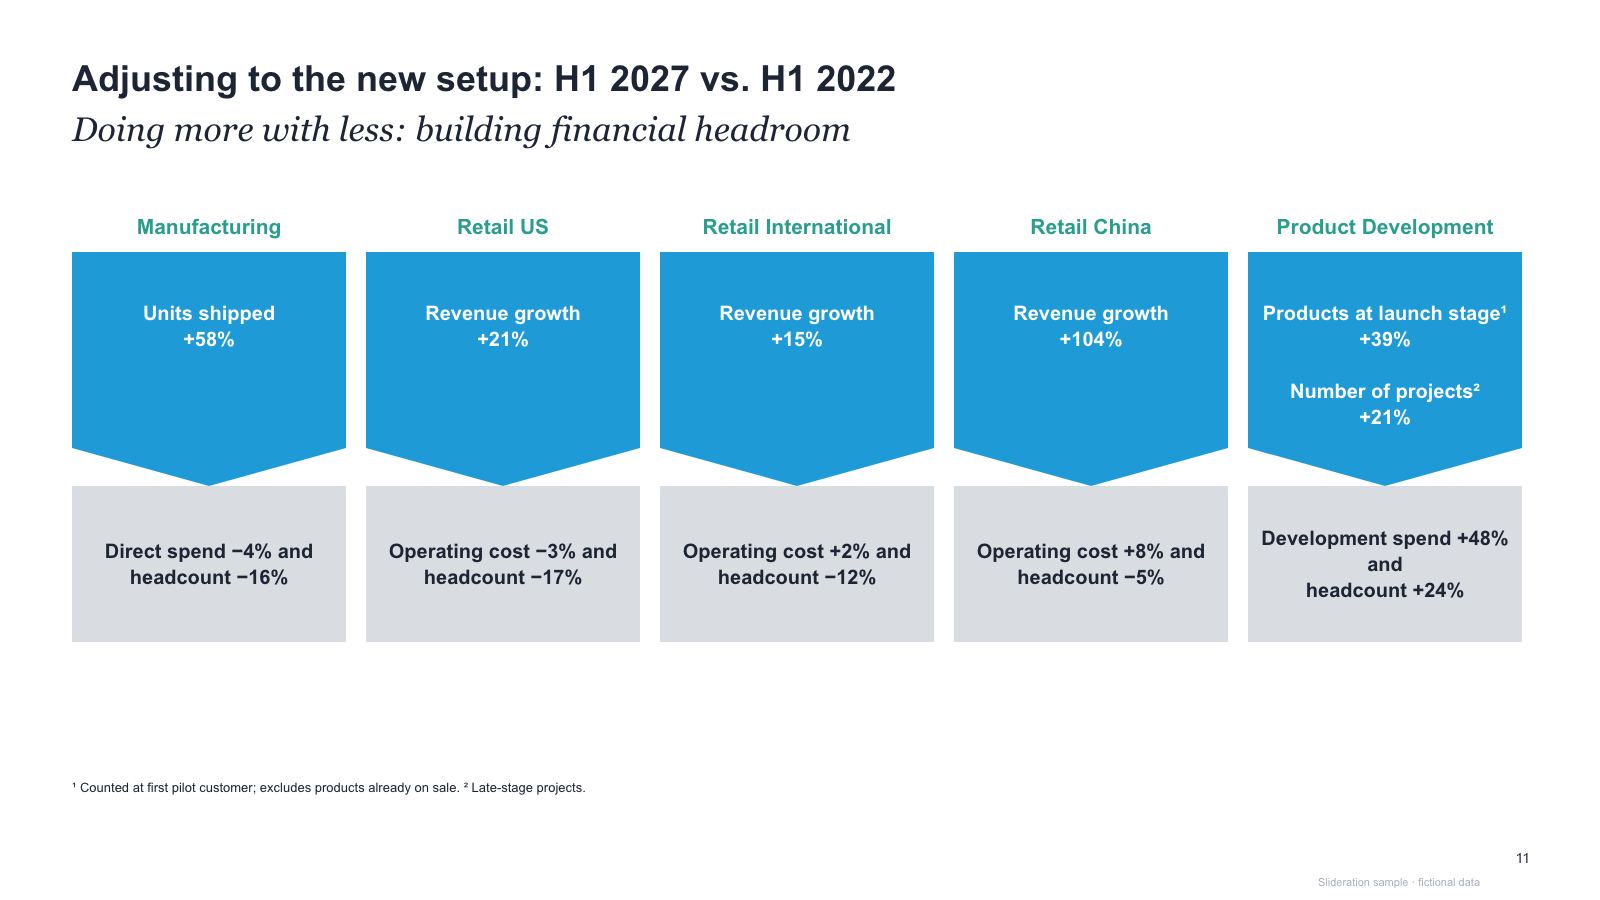
Five unit columns, each a coloured metric card with a notch pointing to a grey cost line

Five unit columns, each a coloured metric card with a notch pointing to a grey cost line

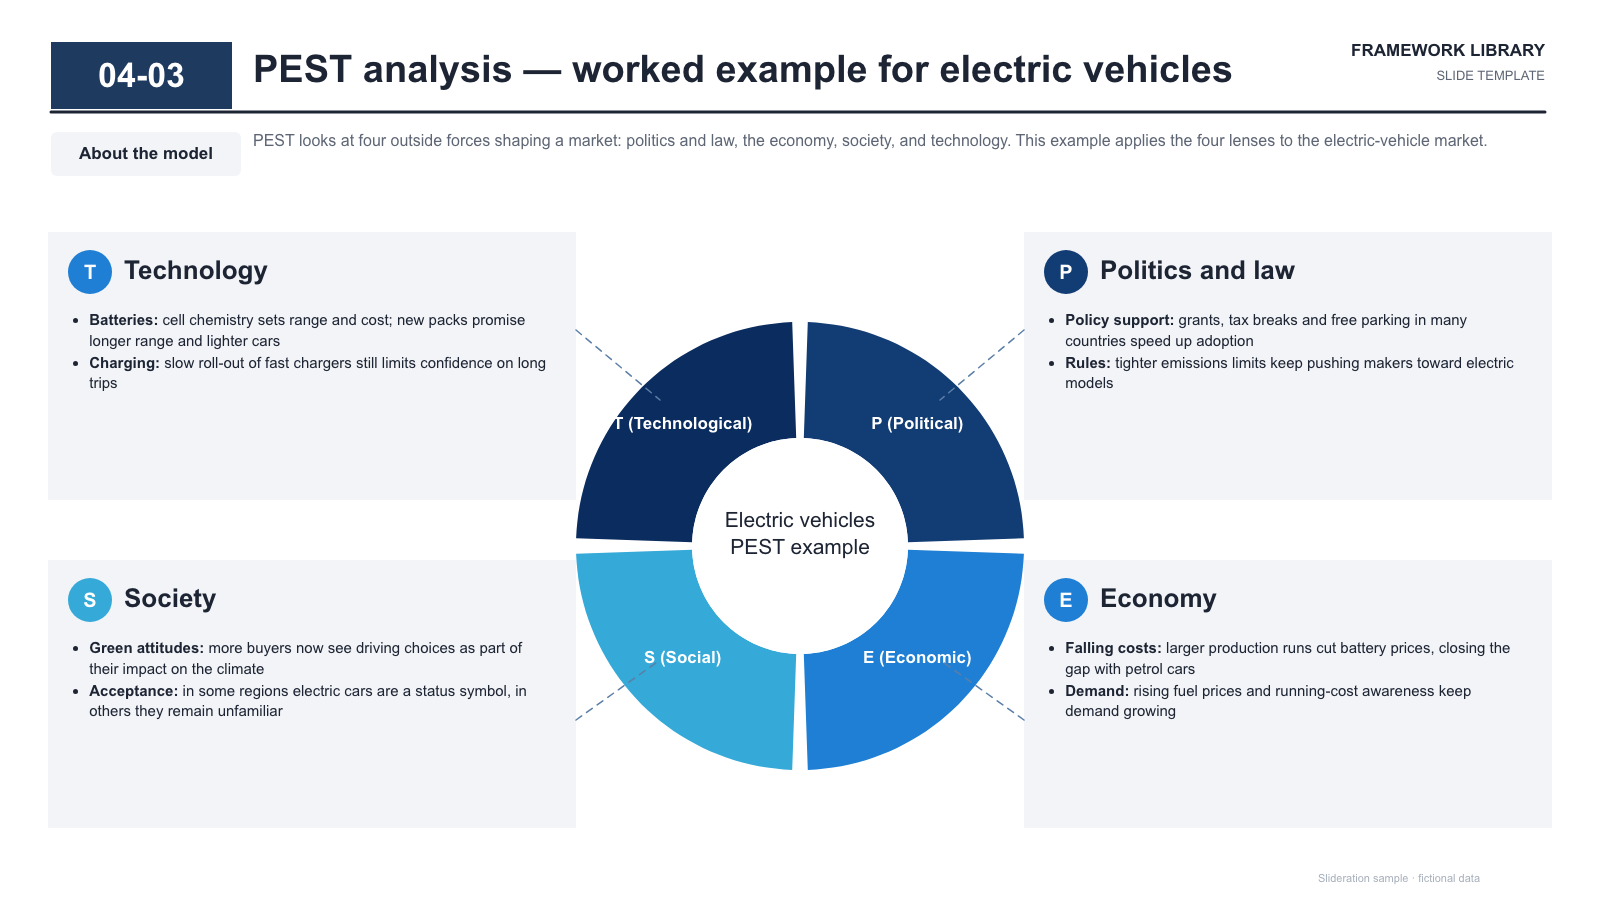
Four quadrant ring with labelled letters in the centre and four tinted note panels at the corners

Four quadrant ring with labelled letters in the centre and four tinted note panels at the corners

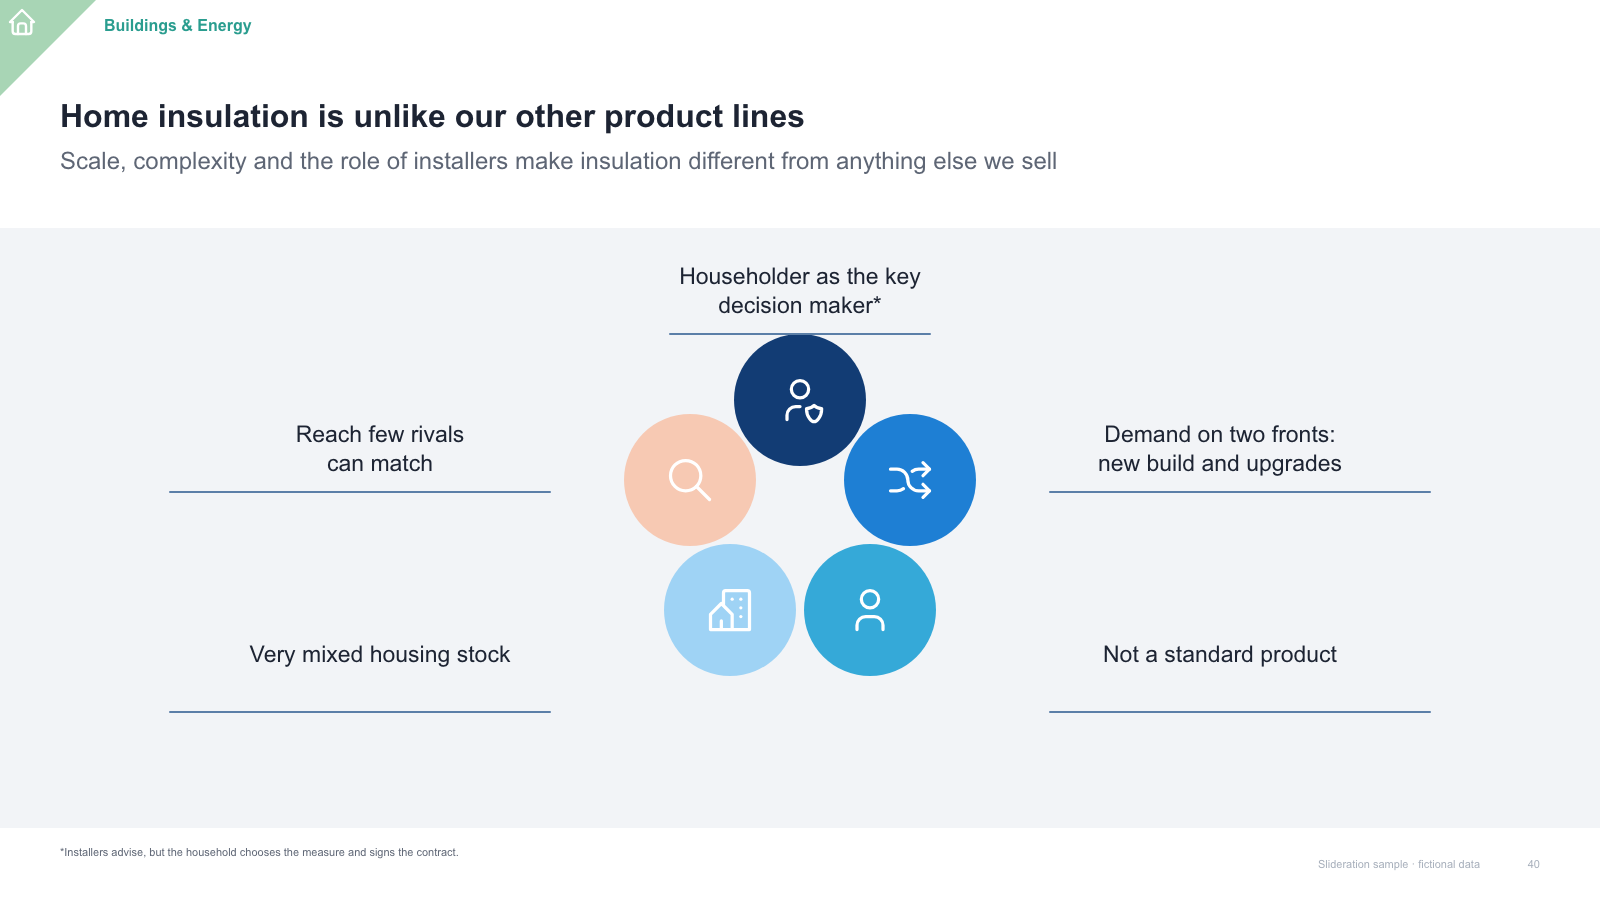
Five overlapping circles around a centre, with four statement labels joined by short rules

Five overlapping circles around a centre, with four statement labels joined by short rules

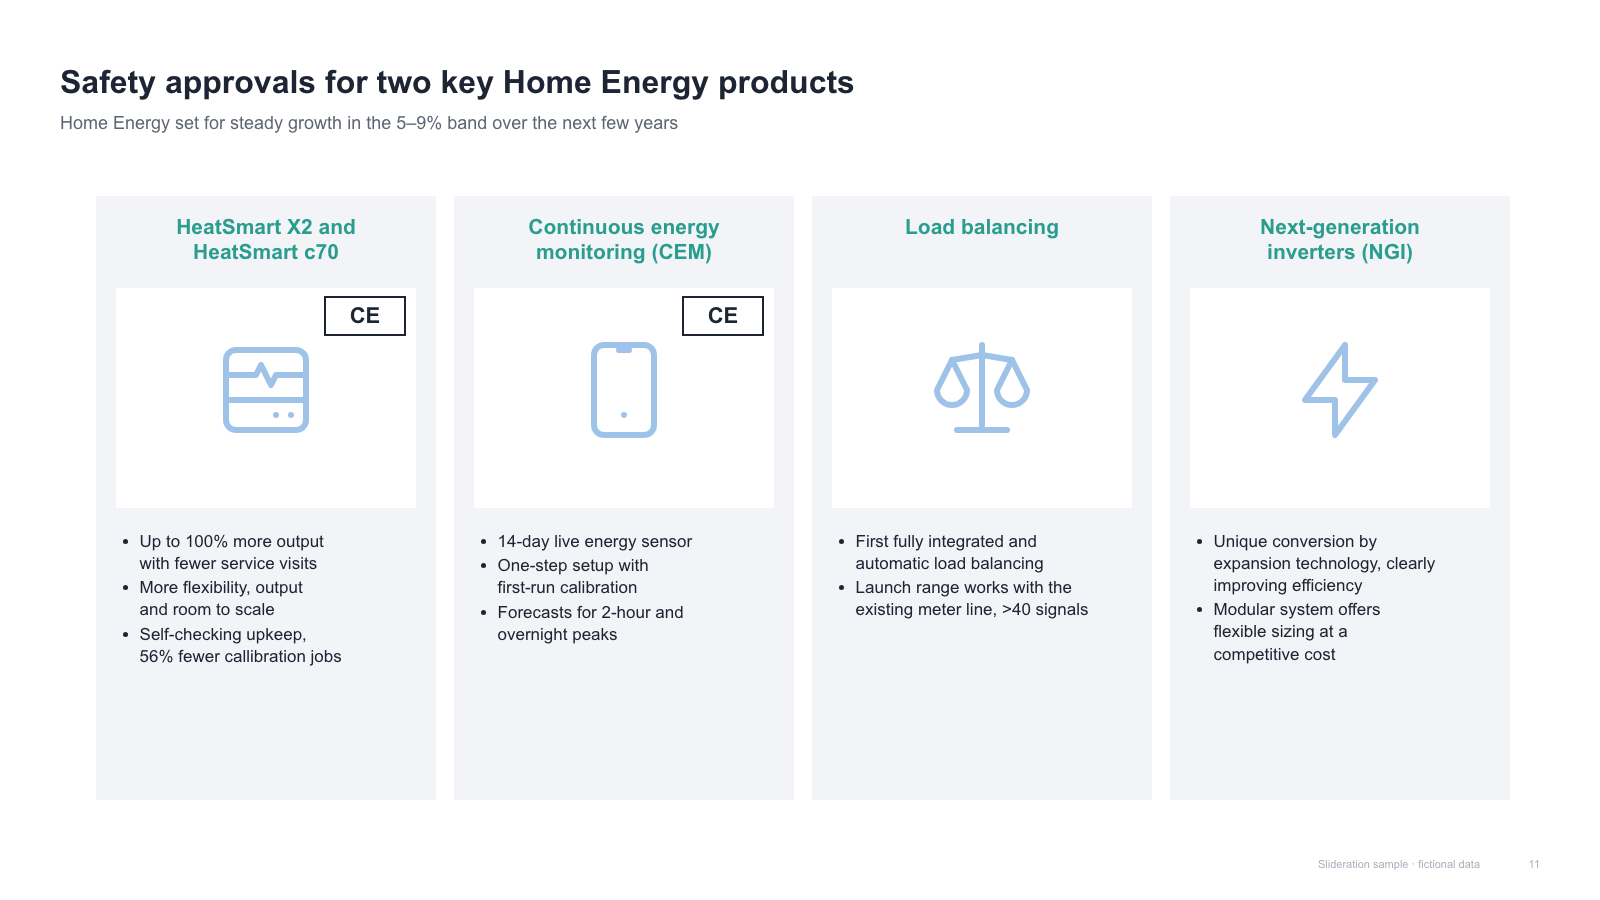
Four product cards with approval stamps, device illustration panels and bullet lists

Four product cards with approval stamps, device illustration panels and bullet lists

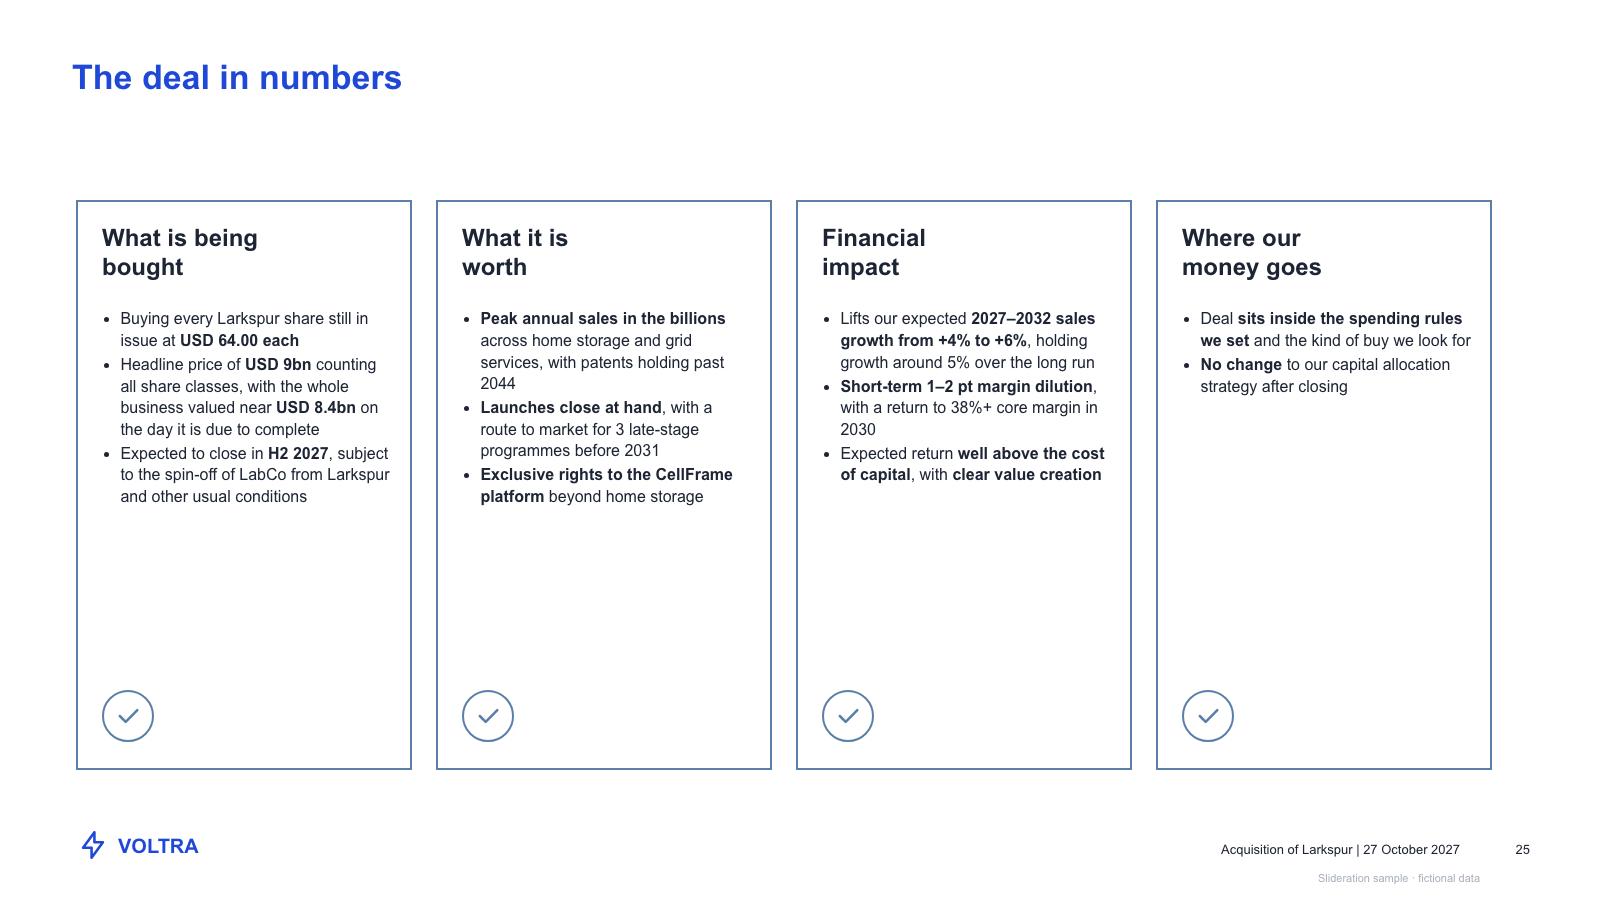
Four outlined summary cards with bullet lists and a tick badge at the foot of each

Four outlined summary cards with bullet lists and a tick badge at the foot of each

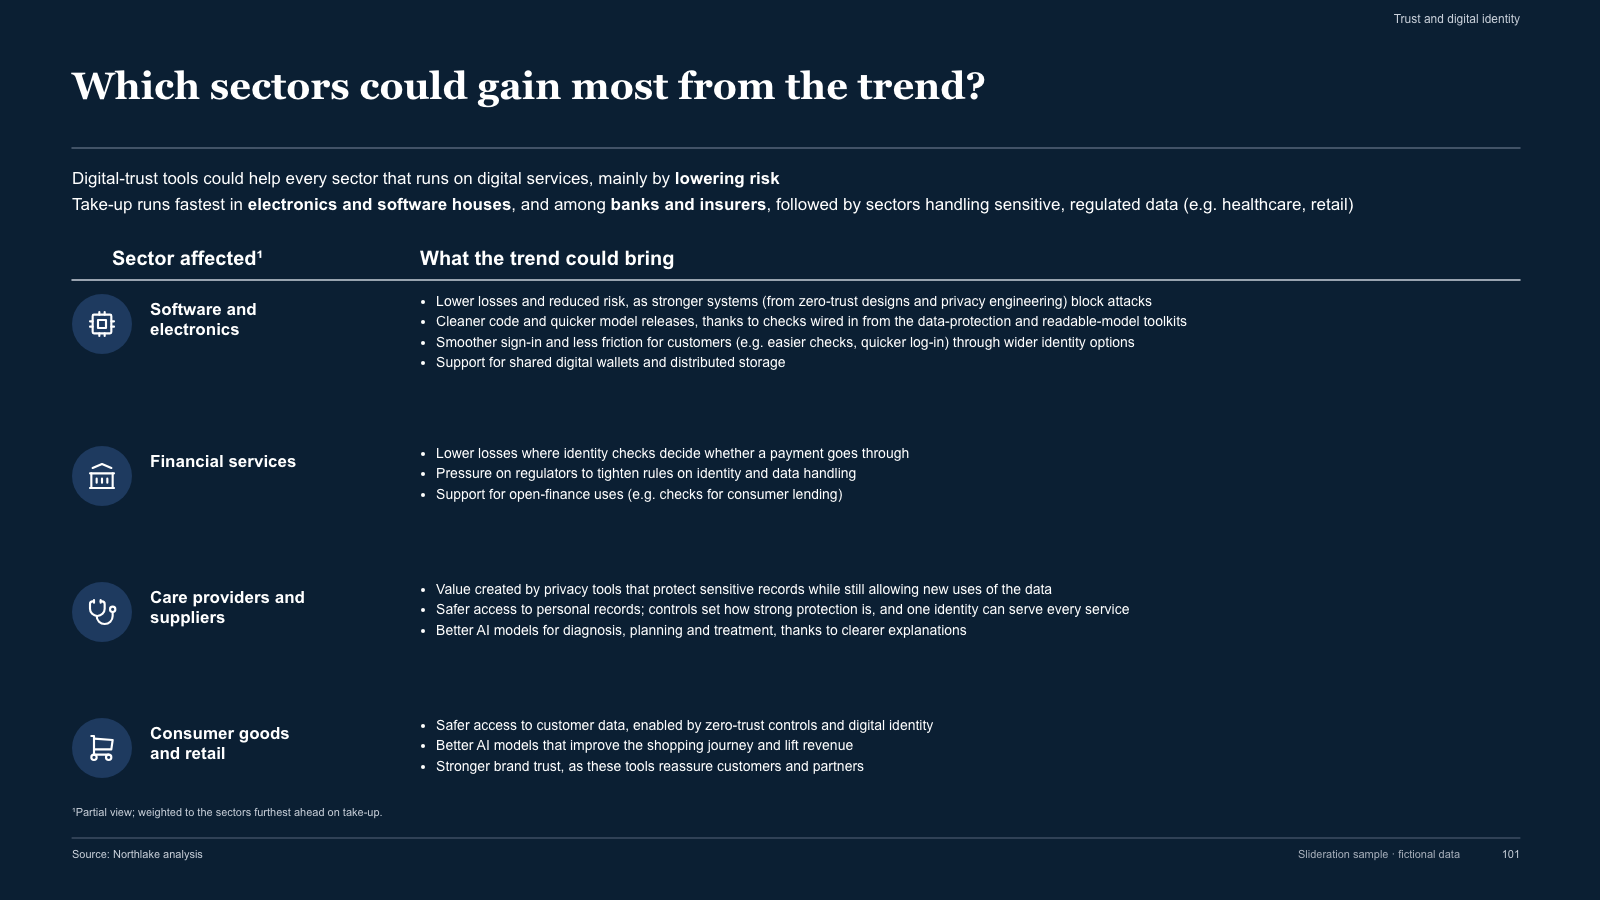
Dark sector-impact table with circular thumbnails, sector labels and multi-bullet impact column

Dark sector-impact table with circular thumbnails, sector labels and multi-bullet impact column

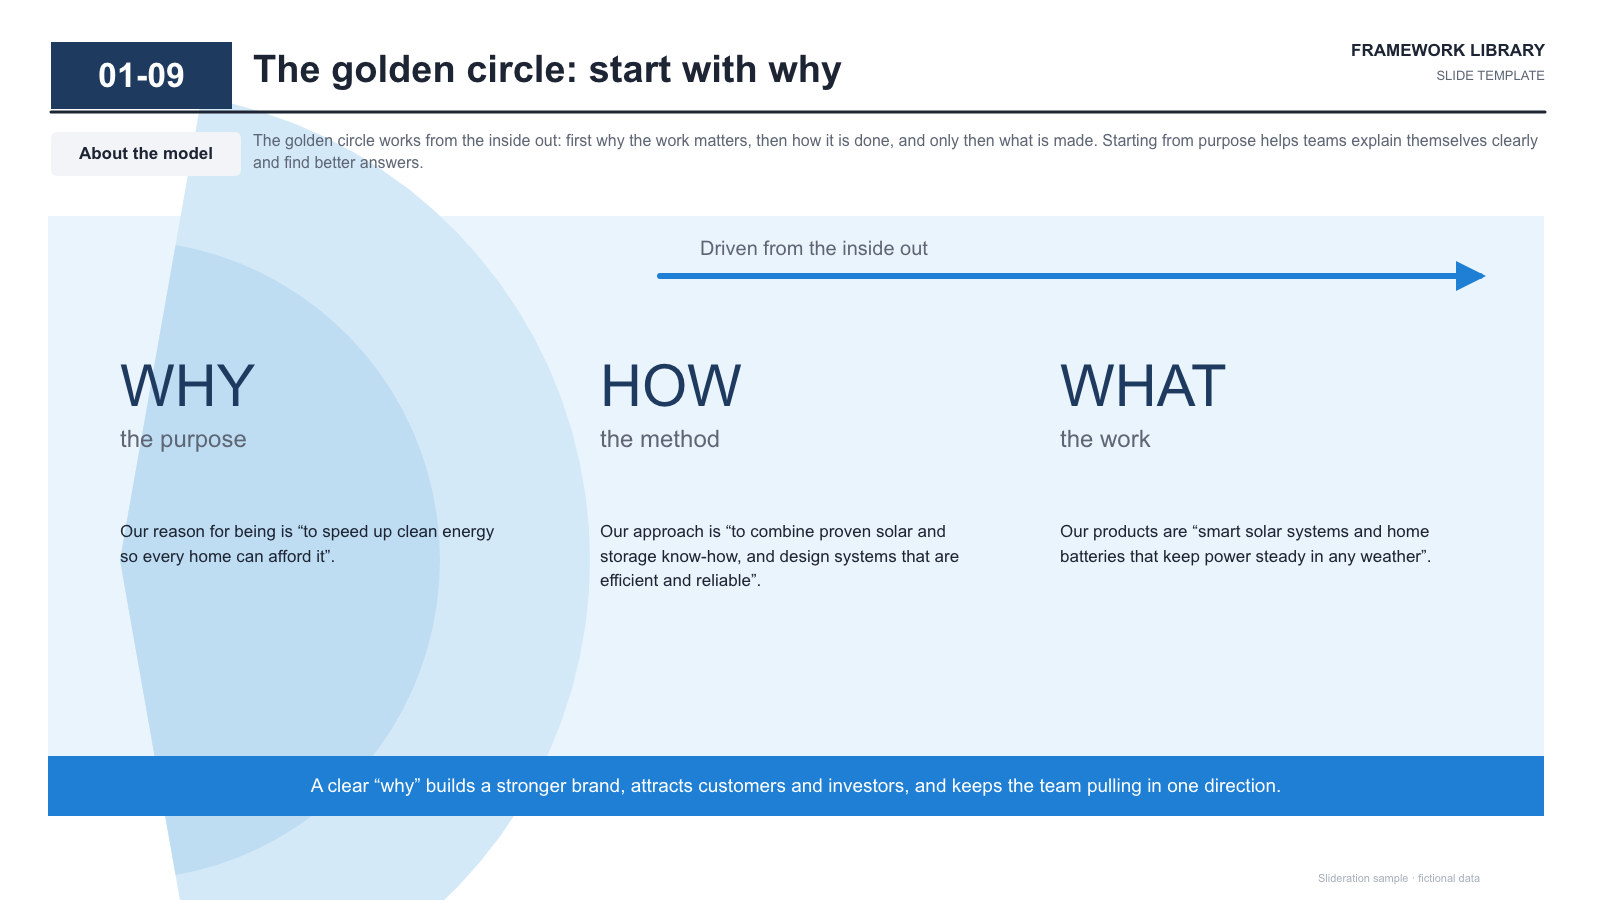
Inside-out arrow over three nested tinted arcs with WHY / HOW / WHAT columns and a closing band

Inside-out arrow over three nested tinted arcs with WHY / HOW / WHAT columns and a closing band

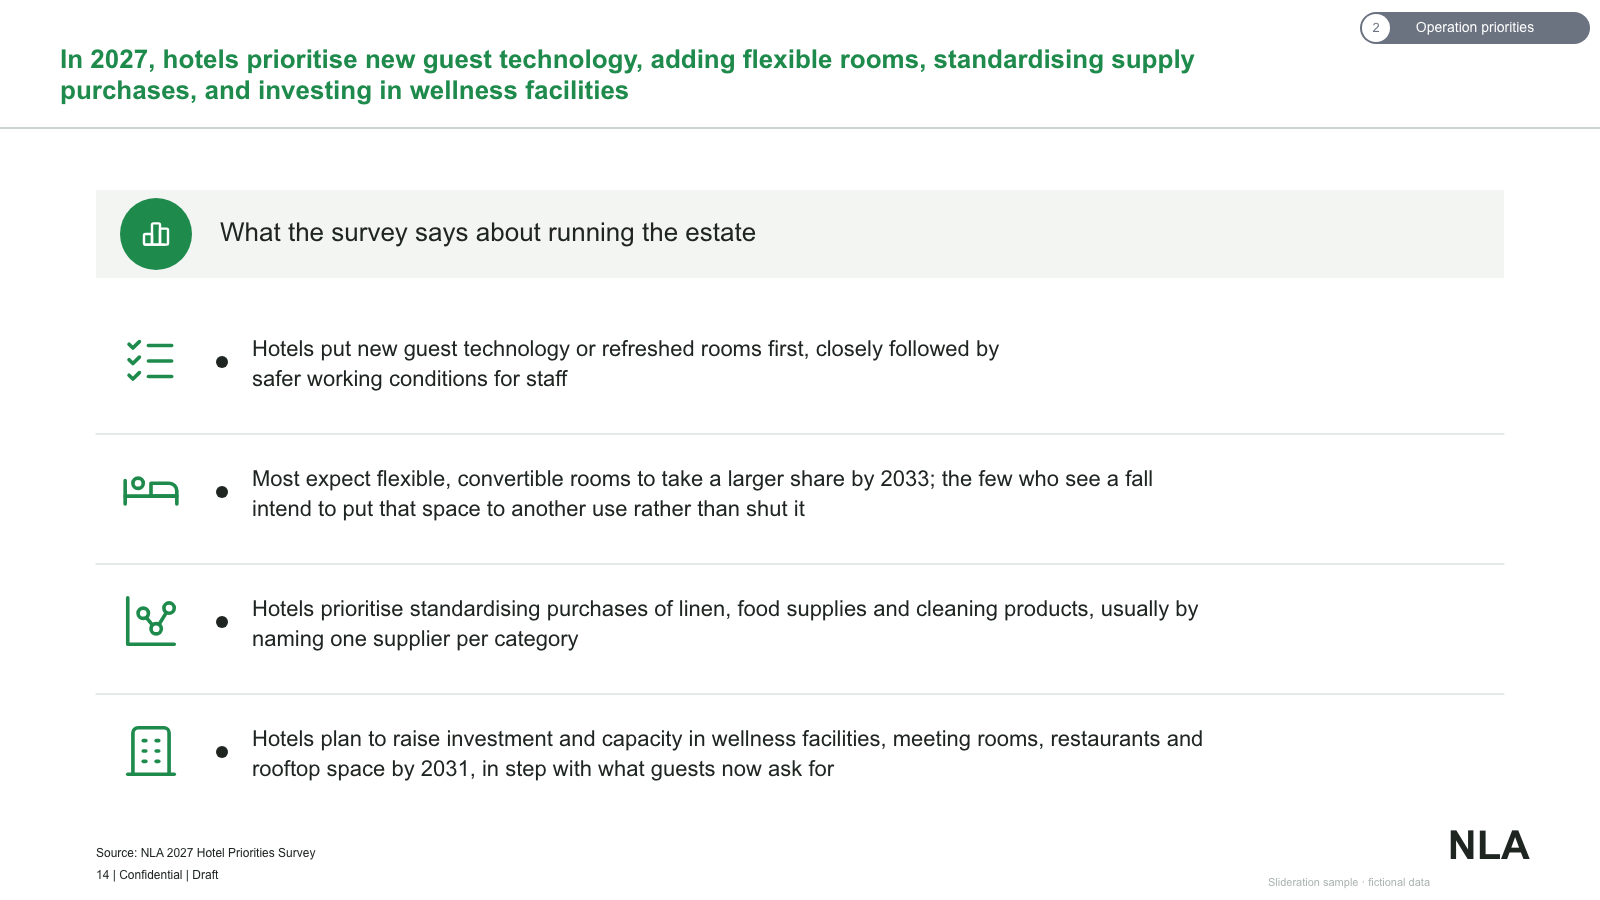
Findings summary — badge header bar over four icon-led finding rows with dividers

Findings summary — badge header bar over four icon-led finding rows with dividers

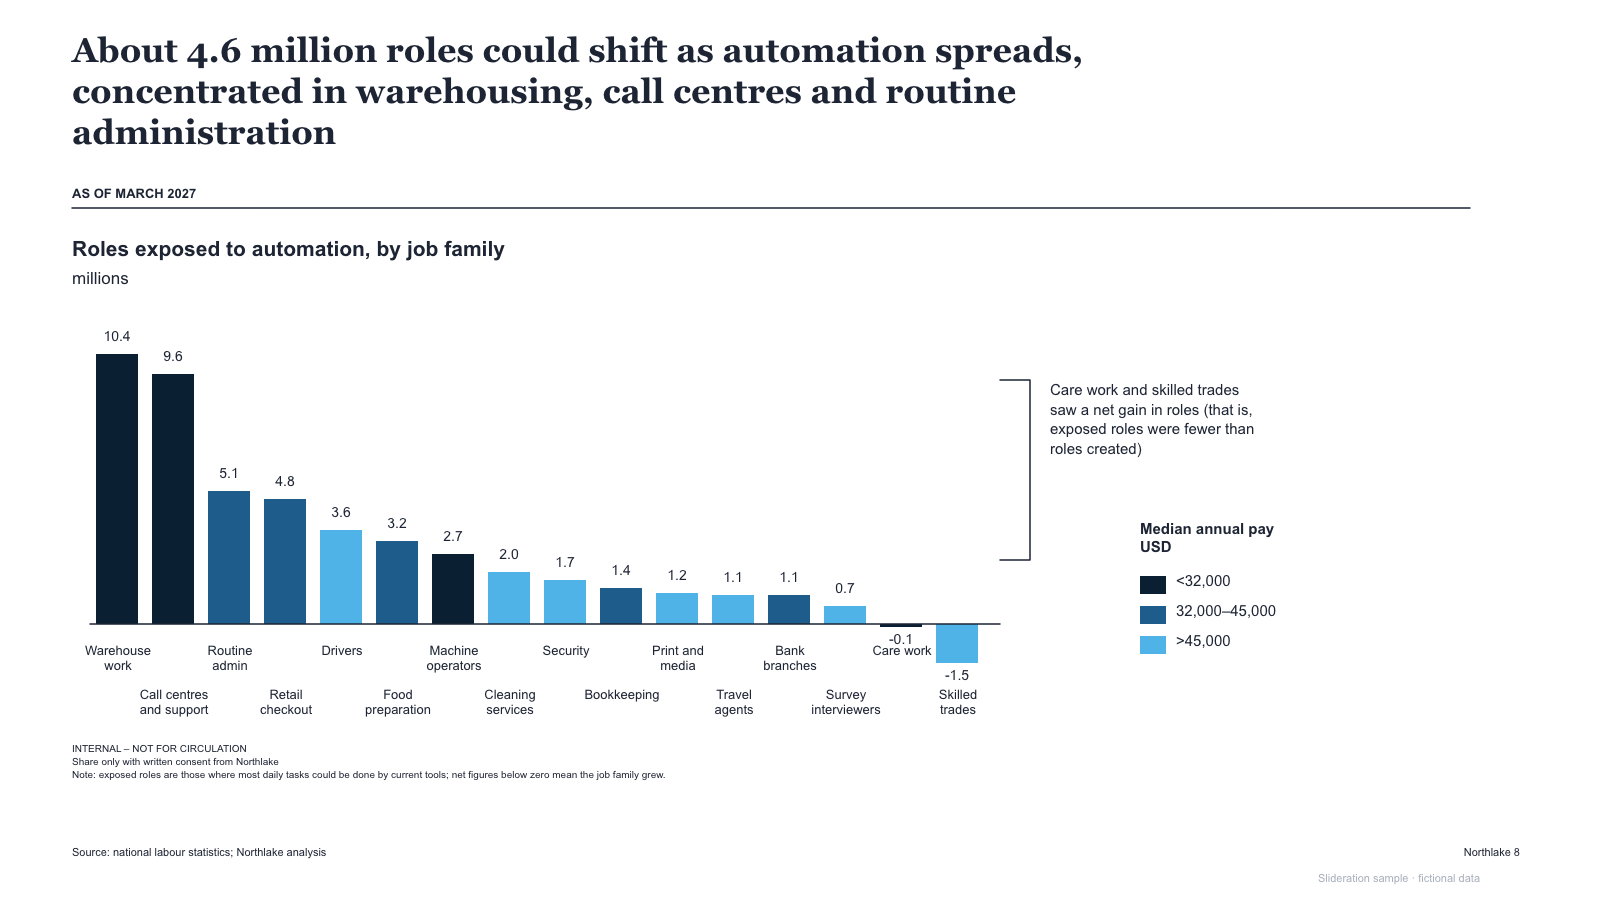
Ranked bar chart with wage-band colour legend, two negative bars and a bracketed side note

Ranked bar chart with wage-band colour legend, two negative bars and a bracketed side note

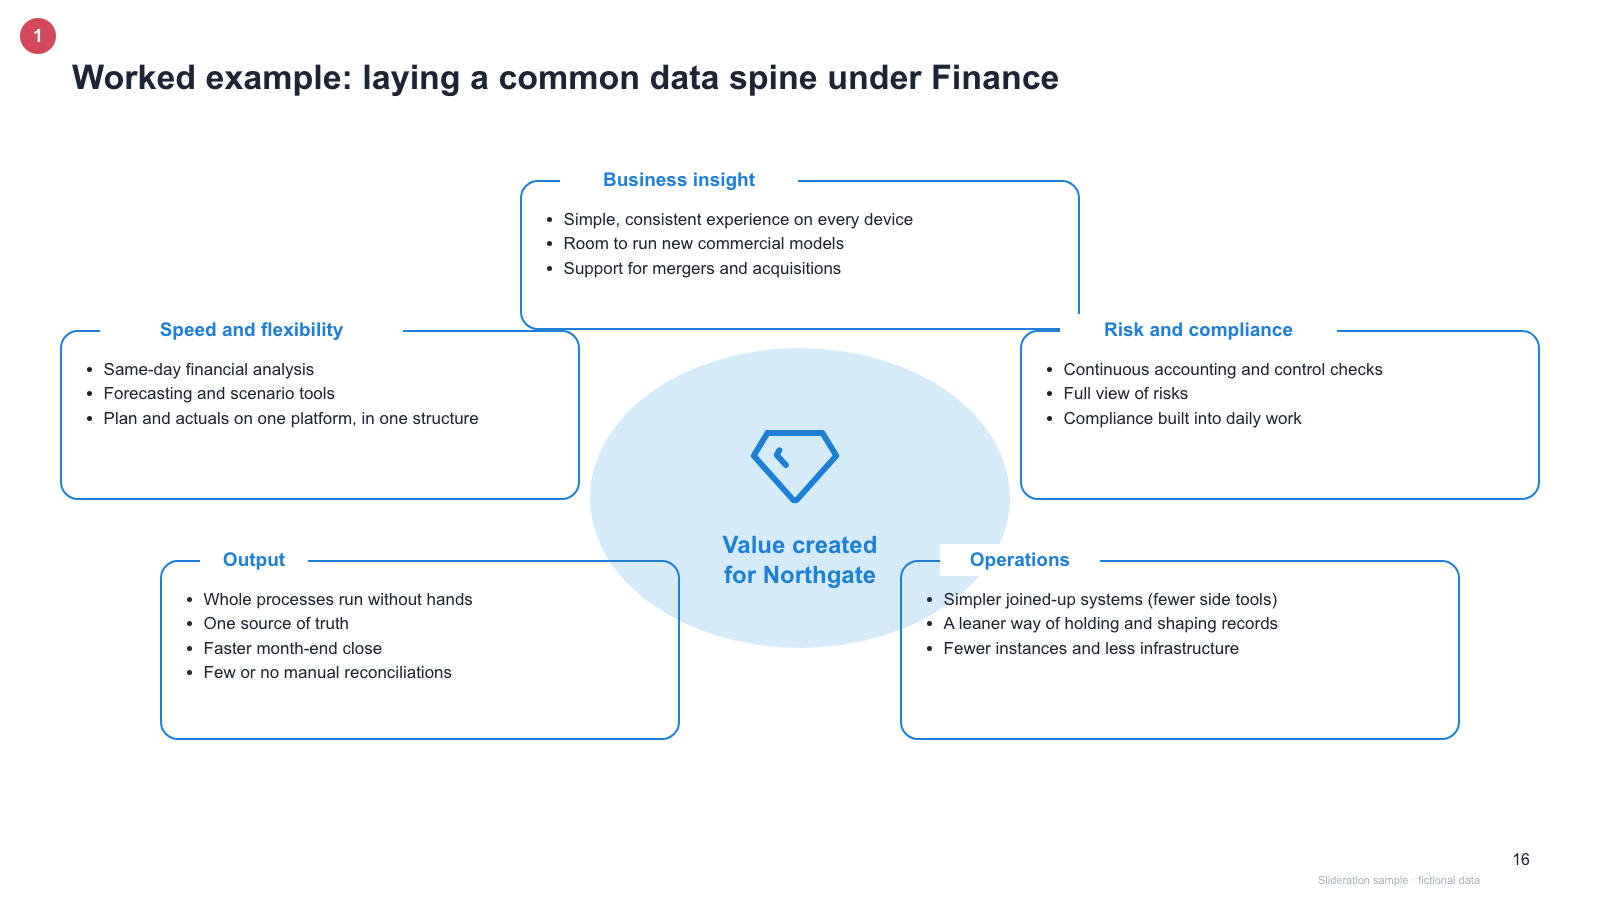
Central value oval with five rounded callout boxes and small tab labels around it

Central value oval with five rounded callout boxes and small tab labels around it

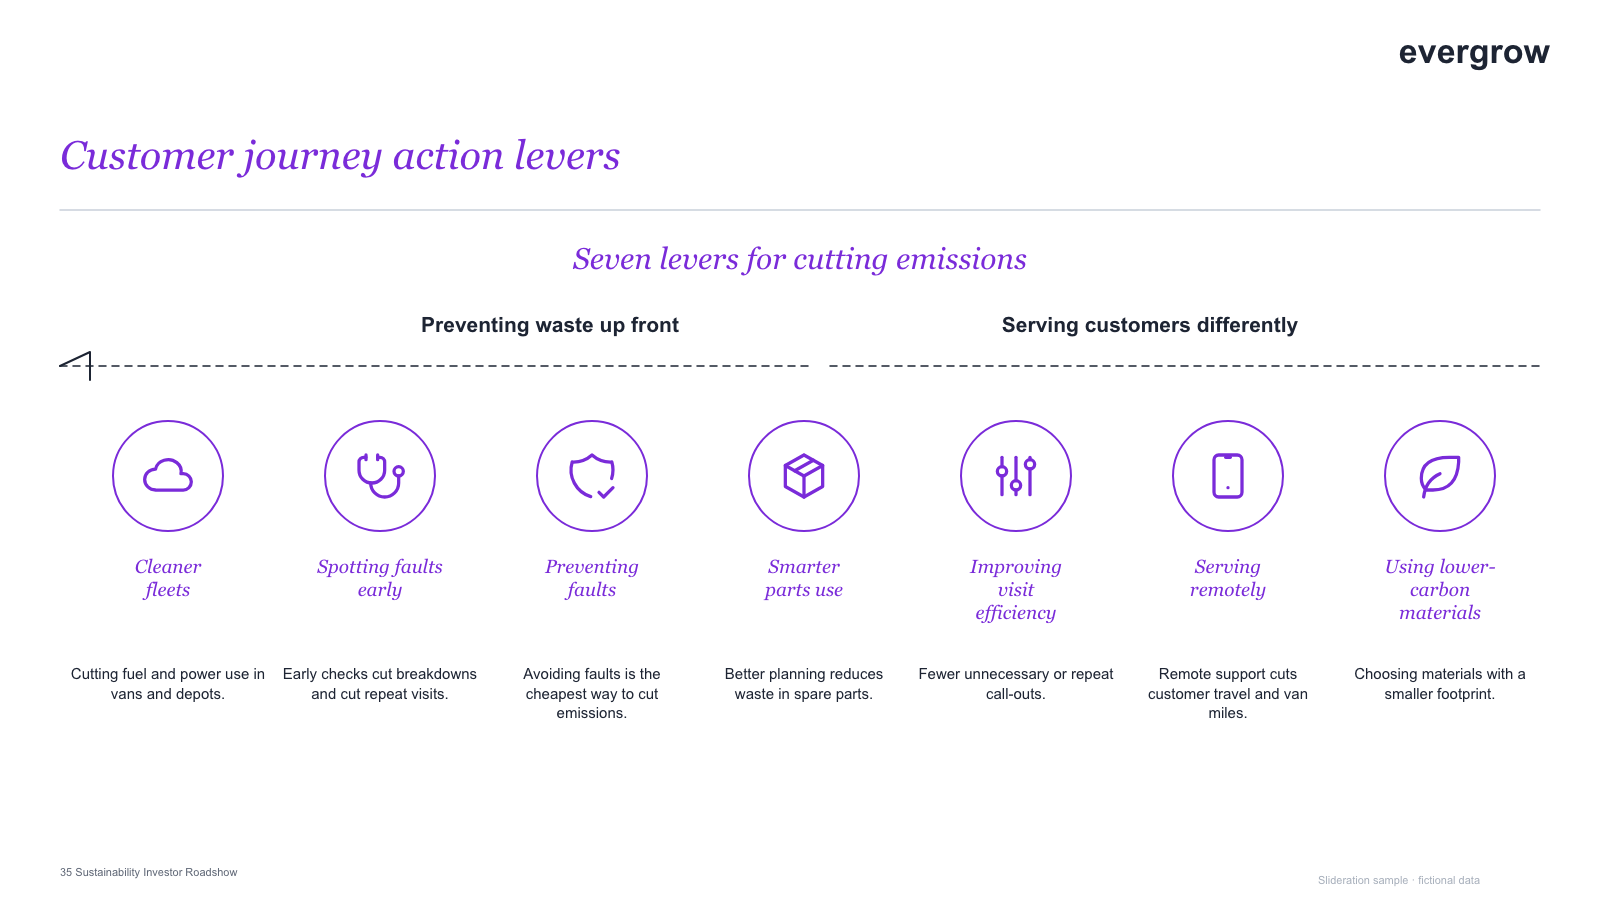
Italic headline, sub-heading with two bracketed groups and seven icon-led lever columns

Italic headline, sub-heading with two bracketed groups and seven icon-led lever columns

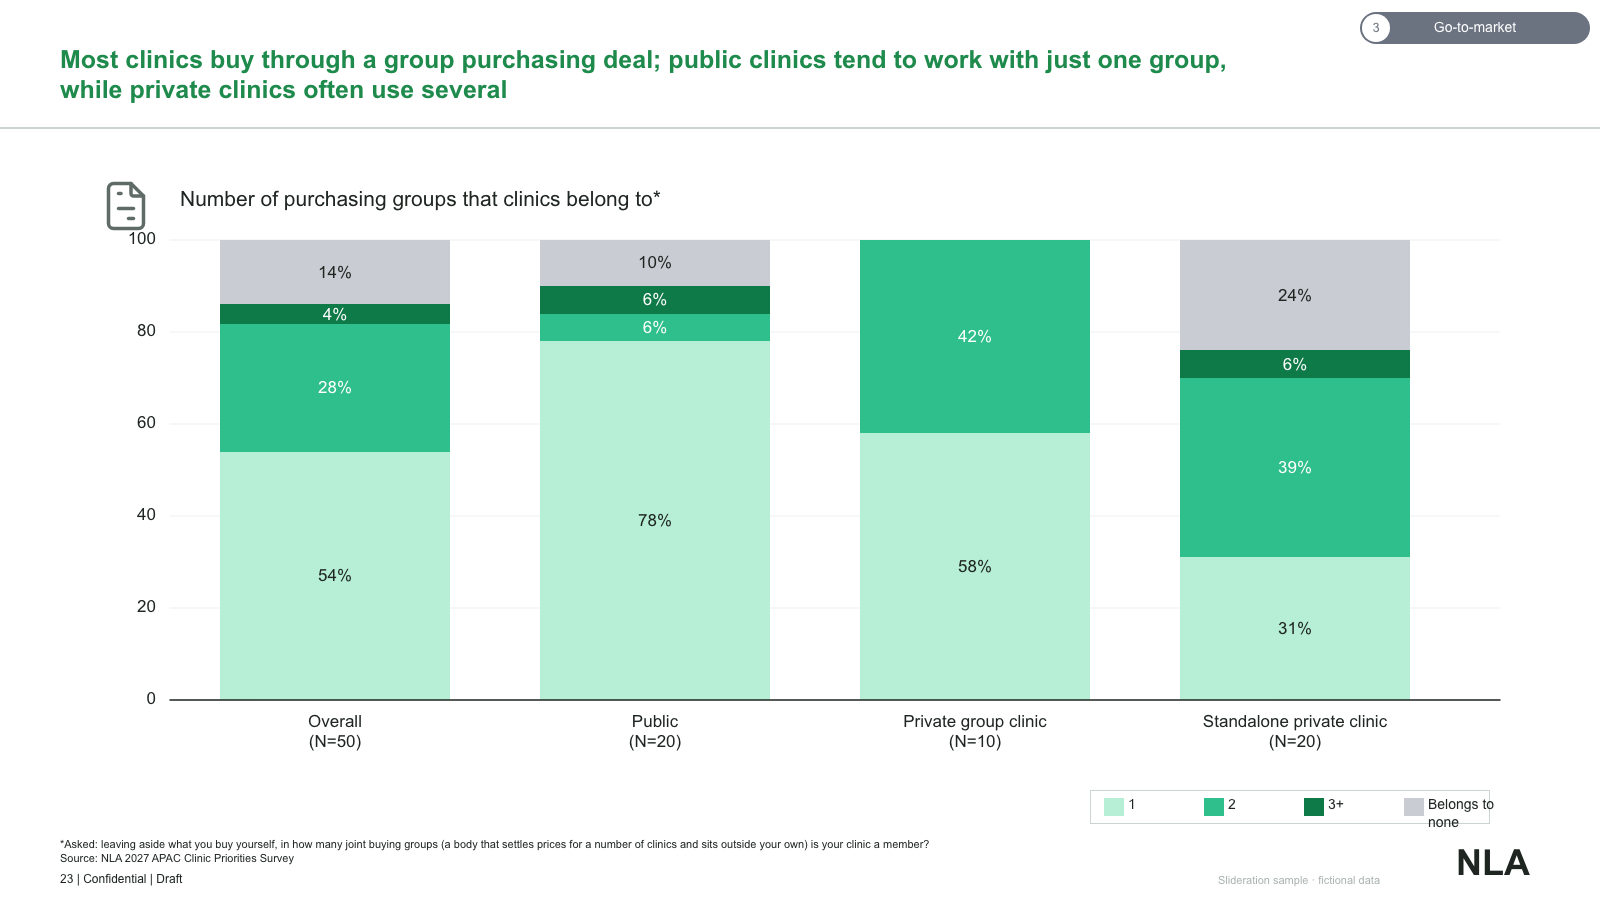
100% stacked columns by segment with percentage labels, axis ticks and a bottom legend row

100% stacked columns by segment with percentage labels, axis ticks and a bottom legend row

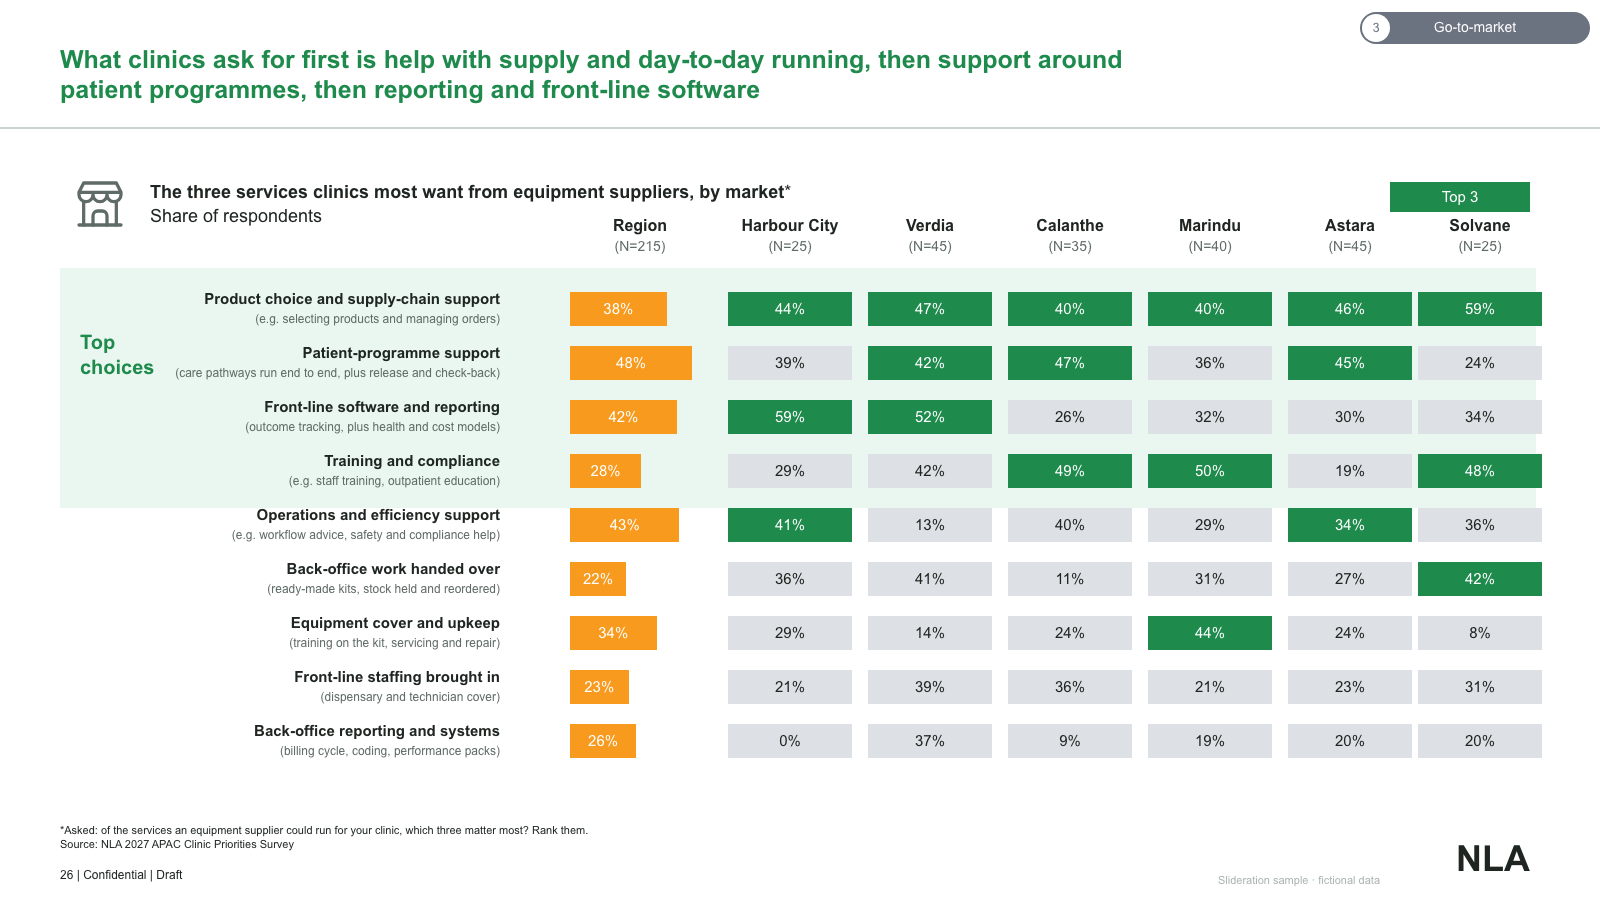
Matrix of survey values — highlighted top block with orange regional bars and per-country cells

Matrix of survey values — highlighted top block with orange regional bars and per-country cells

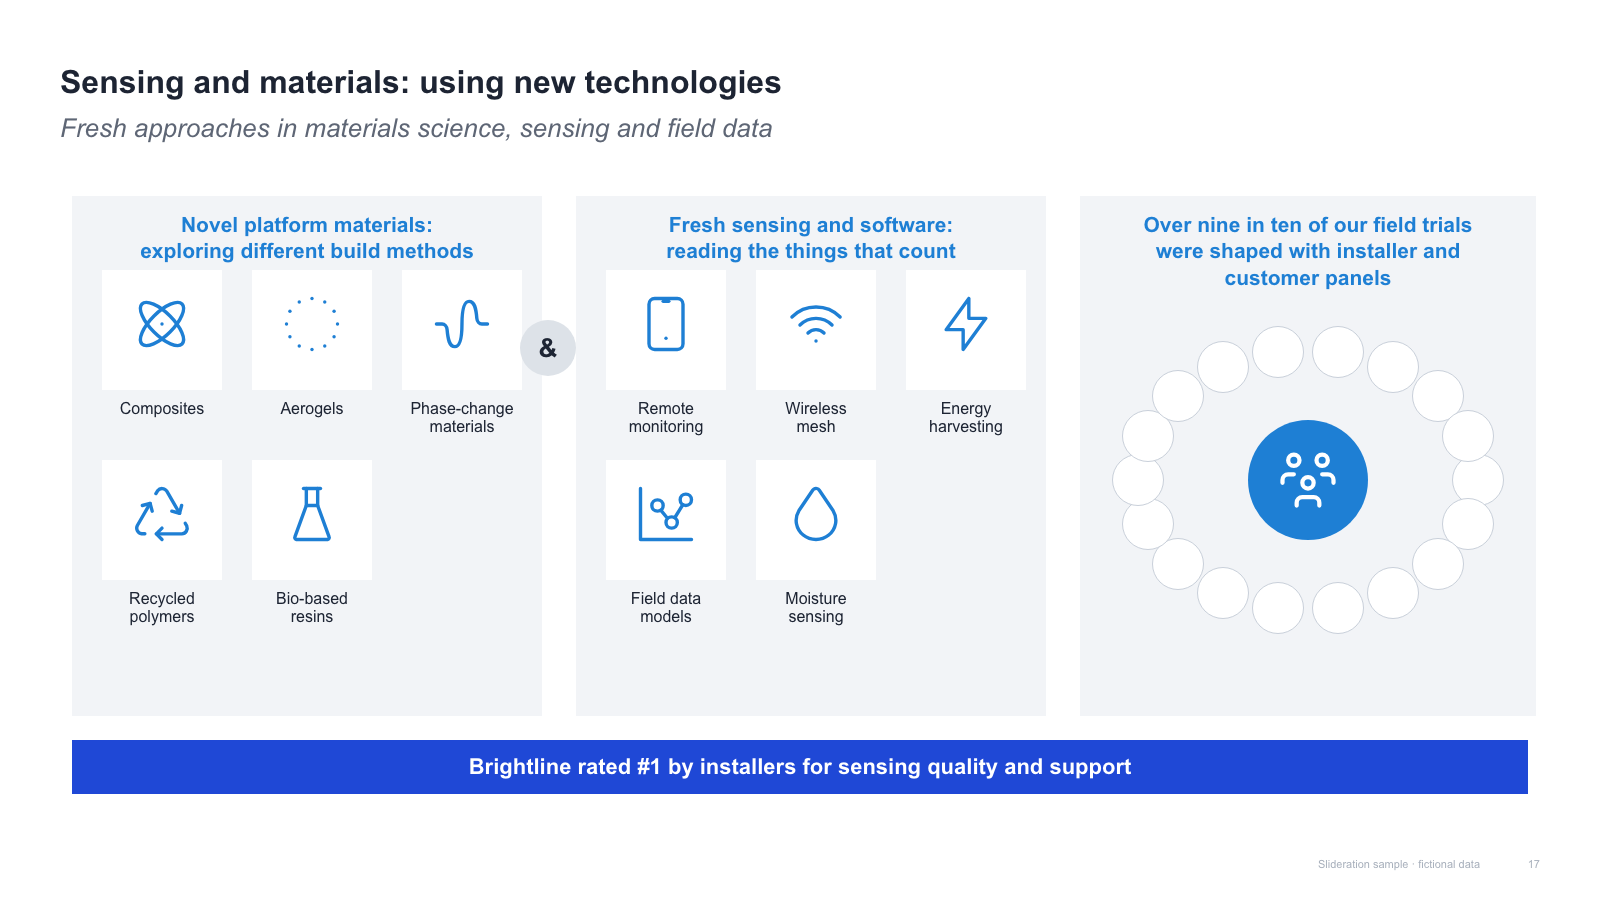
Three technology panels with icon grids, an ampersand link and a closing claim bar

Three technology panels with icon grids, an ampersand link and a closing claim bar

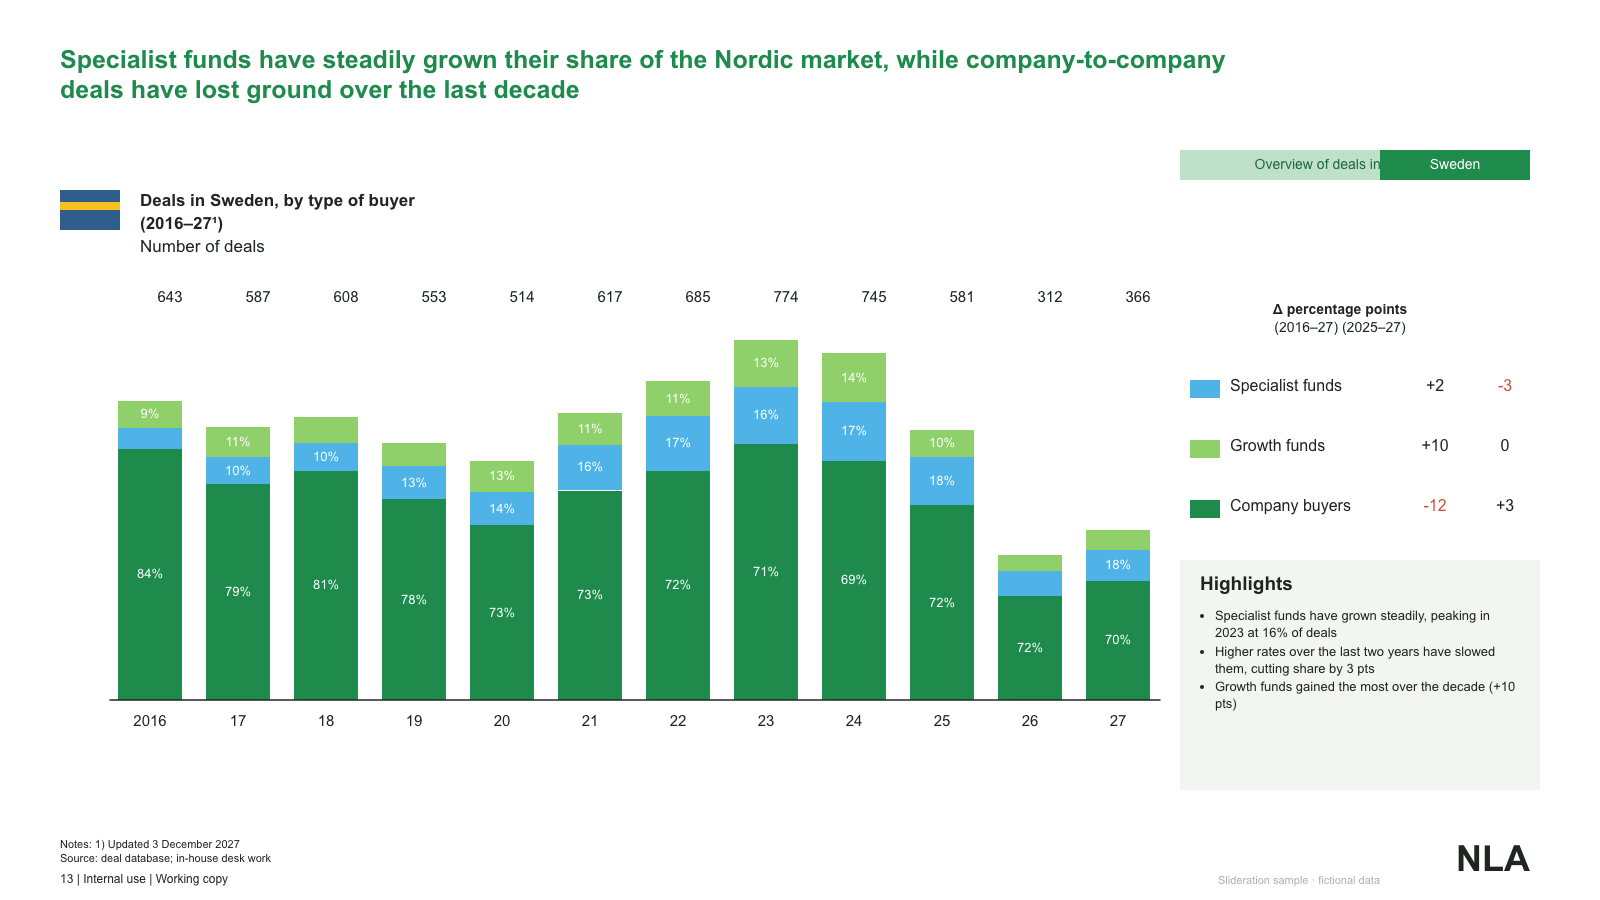
Stacked deal-mix columns by year with total labels, a delta table and a highlights panel

Stacked deal-mix columns by year with total labels, a delta table and a highlights panel

Side rail with numbered sections, two stacked charts (line and dot range) and a bullet column

Side rail with numbered sections, two stacked charts (line and dot range) and a bullet column

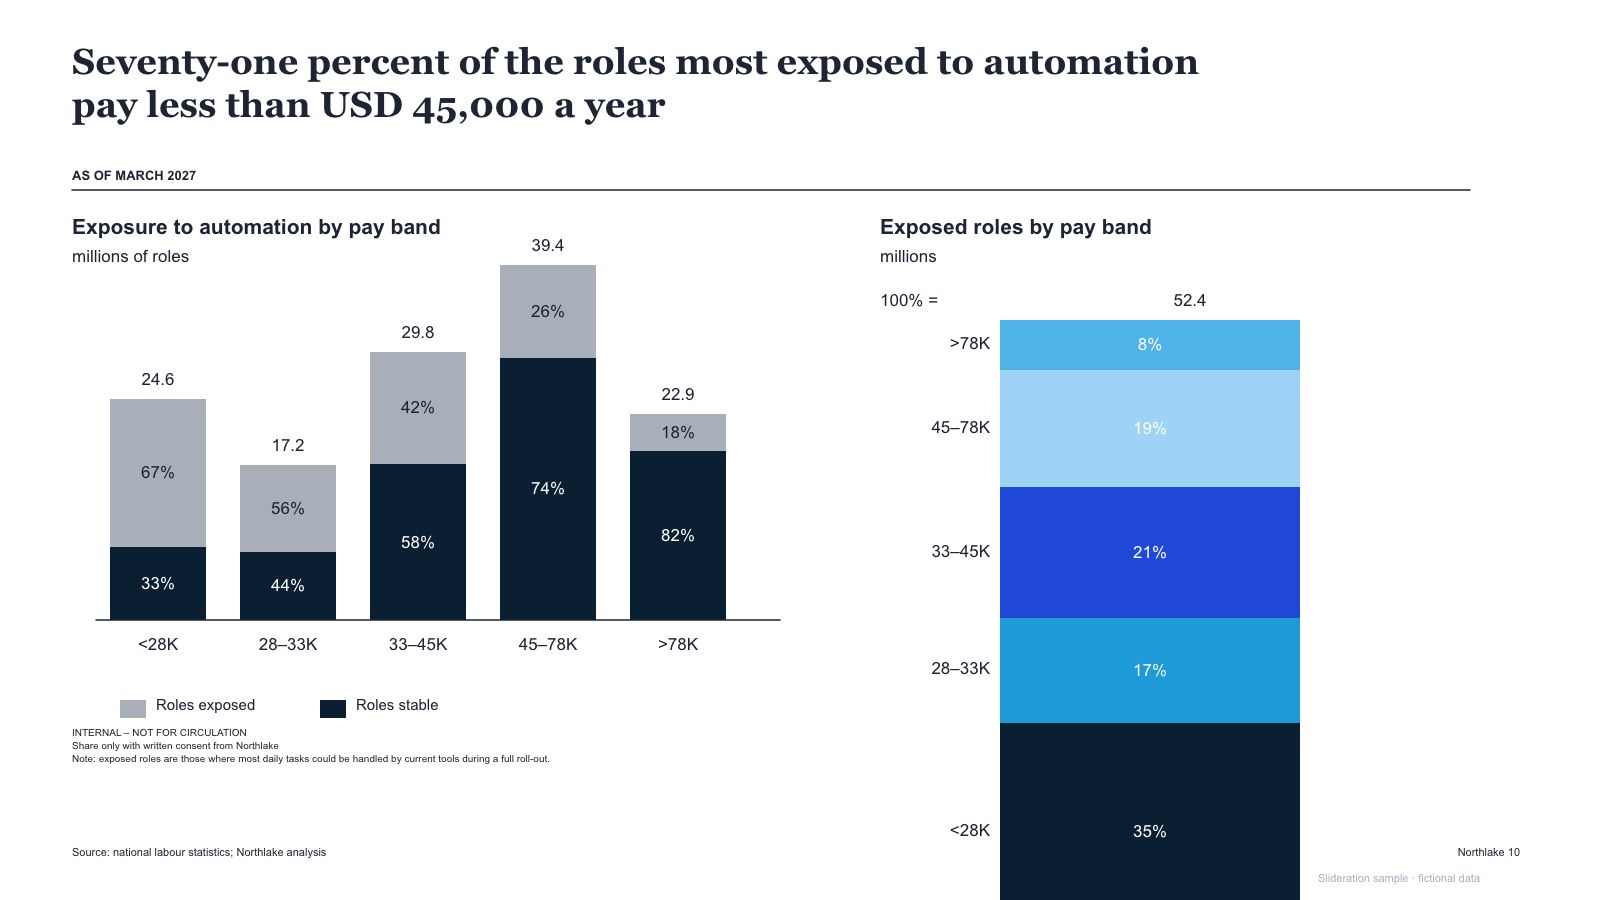
Two charts side by side — stacked share columns by band and a single 100% column with legend

Two charts side by side — stacked share columns by band and a single 100% column with legend

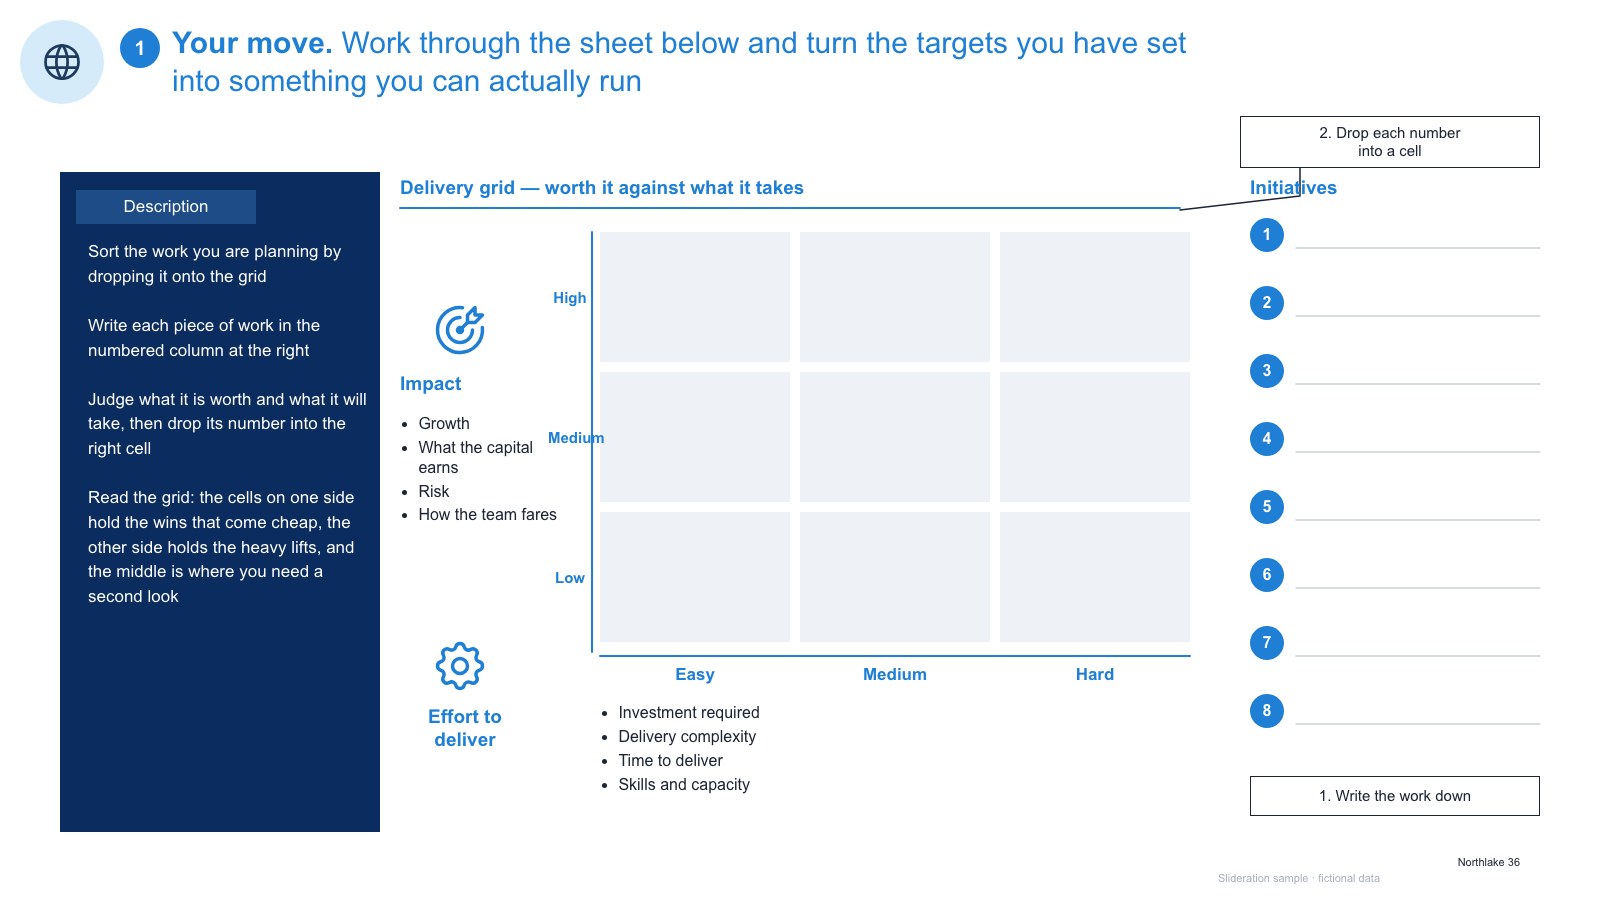
Worksheet template — instruction panel, empty 3x3 impact/effort matrix and a numbered initiative list

Worksheet template — instruction panel, empty 3x3 impact/effort matrix and a numbered initiative list

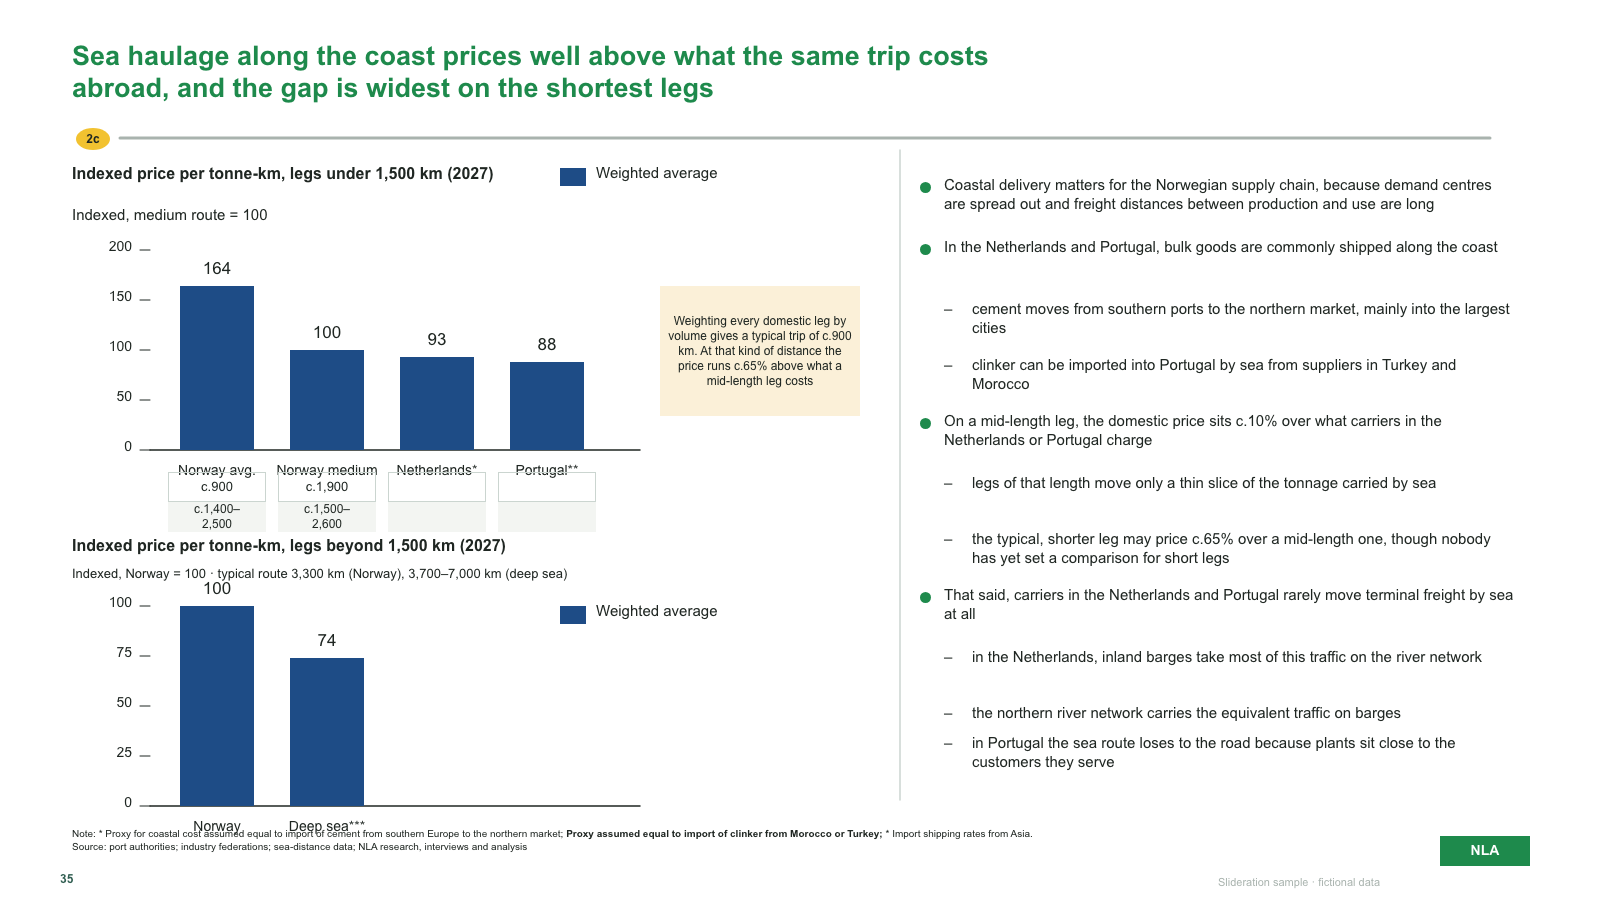
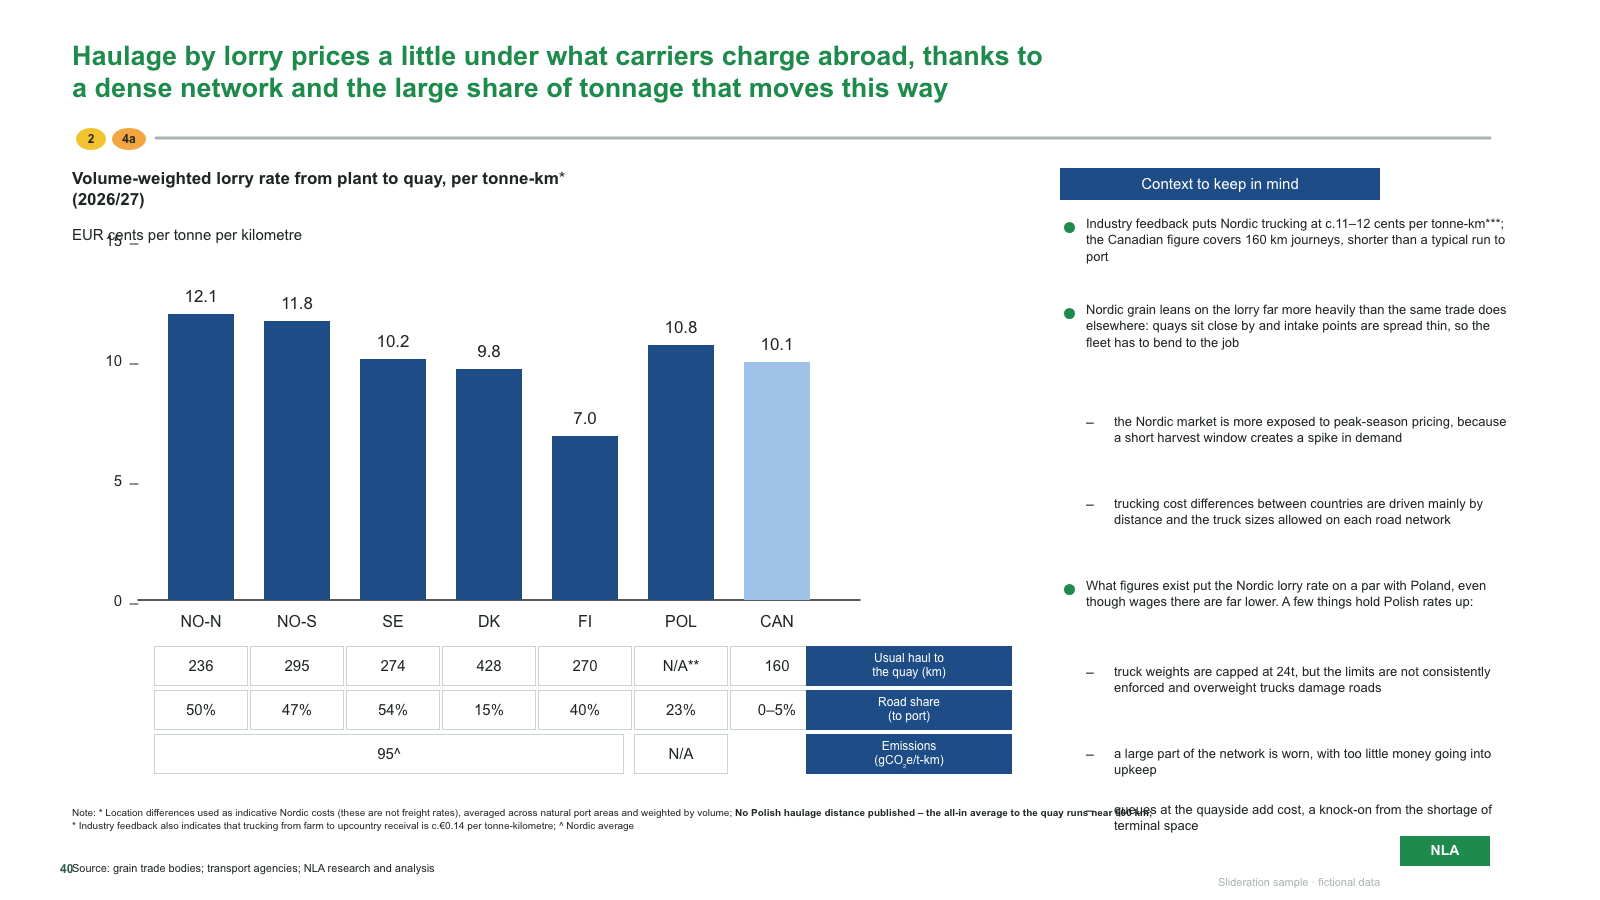
Two indexed bar charts with weighted-average legend, note callout, route tables and bullet column

Two indexed bar charts with weighted-average legend, note callout, route tables and bullet column

Split slide — serif question and statement on white, dark panel with two icon-grid groups

Split slide — serif question and statement on white, dark panel with two icon-grid groups

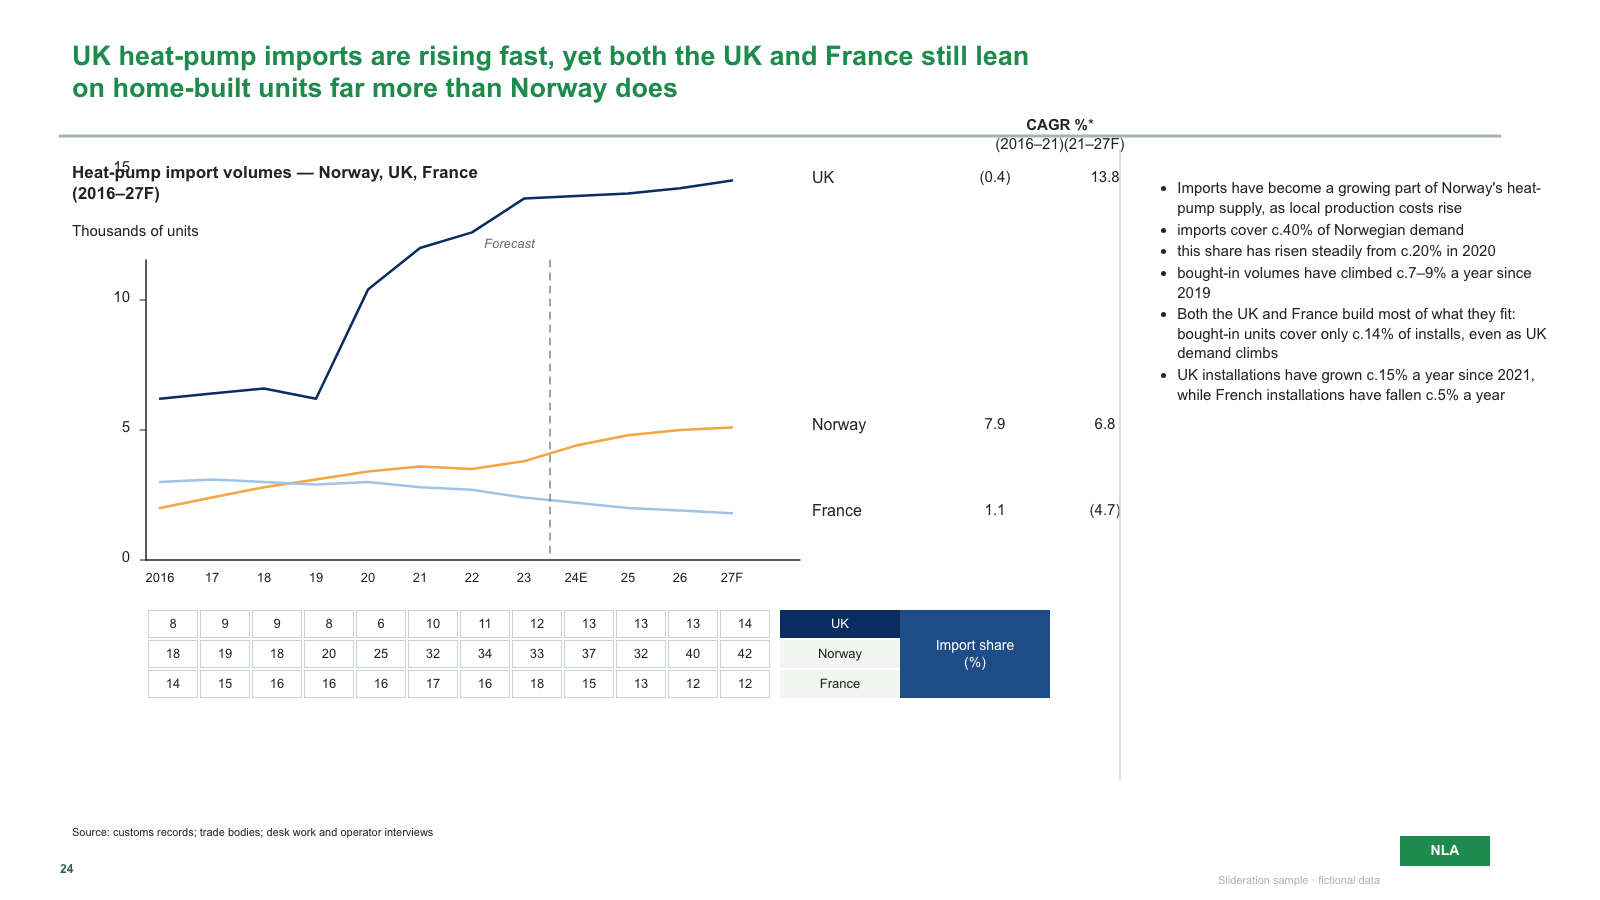
Multi-line import chart with forecast split, CAGR table, data grid and bullet commentary

Multi-line import chart with forecast split, CAGR table, data grid and bullet commentary

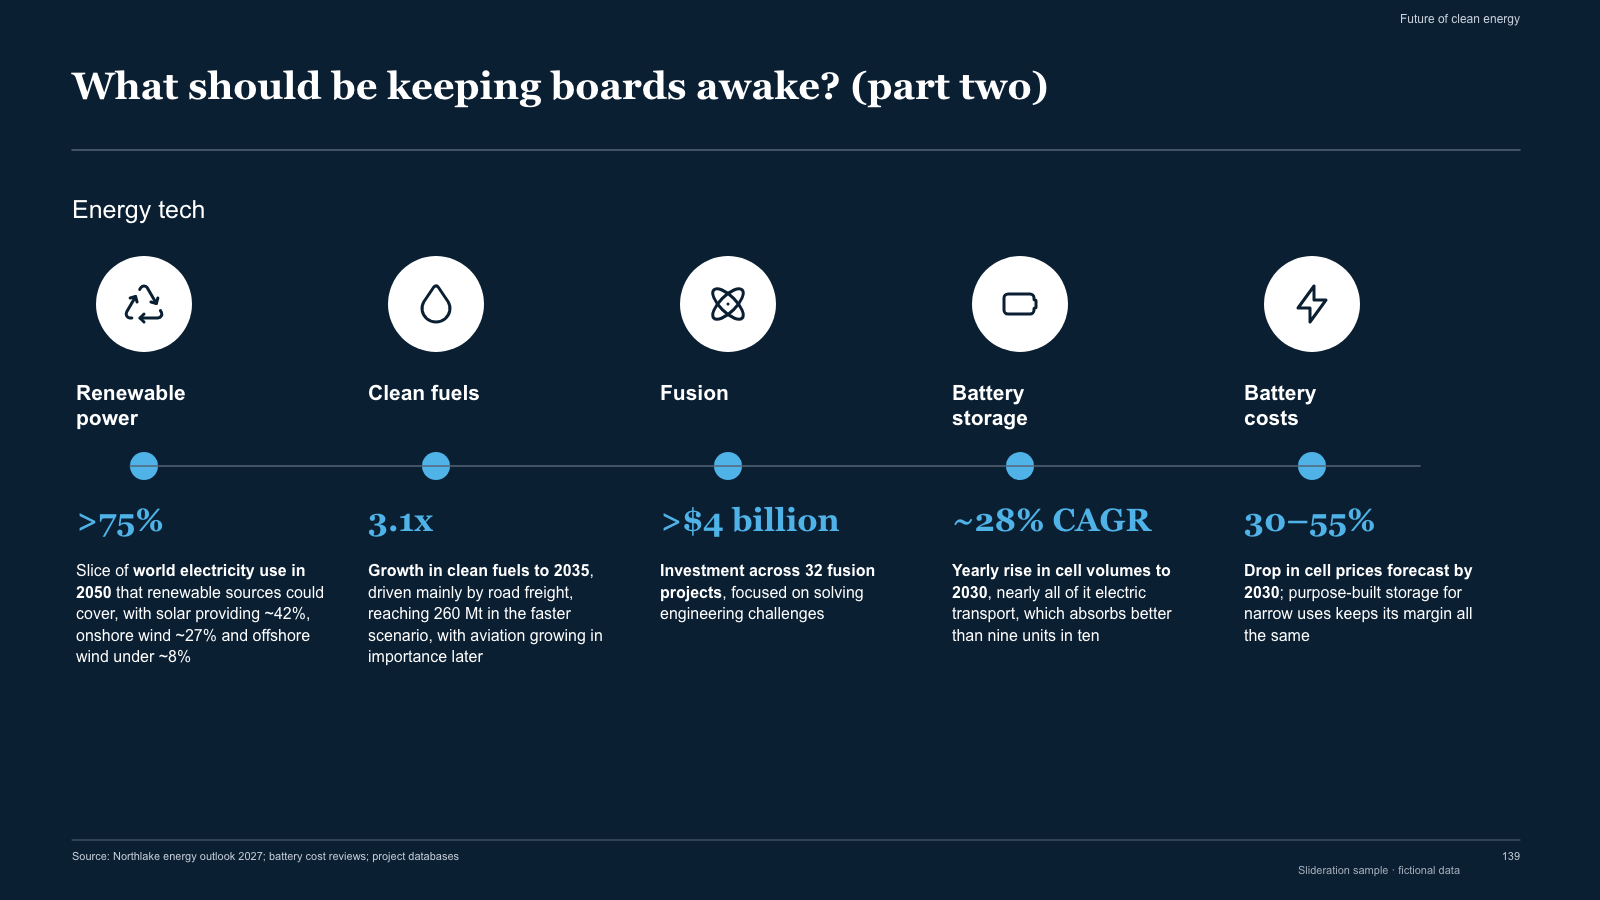
Dark stat row — five icon badges on a connector line, each with a big number and explanation

Dark stat row — five icon badges on a connector line, each with a big number and explanation

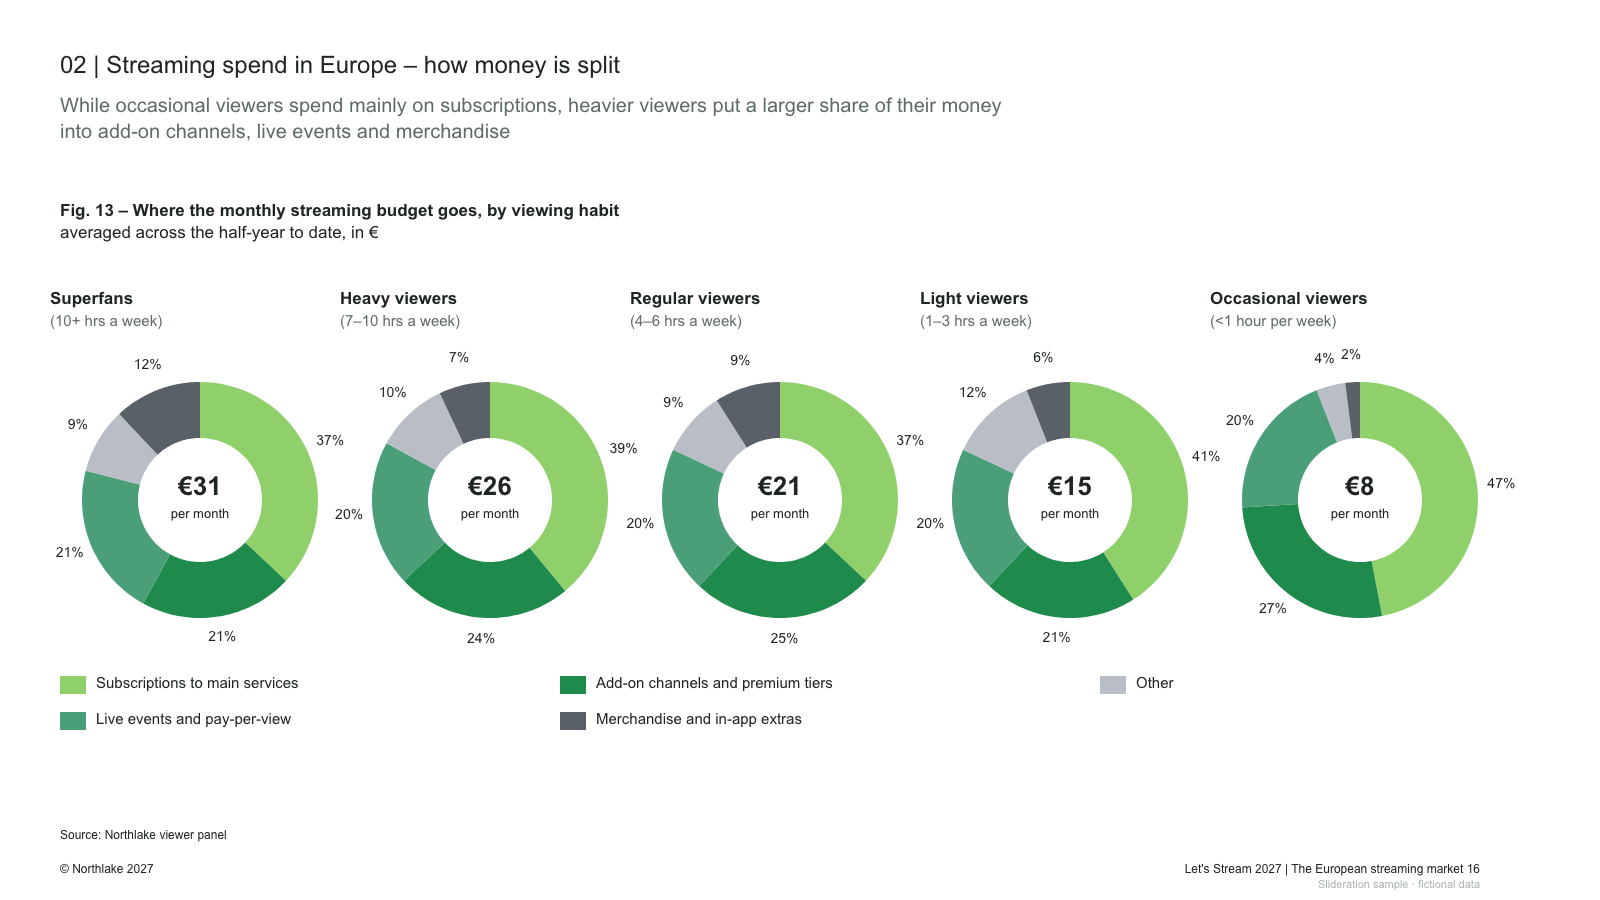
Five donut charts with centre values, segment labels and a two-row legend

Five donut charts with centre values, segment labels and a two-row legend

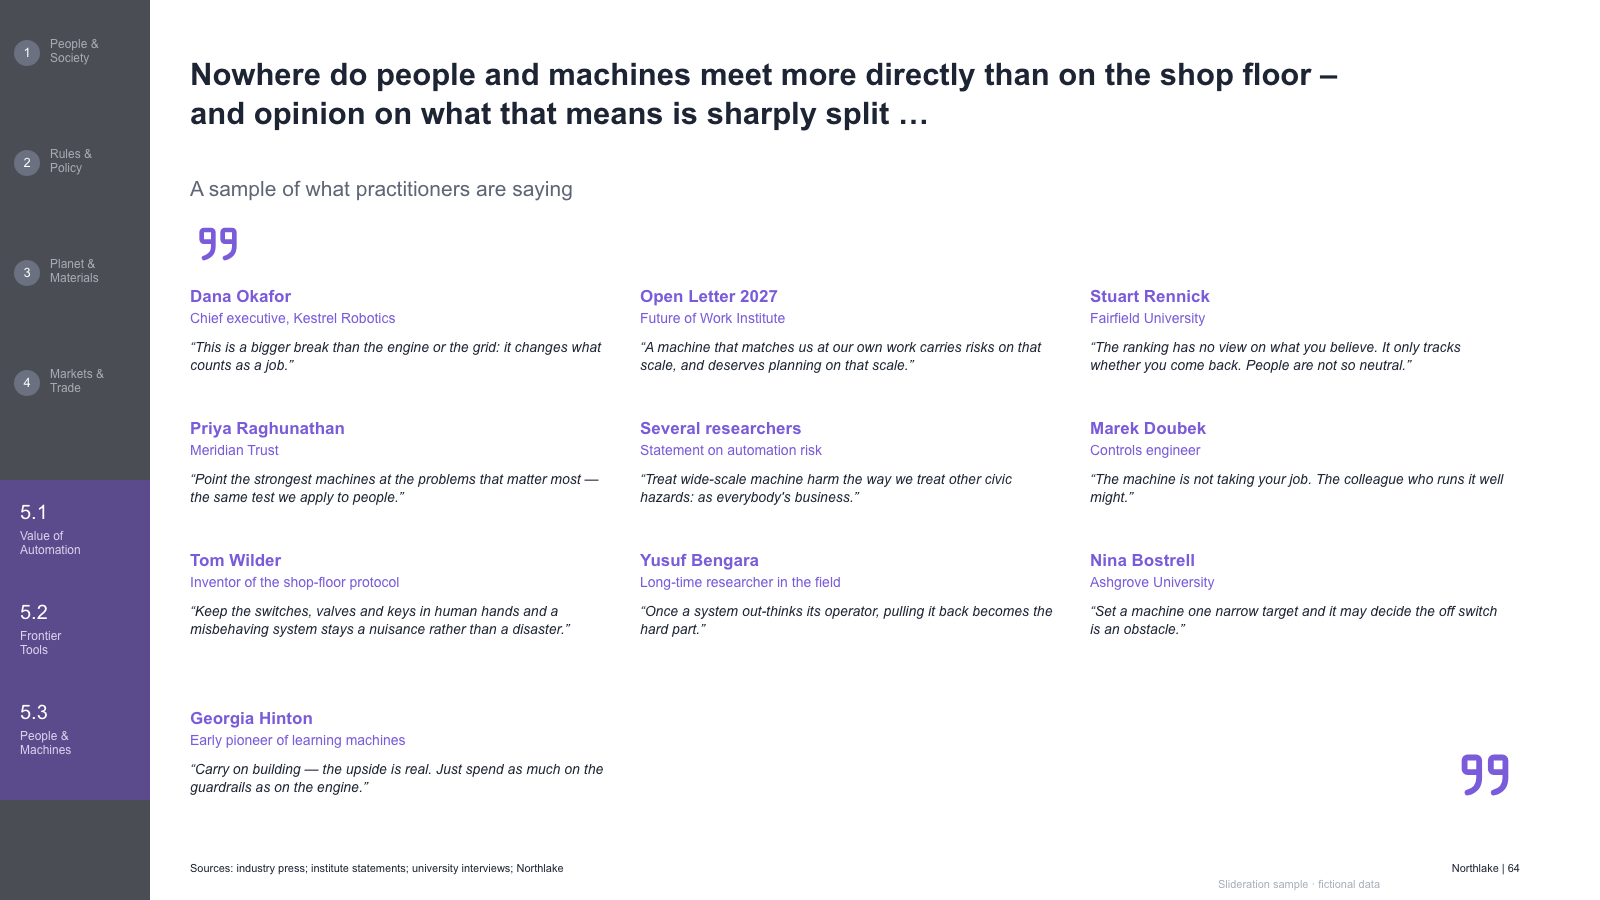
Rail of numbered sections beside three columns of attributed expert quotes with a closing mark

Rail of numbered sections beside three columns of attributed expert quotes with a closing mark

Bar chart with speech-bubble callouts, a three-row data table and a boxed considerations column

Bar chart with speech-bubble callouts, a three-row data table and a boxed considerations column

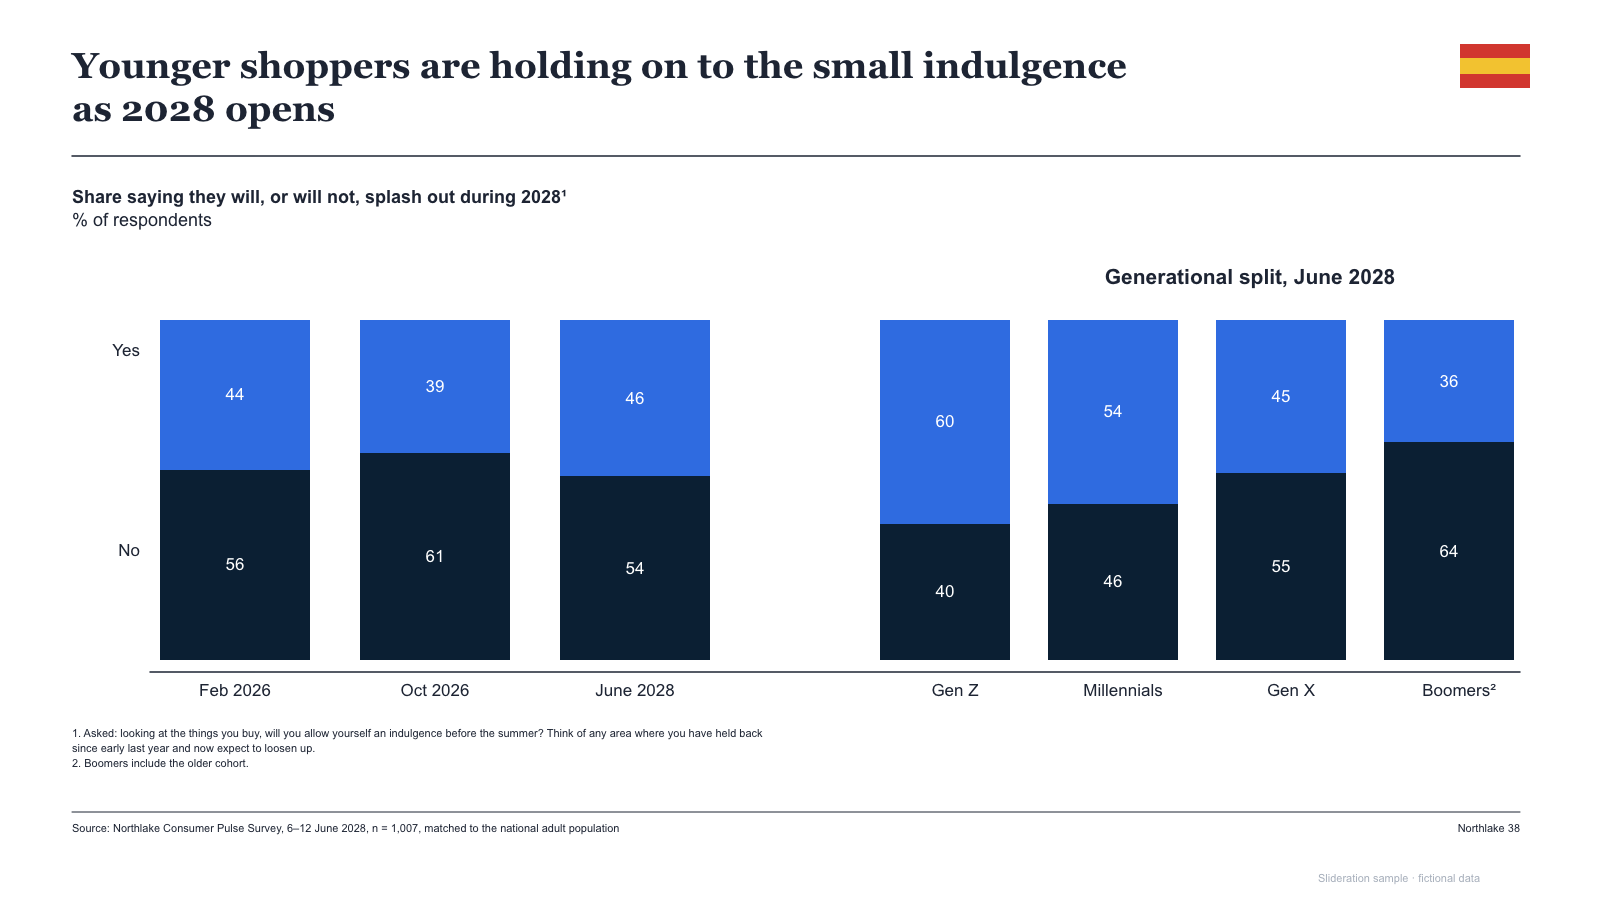
Two grouped 100% column sets (time series and cohorts) with yes/no rows and a flag marker

Two grouped 100% column sets (time series and cohorts) with yes/no rows and a flag marker

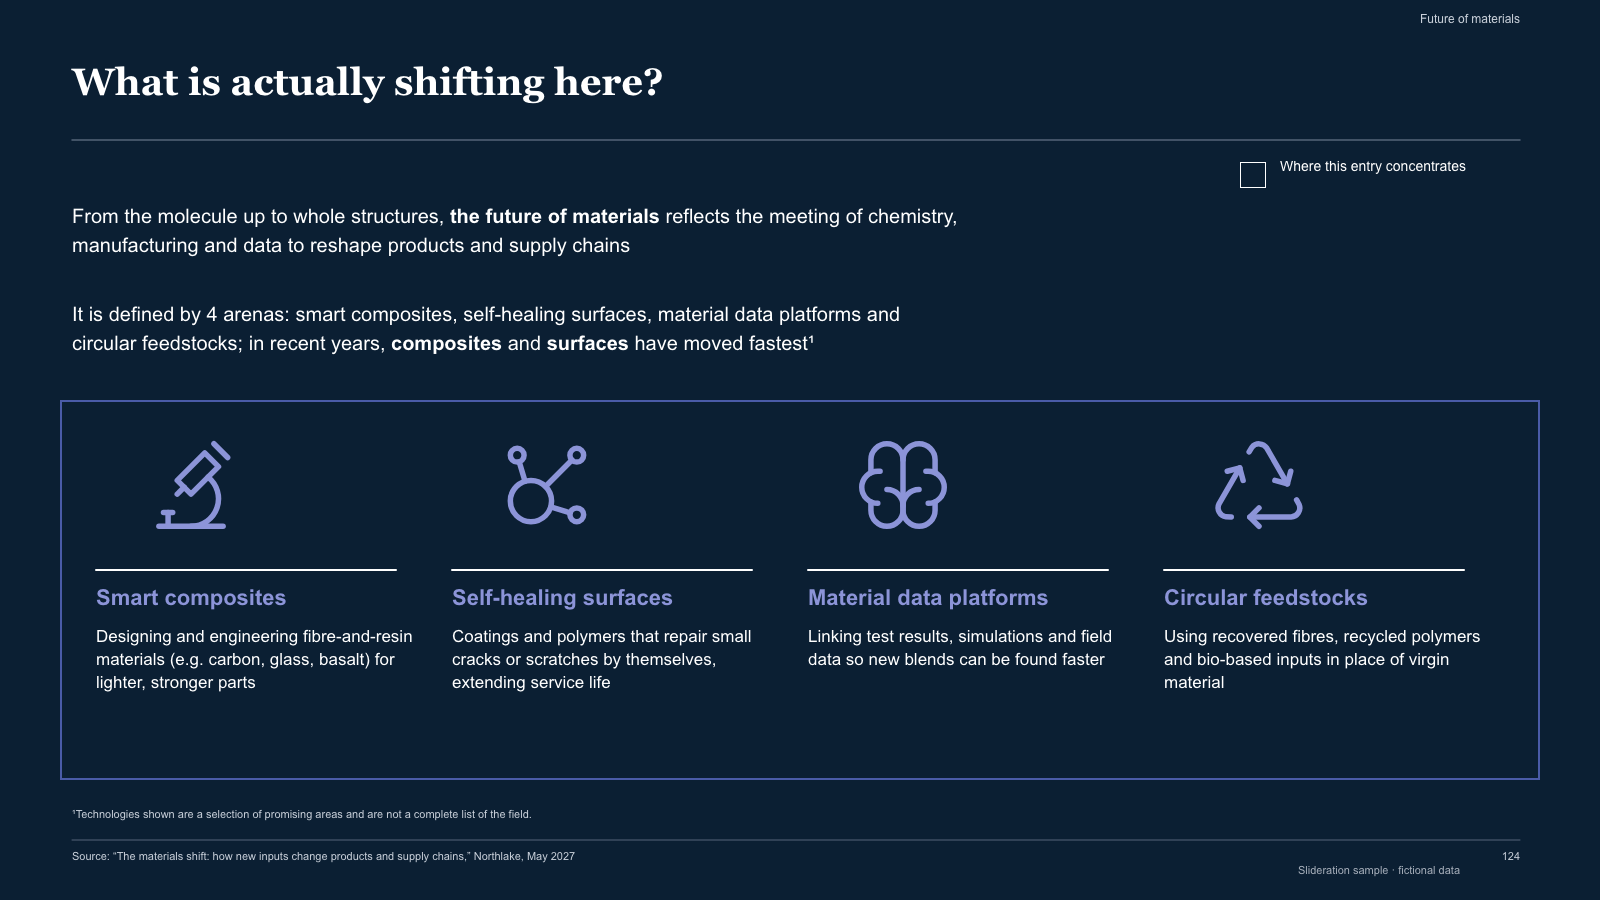
Dark definition slide — intro paragraphs and an outlined panel of four icon-led arena columns

Dark definition slide — intro paragraphs and an outlined panel of four icon-led arena columns

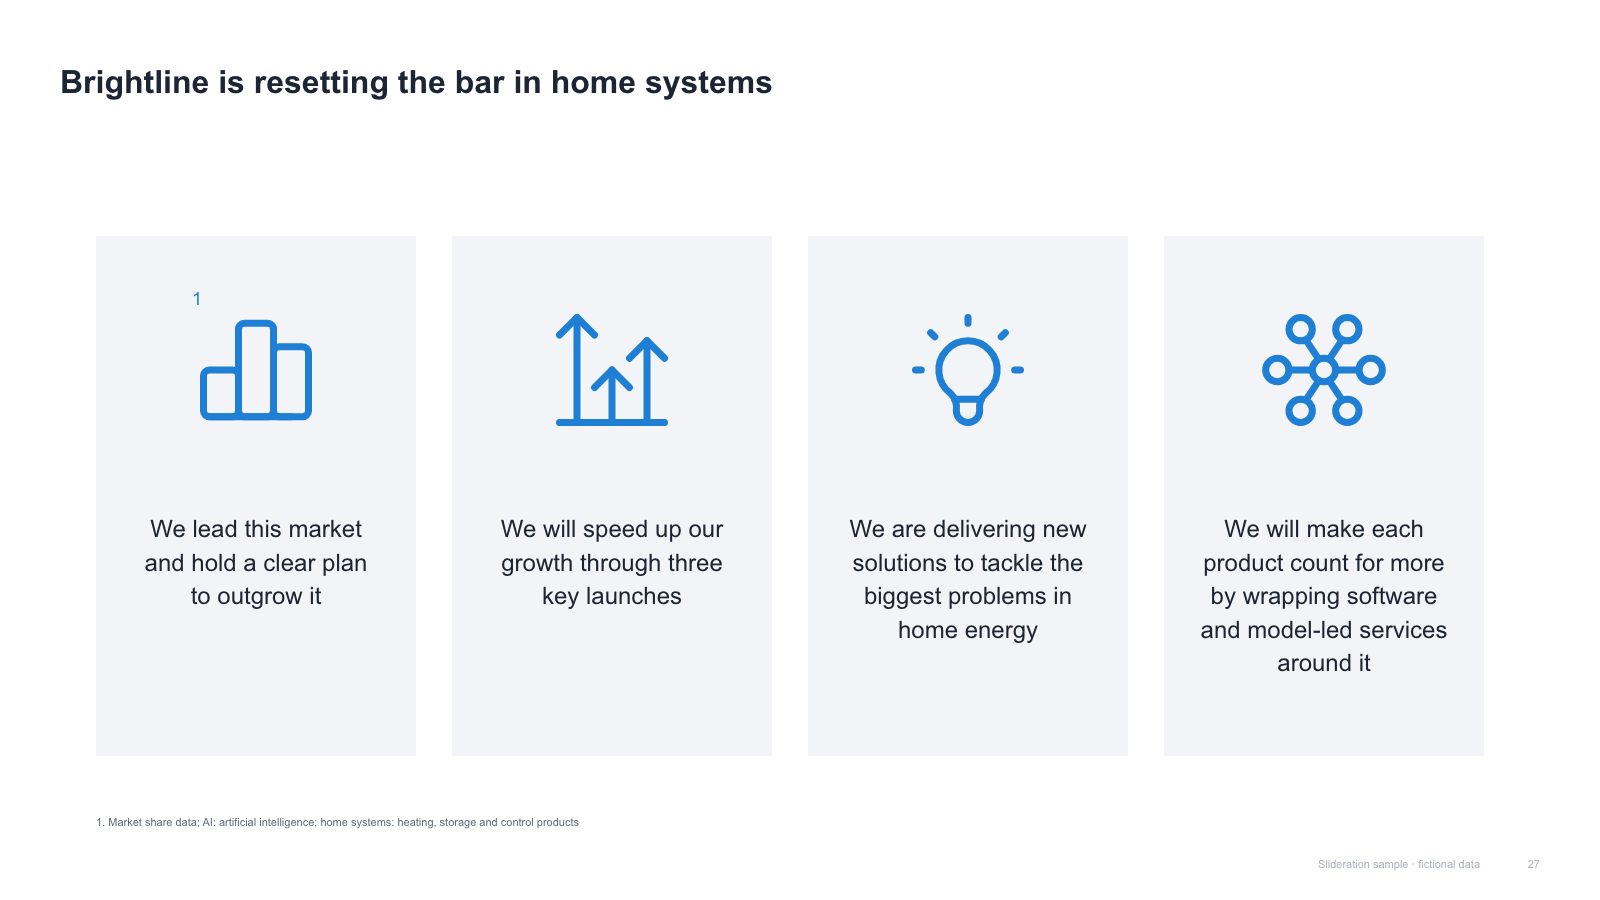
Four claim cards, each a light panel with a large line icon and centred sentence

Four claim cards, each a light panel with a large line icon and centred sentence

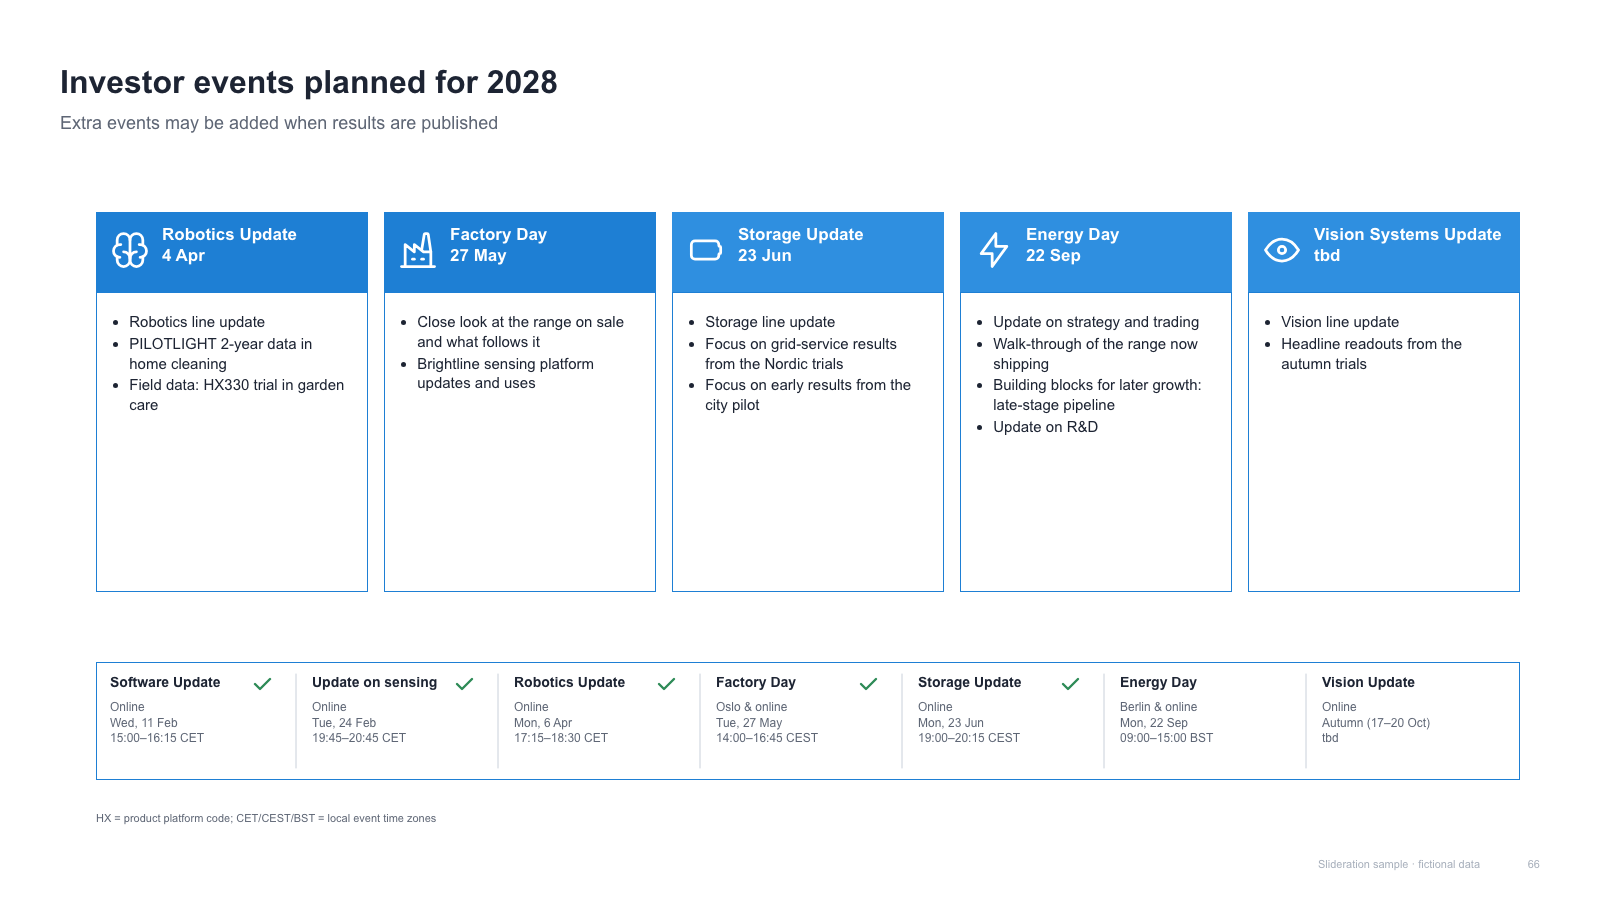
Five event cards over a timeline strip of confirmed dates with tick marks

Five event cards over a timeline strip of confirmed dates with tick marks

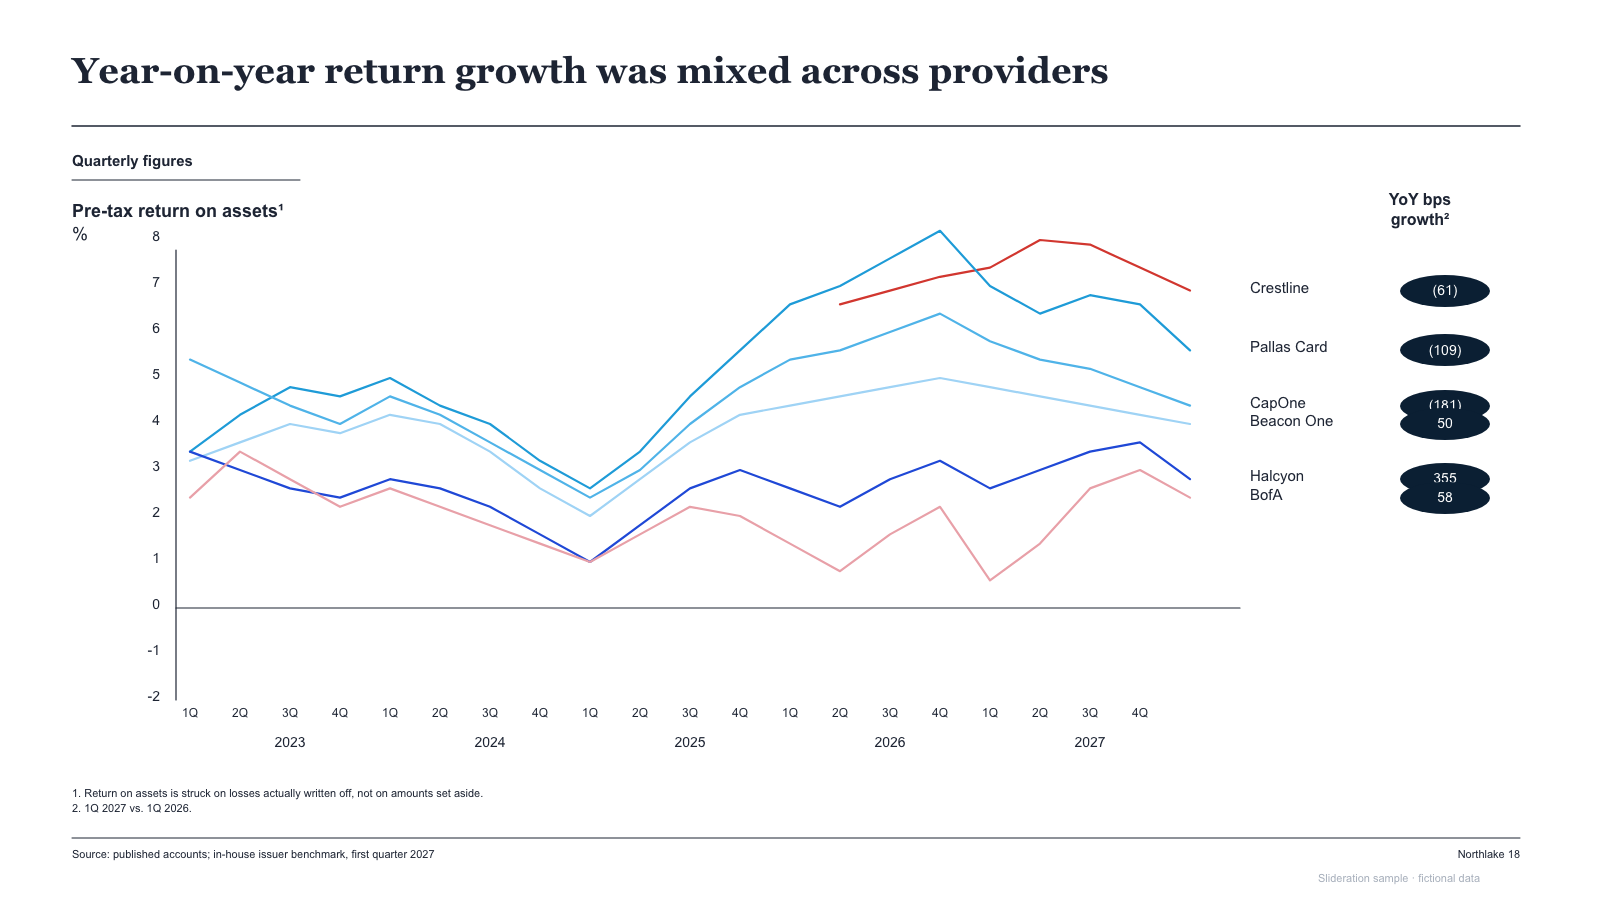
Multi-series quarterly line chart with right-hand series labels and pill-shaped change markers

Multi-series quarterly line chart with right-hand series labels and pill-shaped change markers

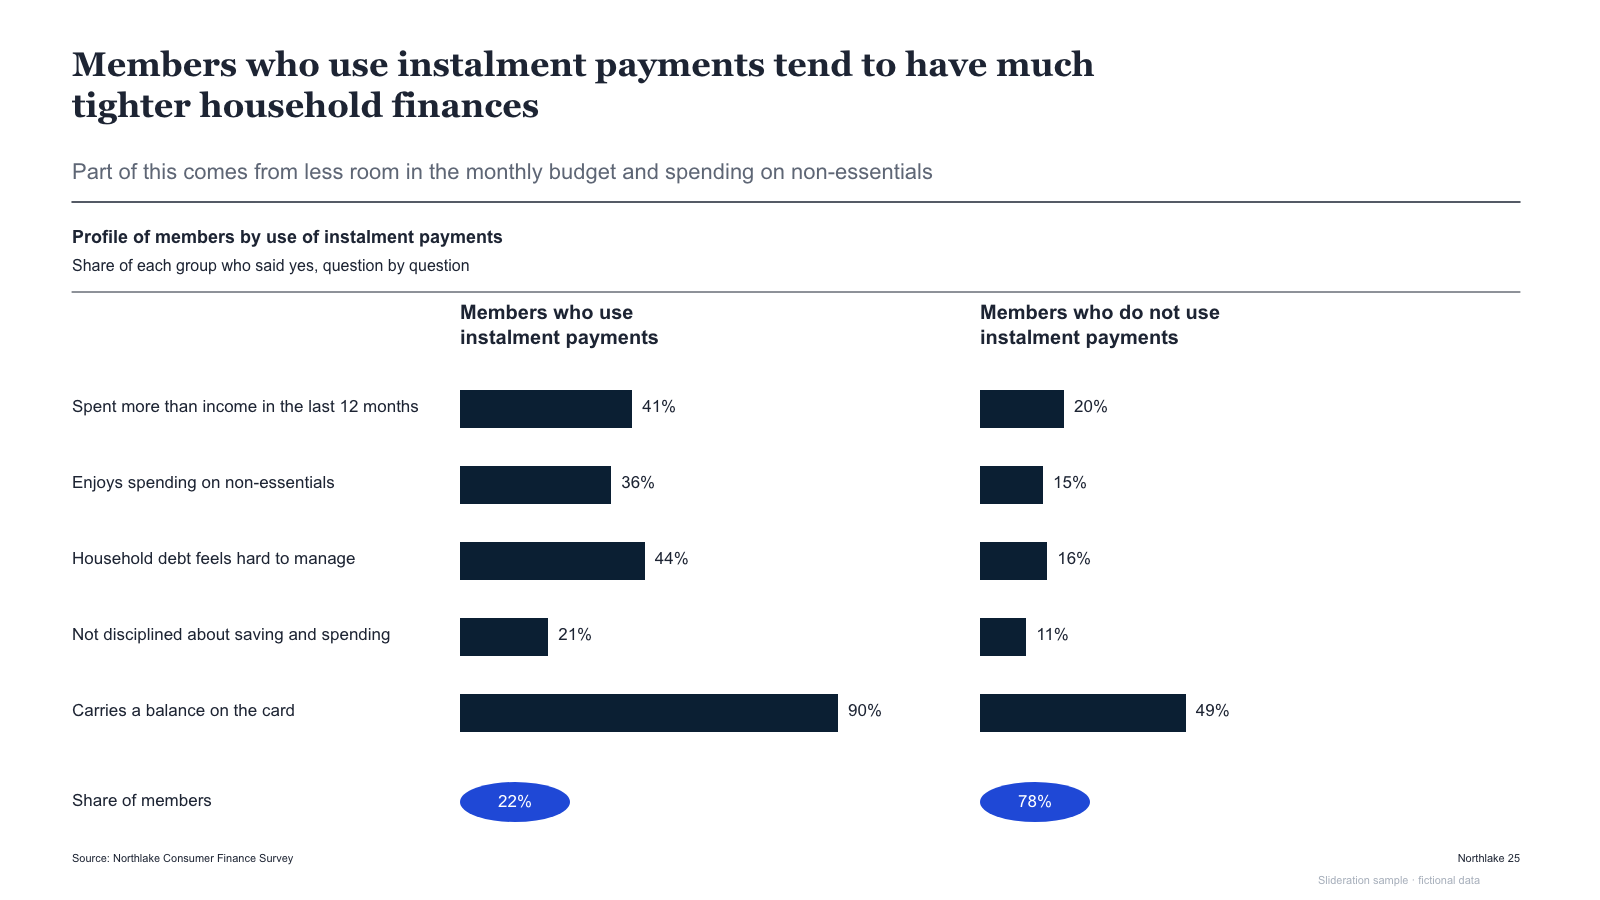
Paired horizontal bar panels comparing two customer groups, with share pills below

Paired horizontal bar panels comparing two customer groups, with share pills below

Three-segment ring with a filled core, curved arrows and four leader-line notes

Three-segment ring with a filled core, curved arrows and four leader-line notes

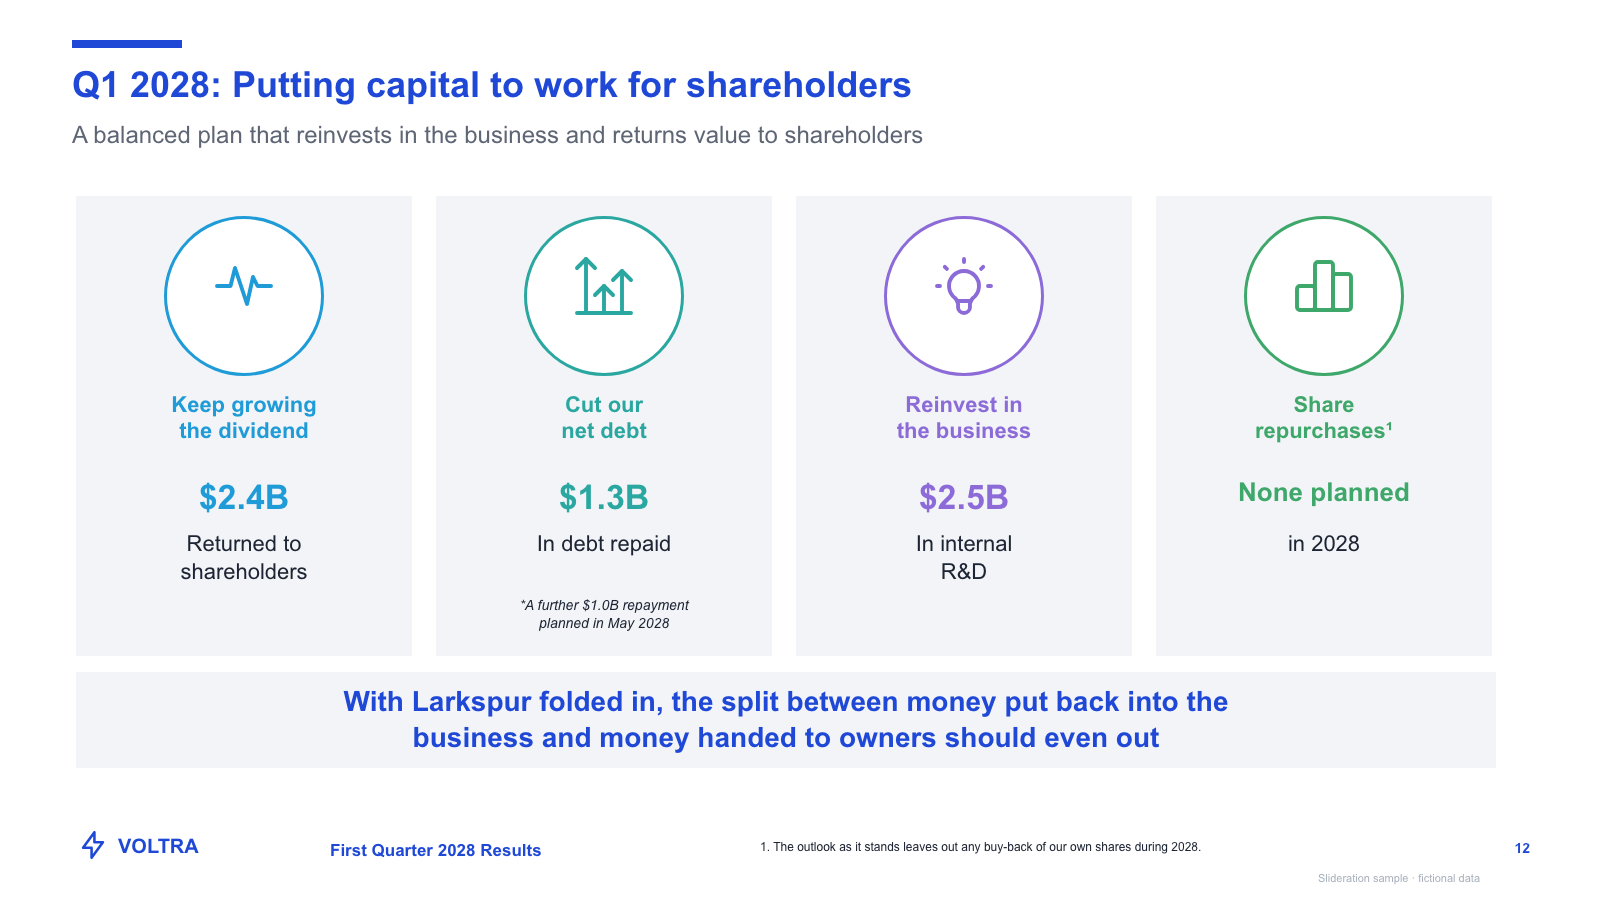
Four ringed icon cards with headline figures, a conclusion band and brand footer

Four ringed icon cards with headline figures, a conclusion band and brand footer

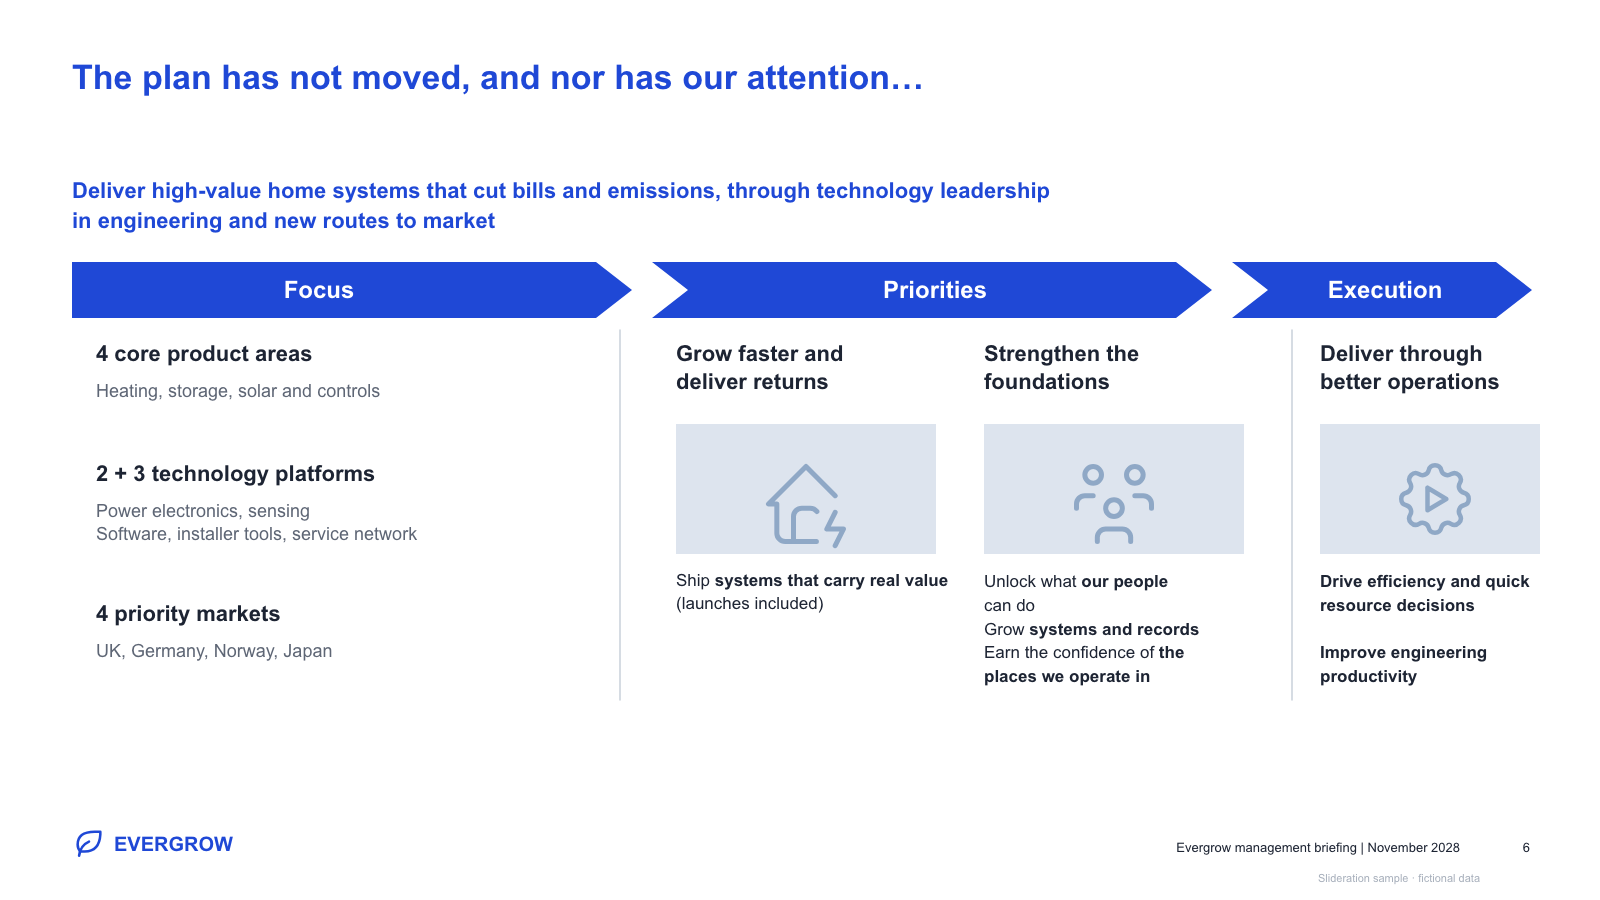
Three chevron headers over aligned content columns with sub-blocks and image placeholders

Three chevron headers over aligned content columns with sub-blocks and image placeholders

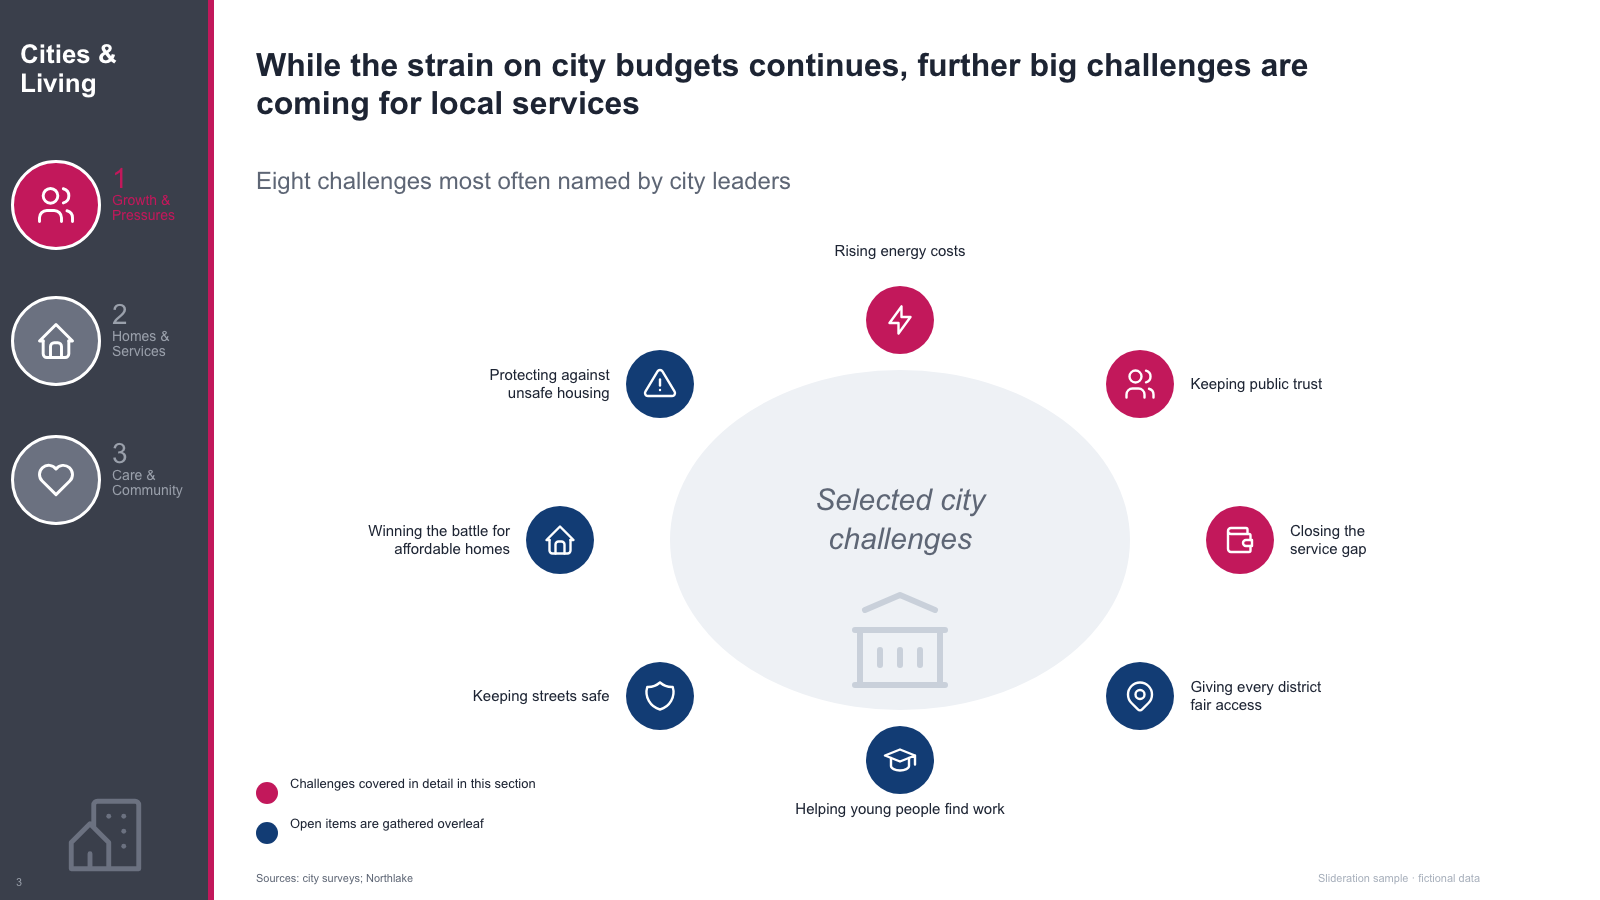
Side rail plus a ring of labelled icon nodes around a central emblem, with a two-colour legend

Side rail plus a ring of labelled icon nodes around a central emblem, with a two-colour legend

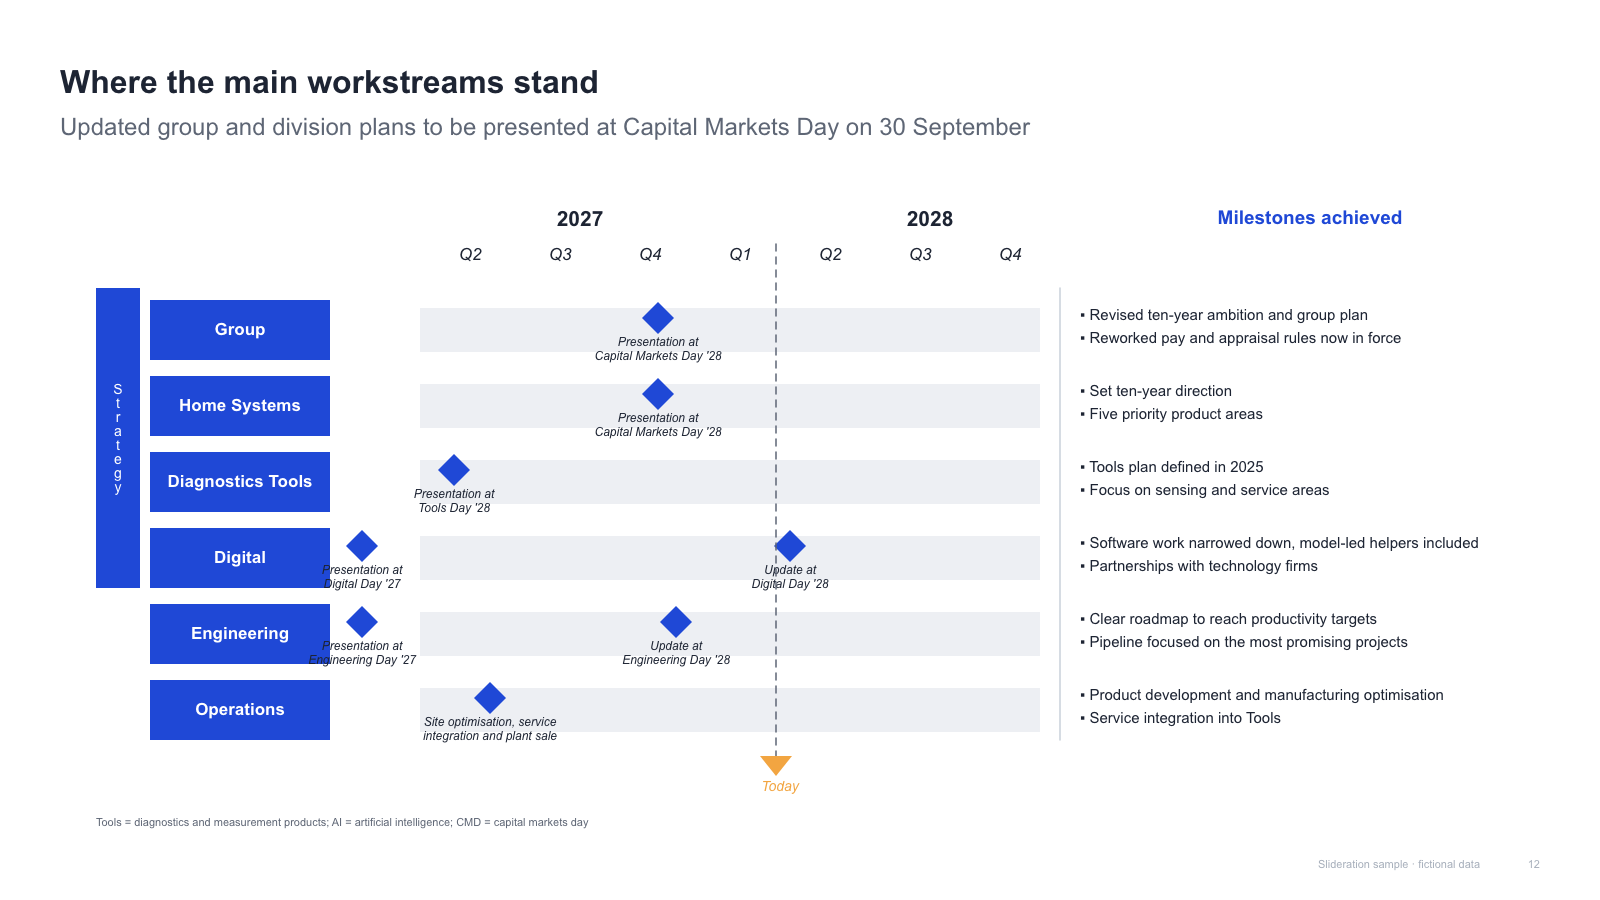
Strategy timeline — row labels, quarter grid, milestone diamonds on tracks and an achievements column

Strategy timeline — row labels, quarter grid, milestone diamonds on tracks and an achievements column

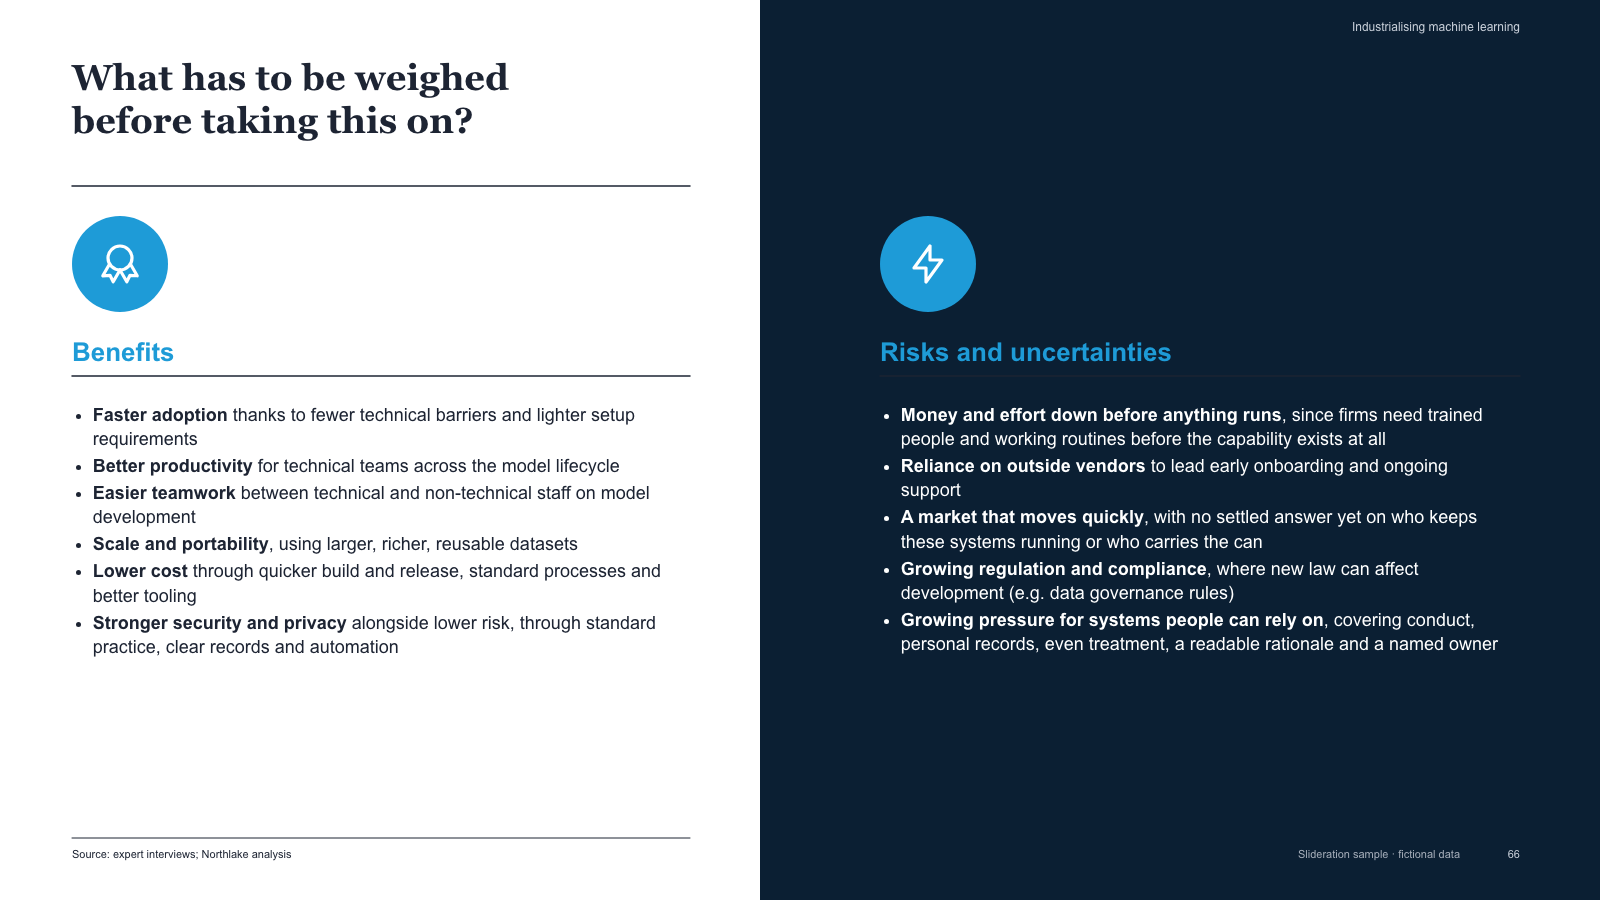
Split benefits / risks slide with icon badges and two long bullet columns

Split benefits / risks slide with icon badges and two long bullet columns

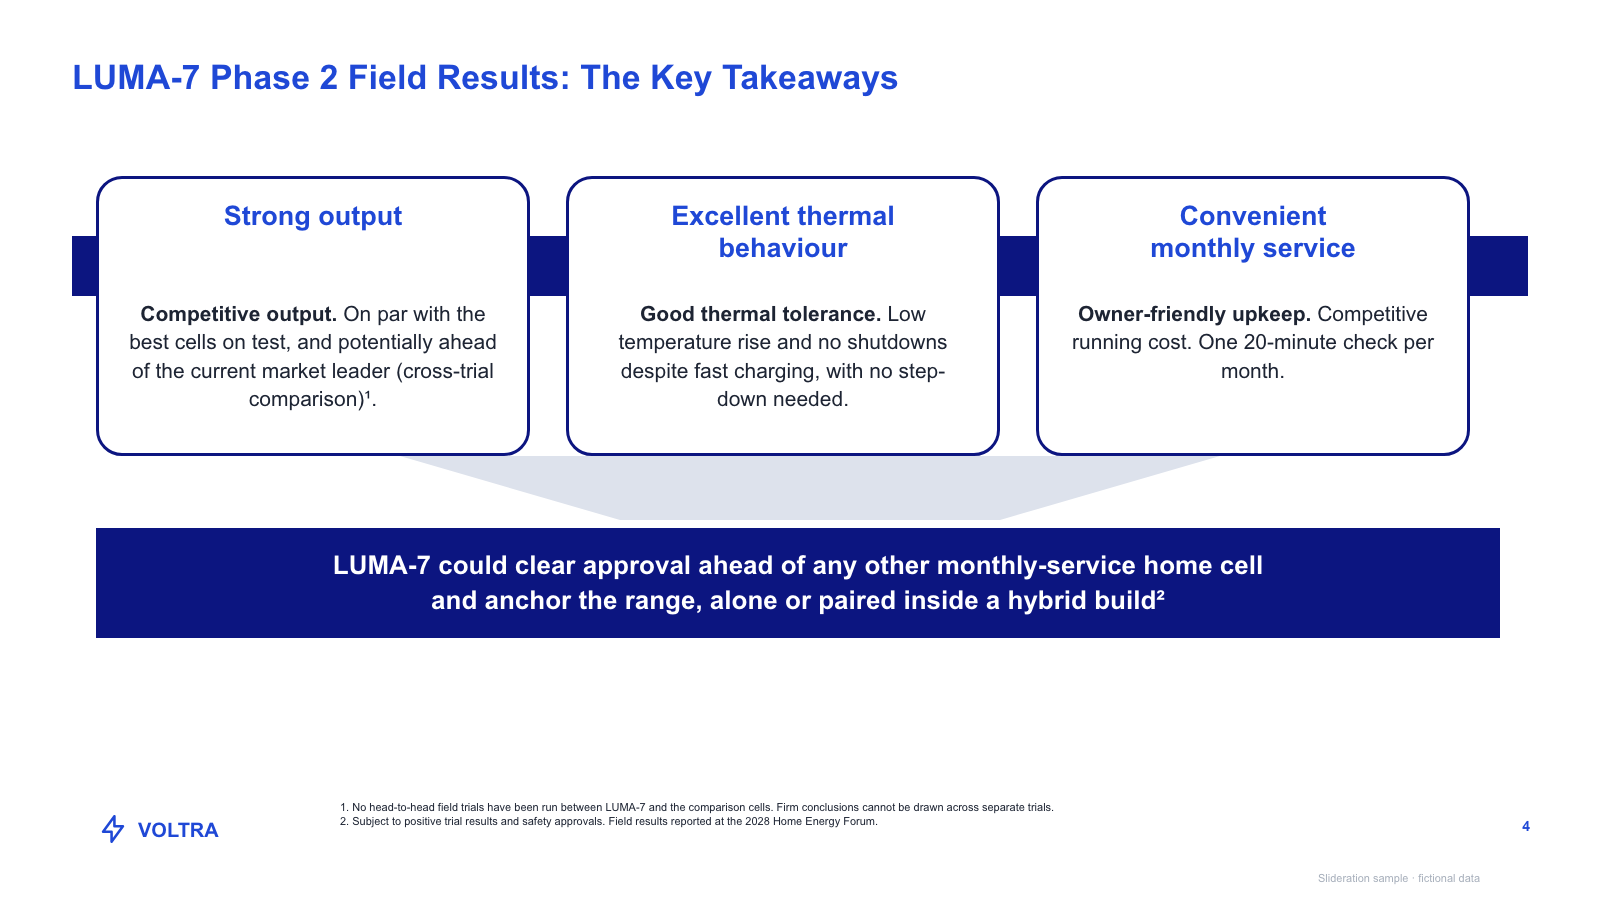
Three rounded claim cards on a coloured band with a wedge connector and a conclusion bar

Three rounded claim cards on a coloured band with a wedge connector and a conclusion bar

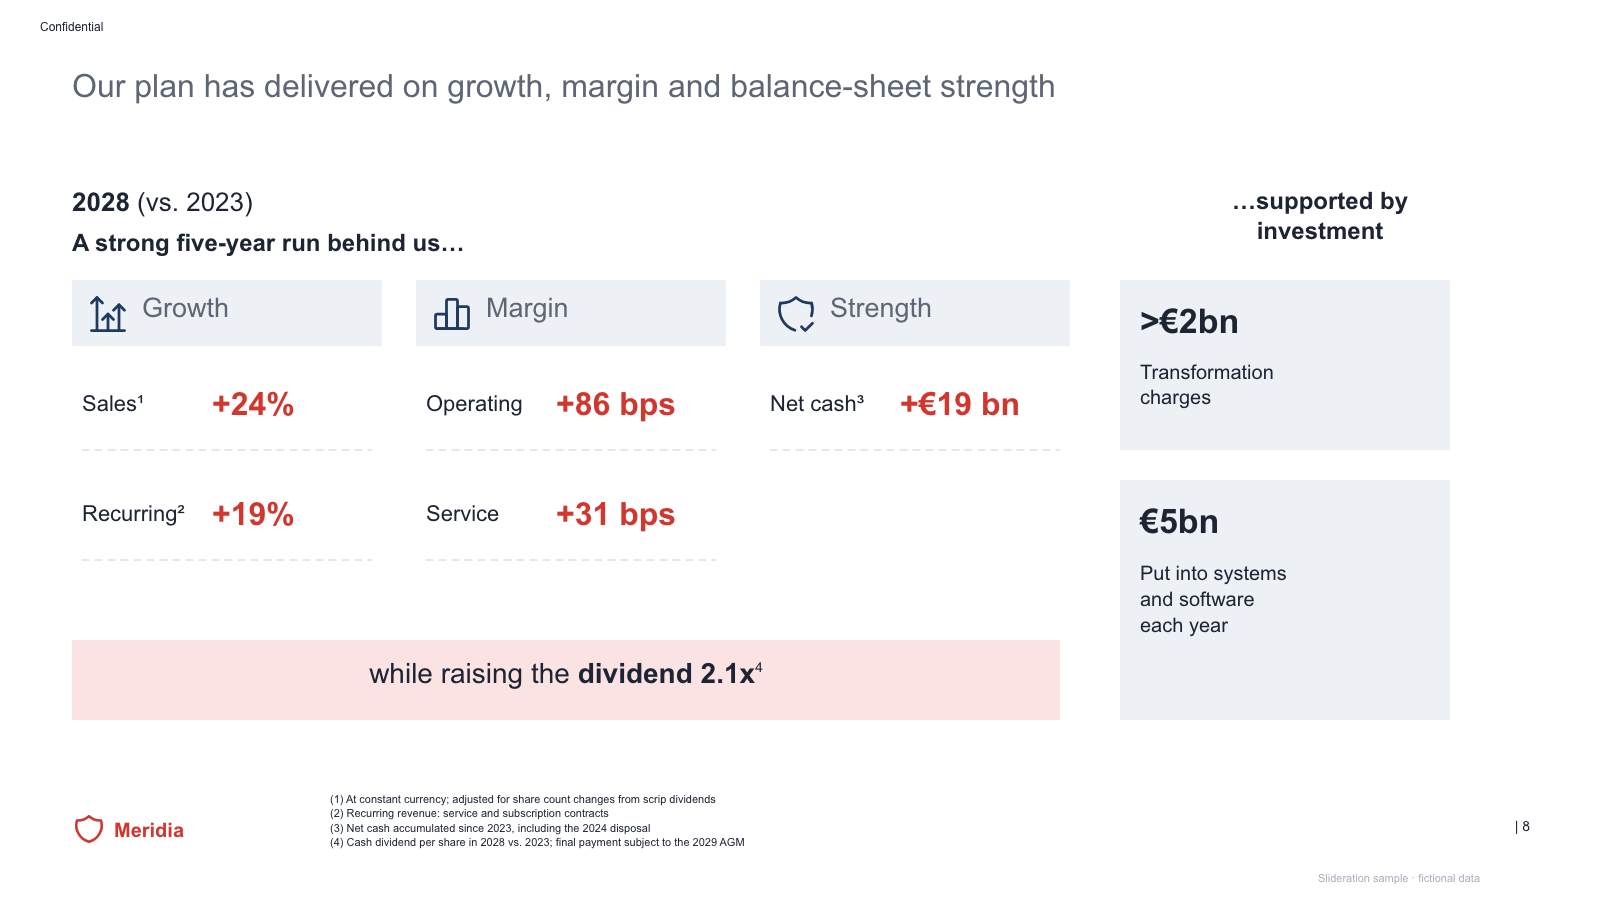
Three metric panels with icon headers and red figures, a highlight bar and two investment boxes

Three metric panels with icon headers and red figures, a highlight bar and two investment boxes

Ranked bar column plus a grid of country cells colour-coded against the regional benchmark

Ranked bar column plus a grid of country cells colour-coded against the regional benchmark

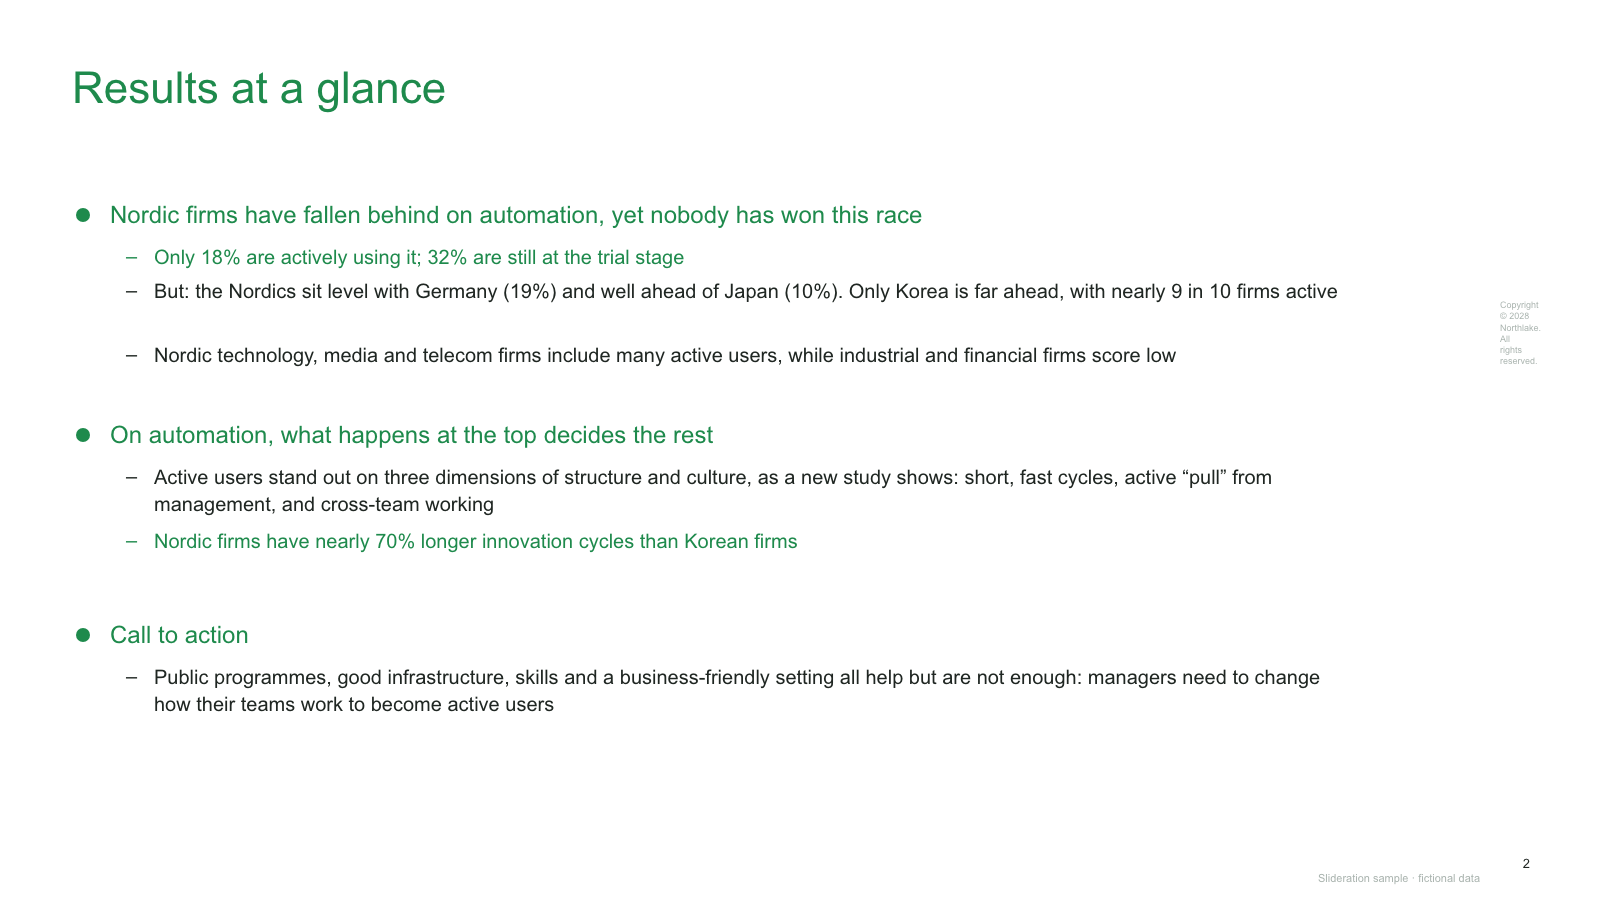
Text-only summary page with colour-highlighted sub-bullets under three headline points

Text-only summary page with colour-highlighted sub-bullets under three headline points

Free PPTX
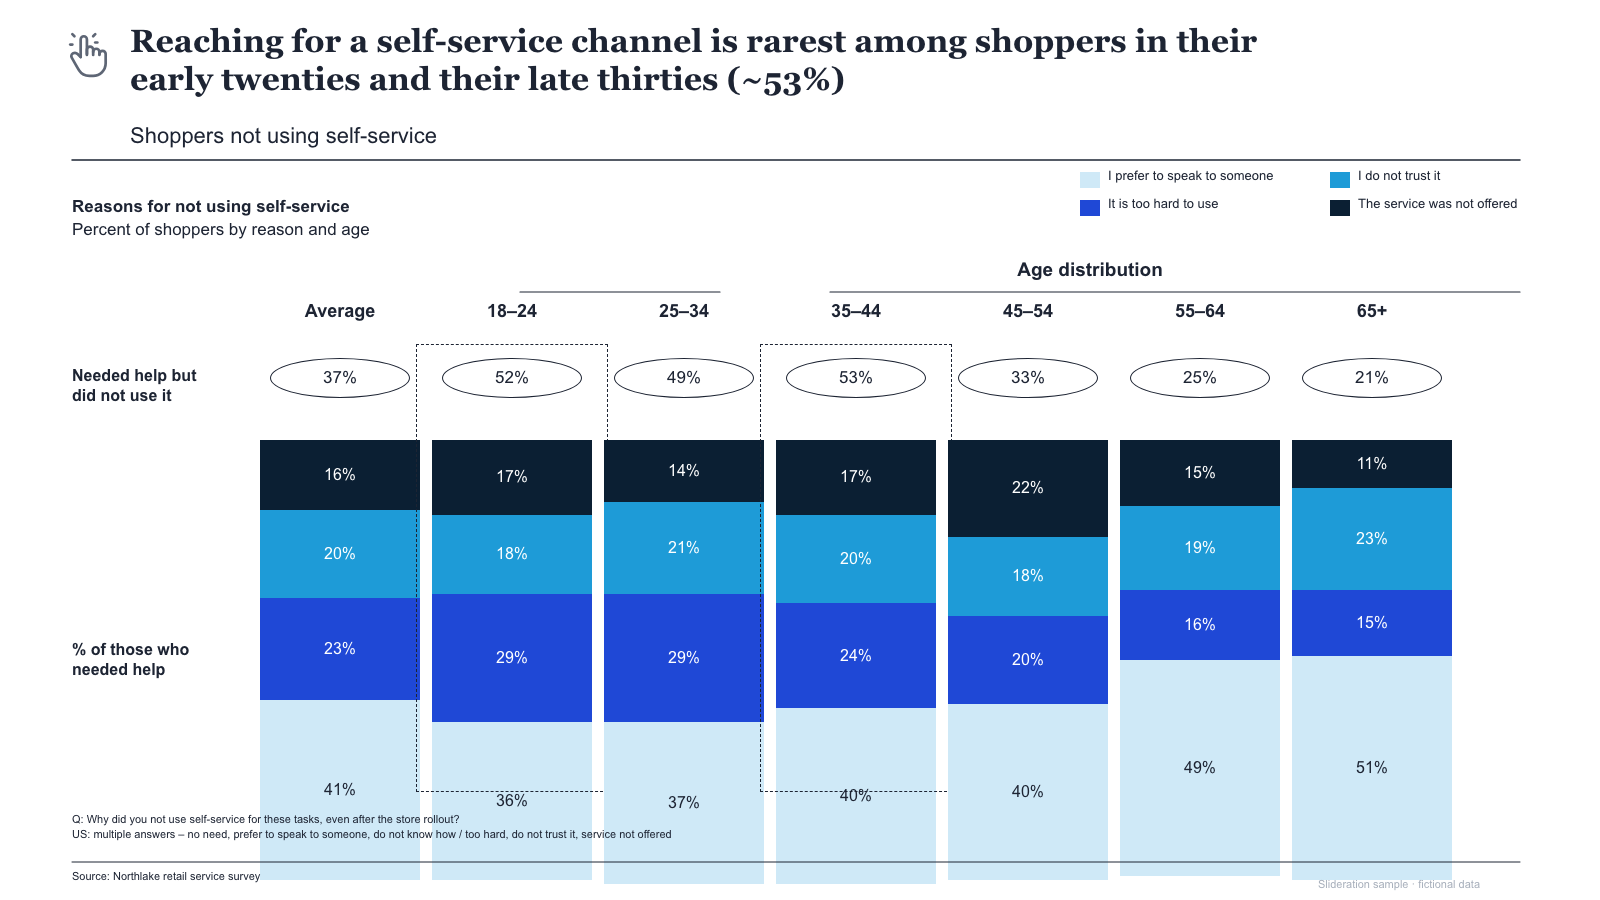
Stacked reason columns by age band with highlight boxes, pill row and four-part legend

Stacked reason columns by age band with highlight boxes, pill row and four-part legend

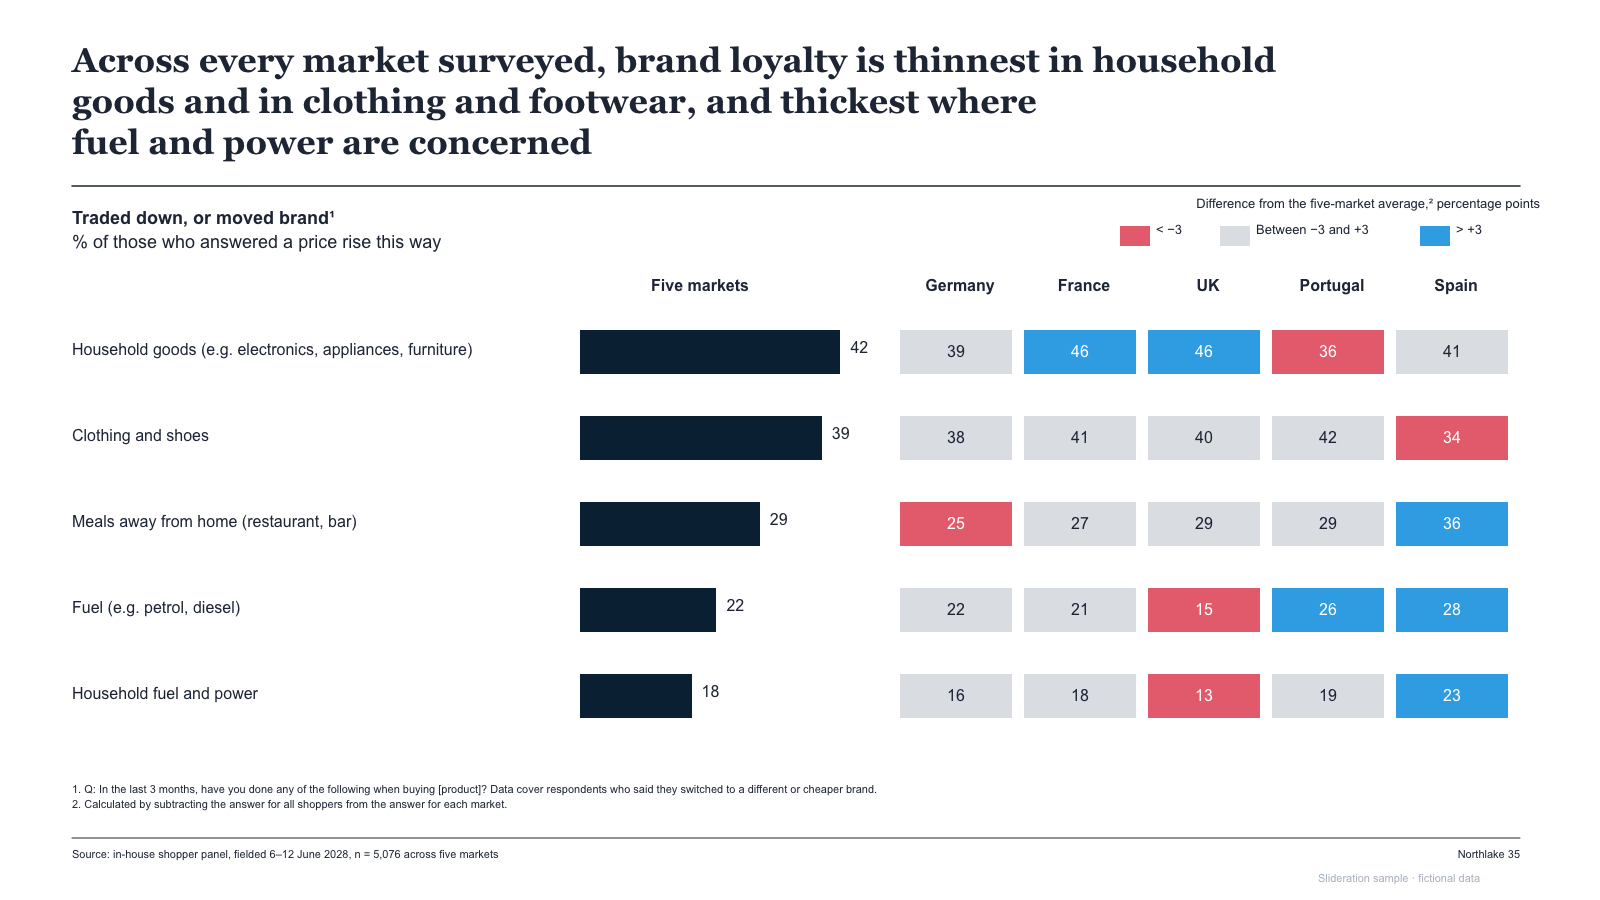
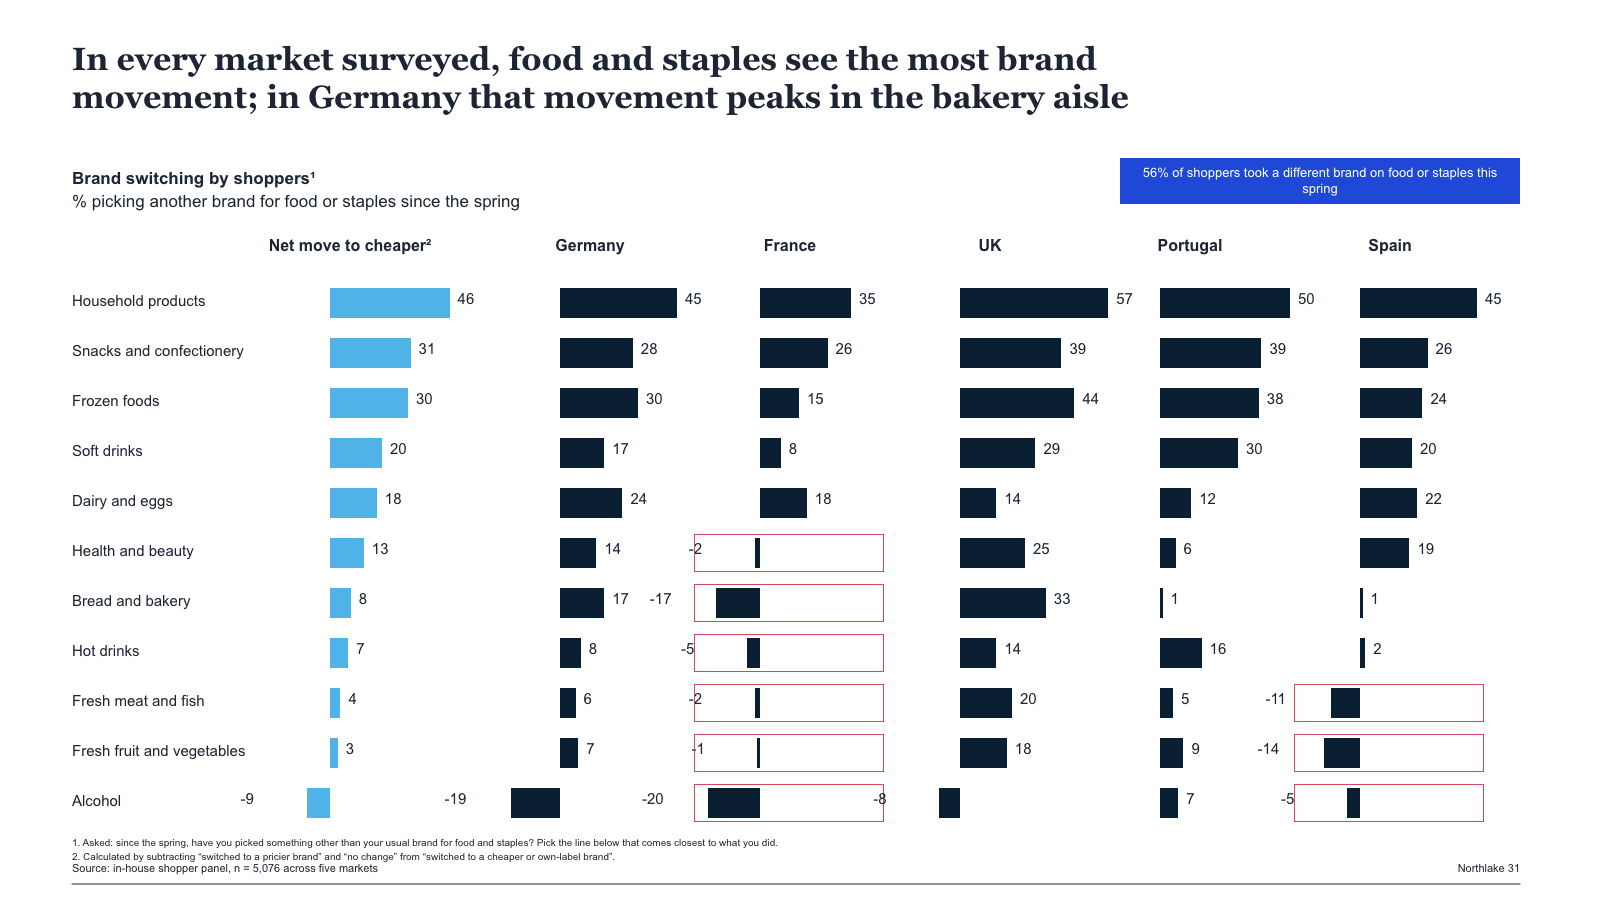
Category rows with a net bar column and five market bar cells, with highlight frames

Category rows with a net bar column and five market bar cells, with highlight frames

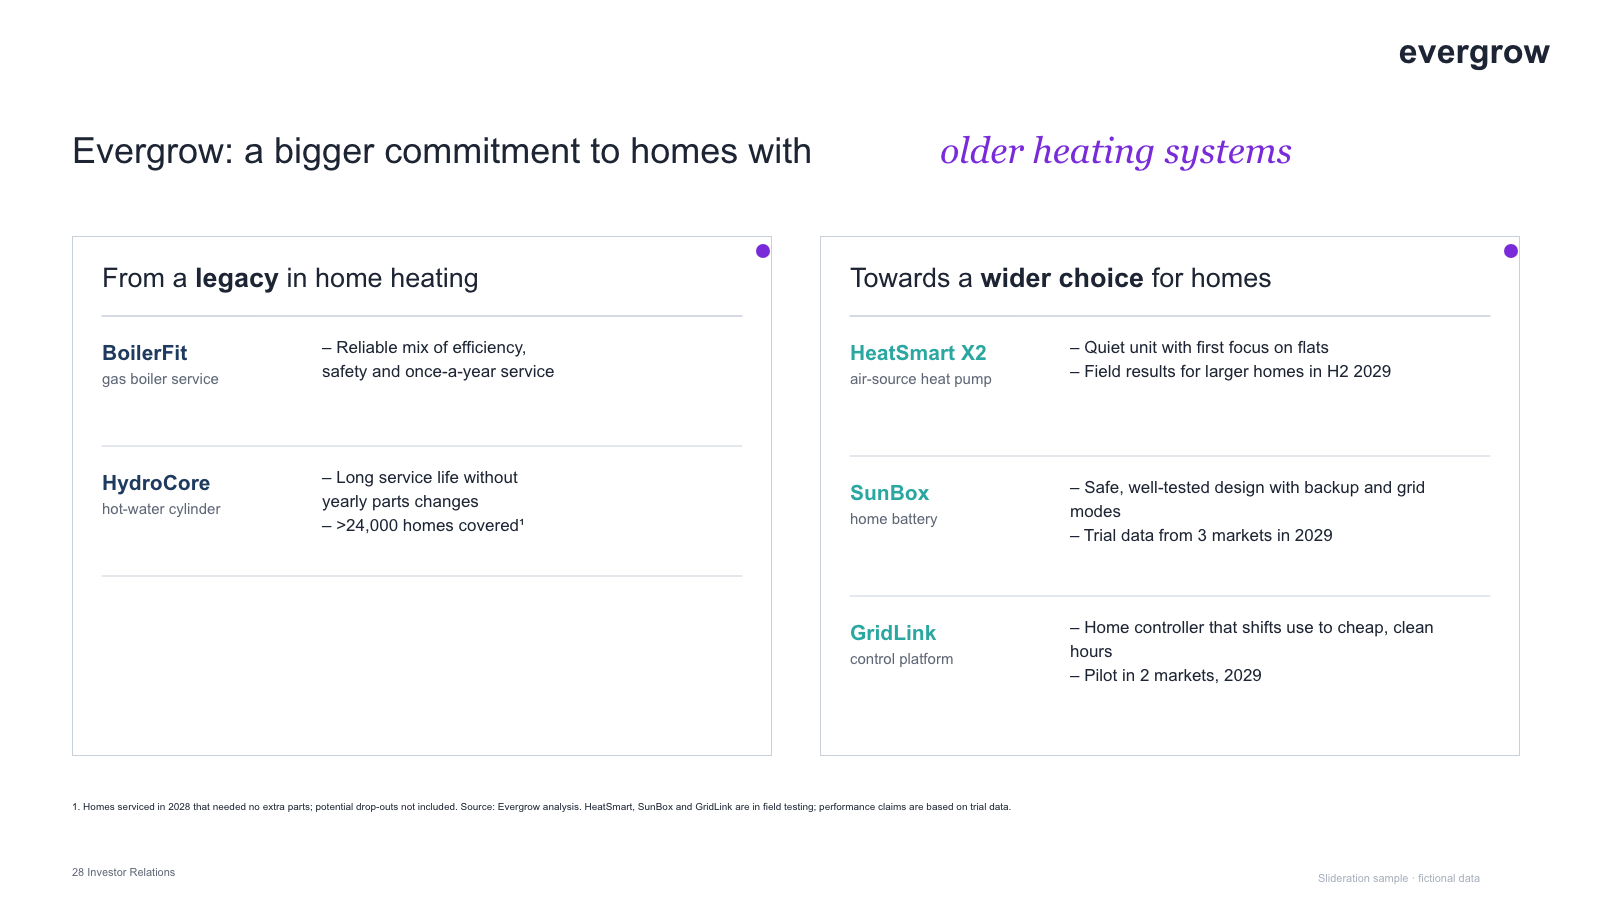
Two bordered panels contrasting legacy and future line-ups, each with product rows and bullets

Two bordered panels contrasting legacy and future line-ups, each with product rows and bullets

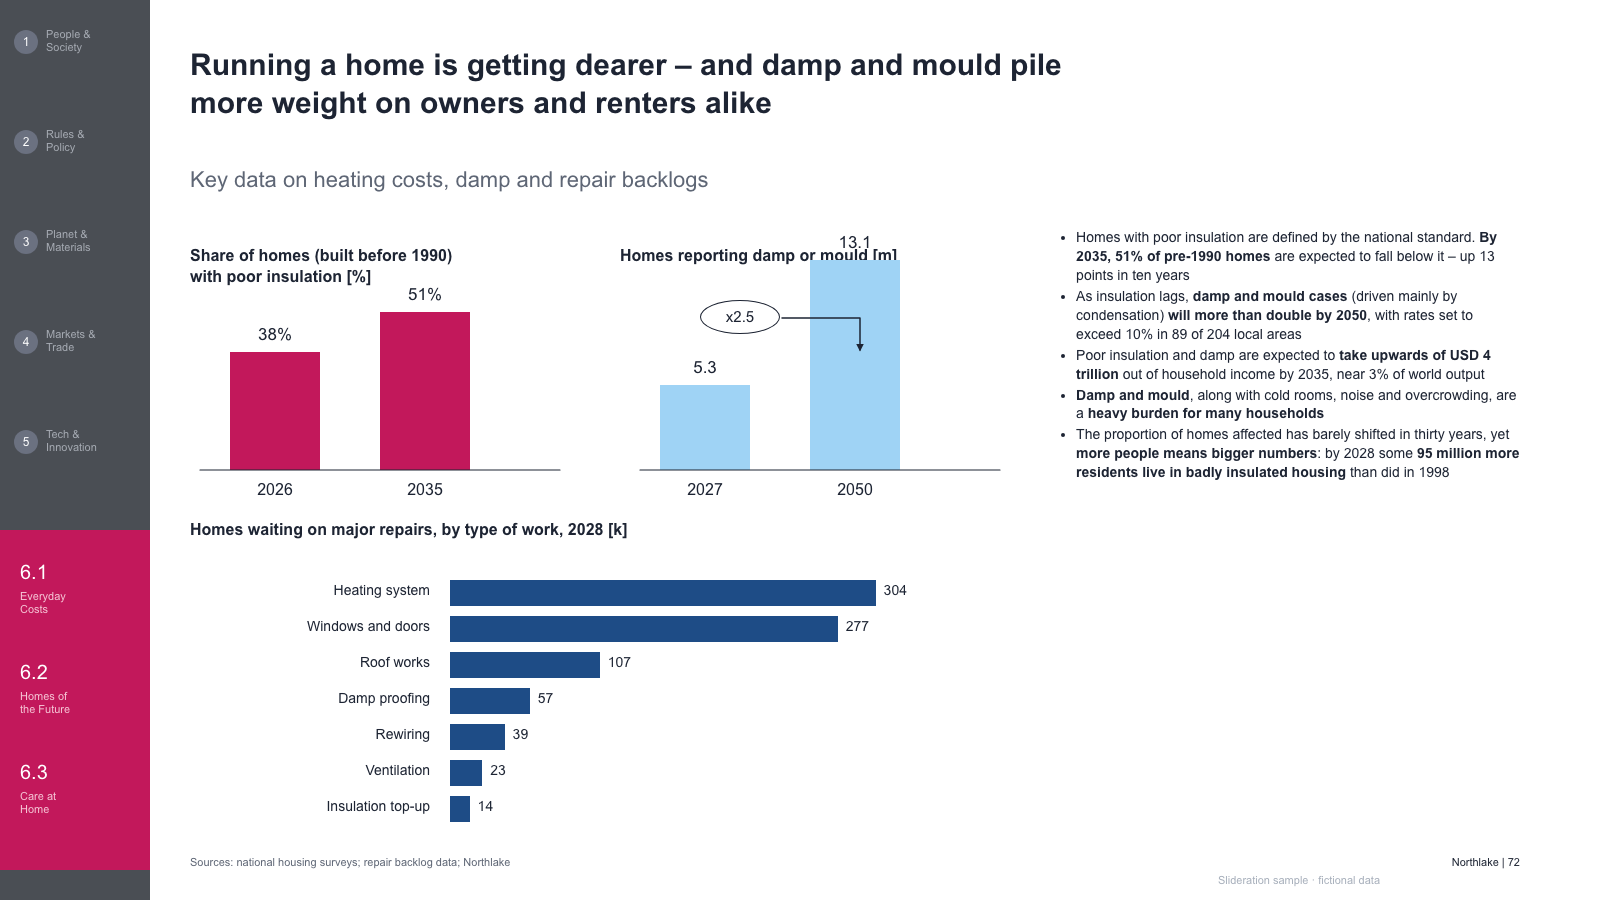
Rail plus three small charts (two bar pairs and a ranked bar list) with a bullet commentary column

Rail plus three small charts (two bar pairs and a ranked bar list) with a bullet commentary column

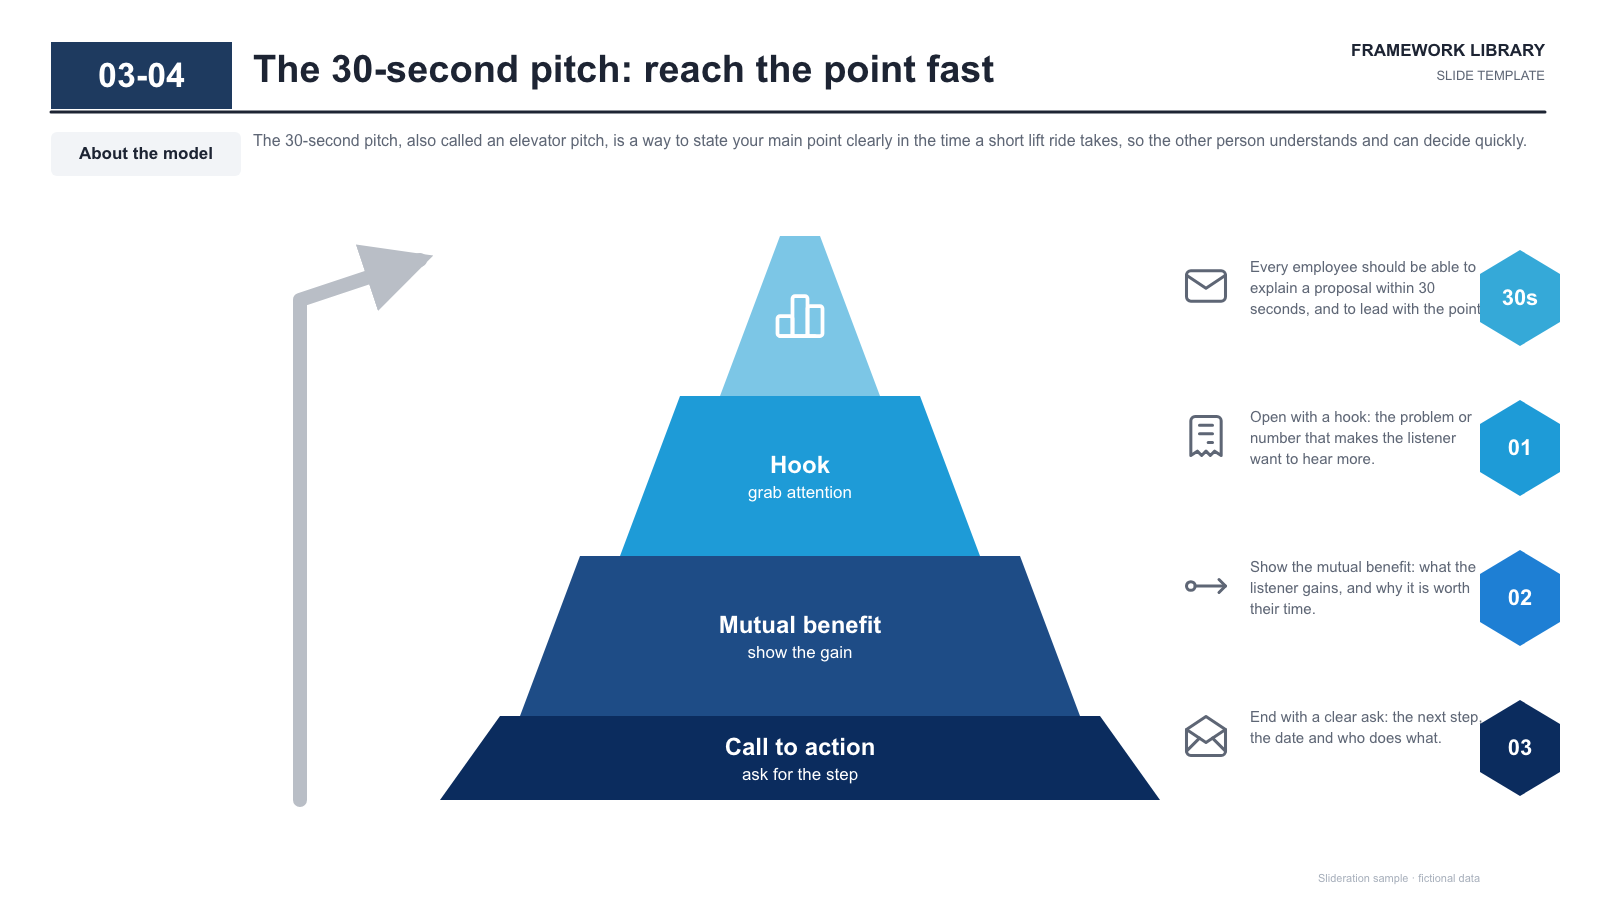
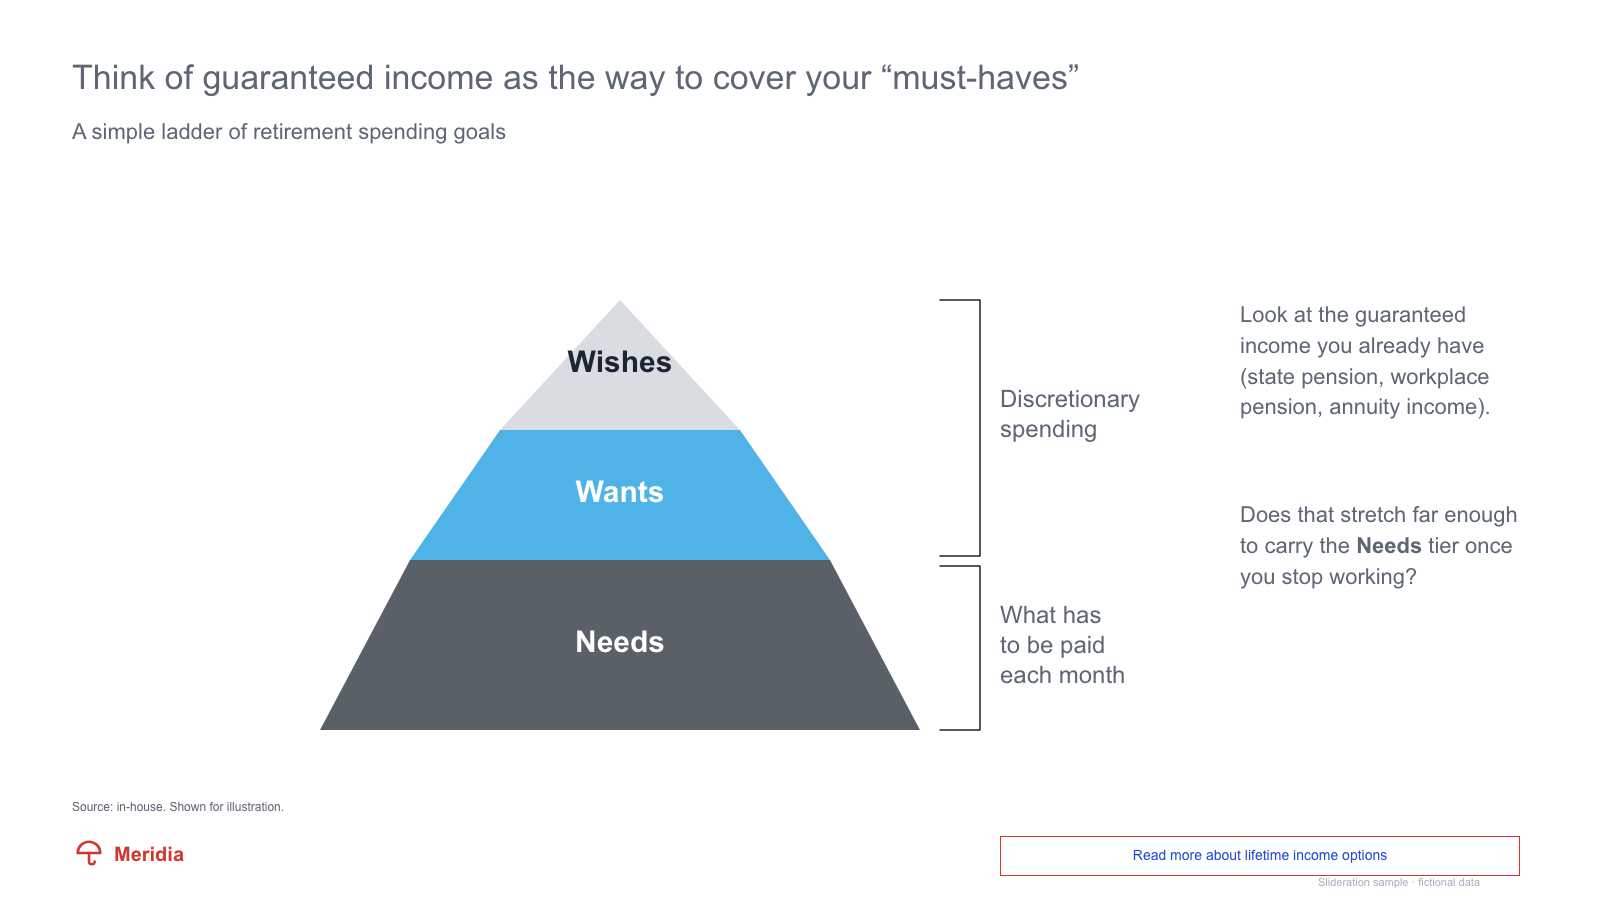
Ascending pyramid of three tiers with a rising arrow and matching numbered explanation rows

Ascending pyramid of three tiers with a rising arrow and matching numbered explanation rows

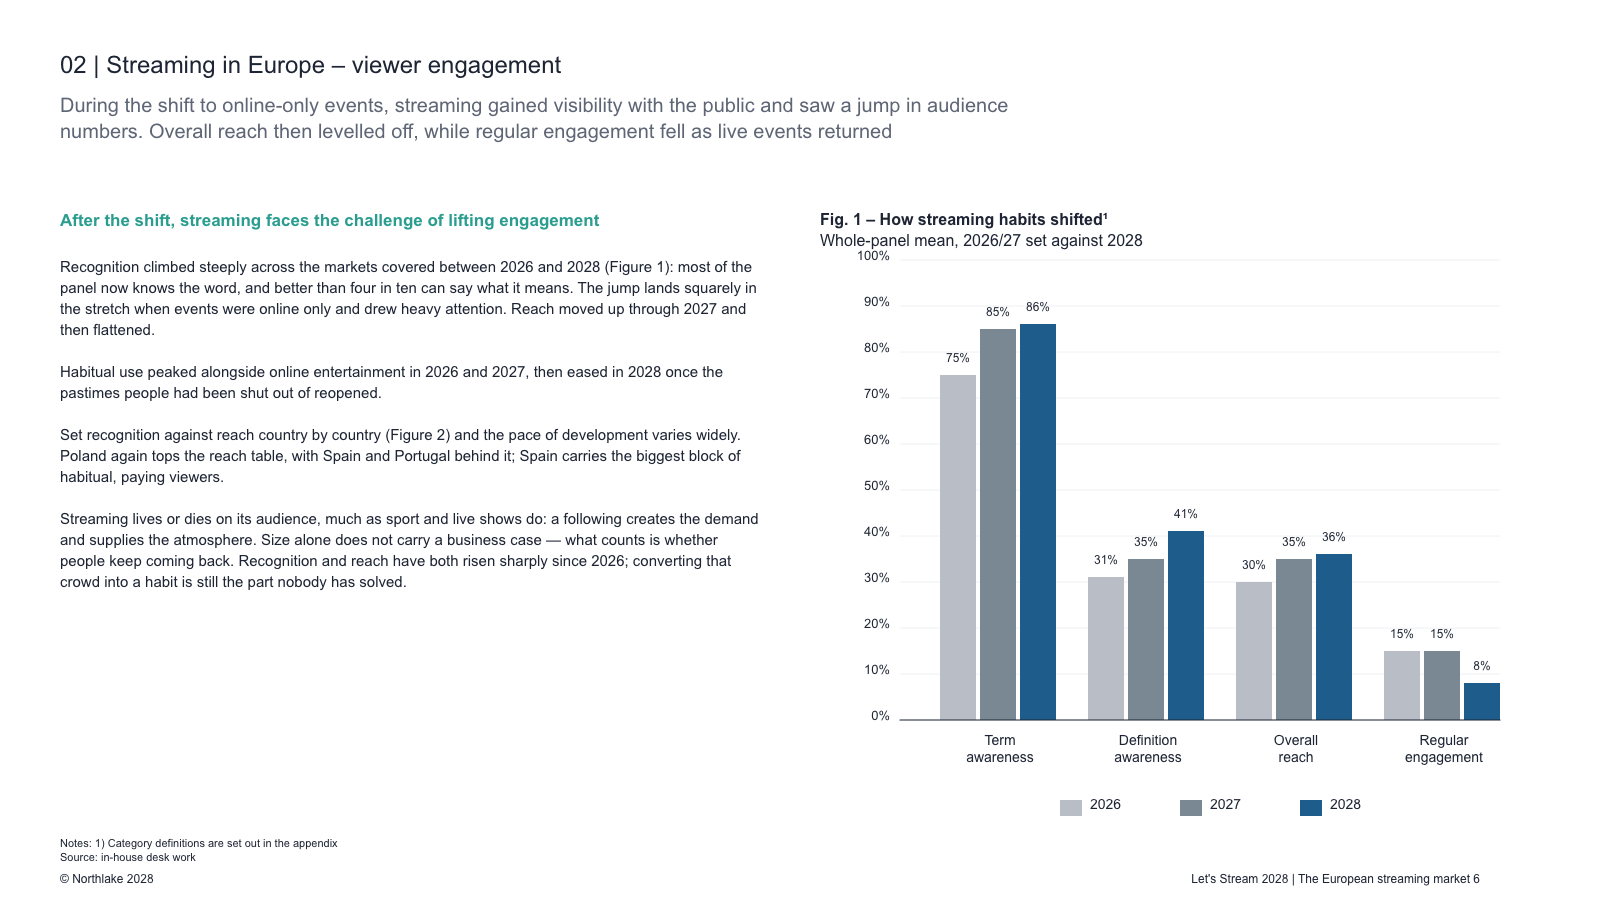
Intro paragraphs beside a grouped bar chart of three yearly series with a legend

Intro paragraphs beside a grouped bar chart of three yearly series with a legend

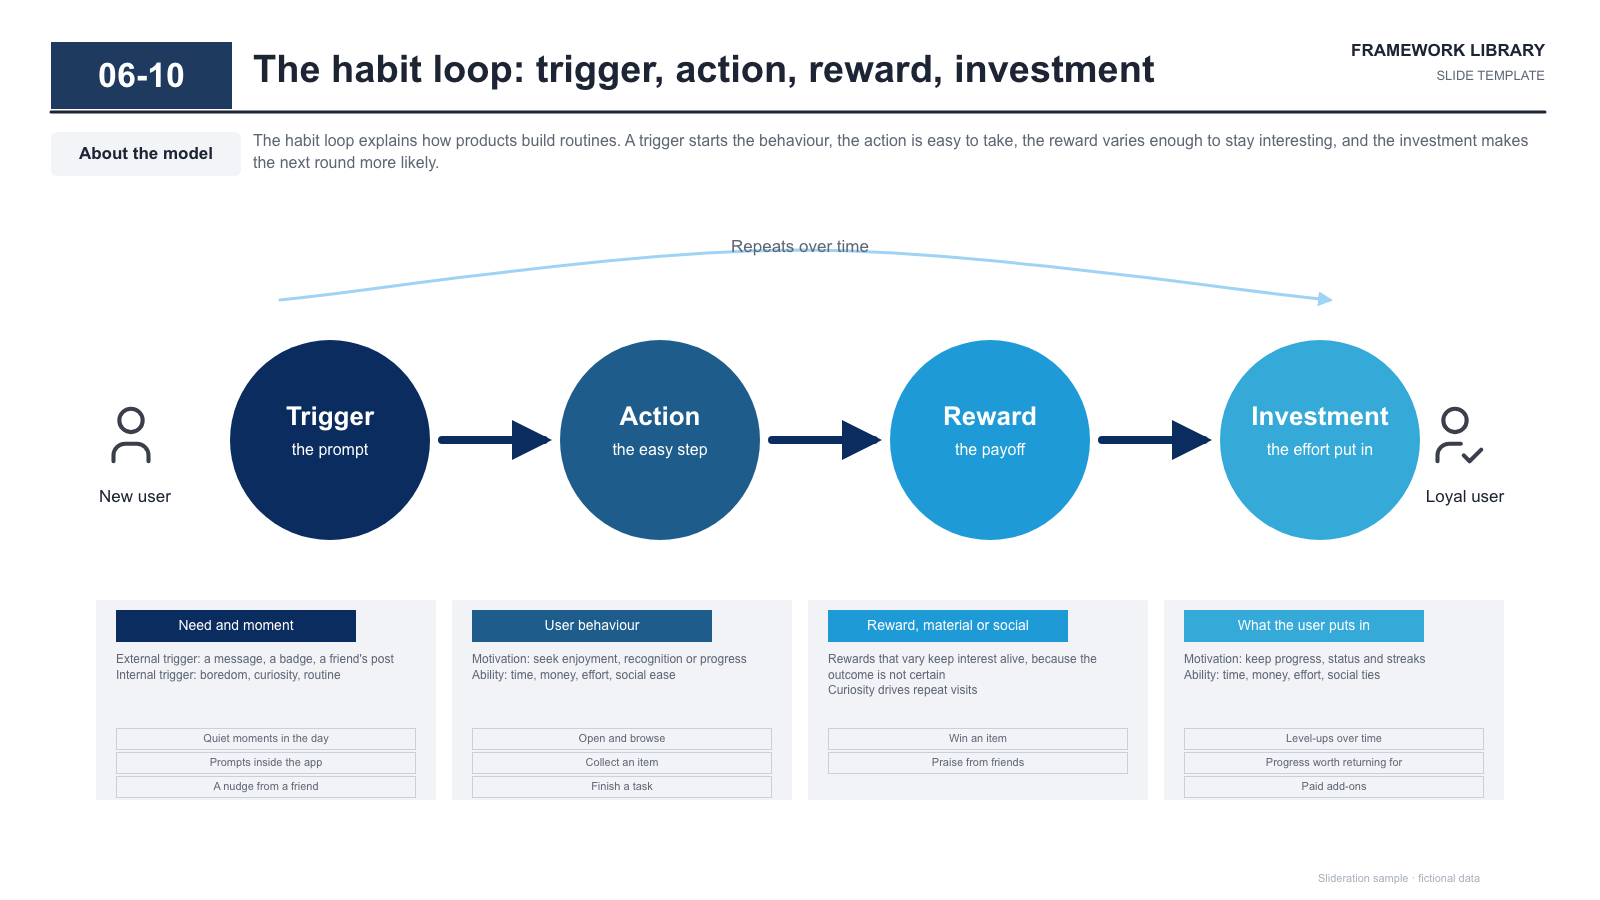
Four-stage habit loop of circles with arrows, user icons at both ends and a detail column grid

Four-stage habit loop of circles with arrows, user icons at both ends and a detail column grid

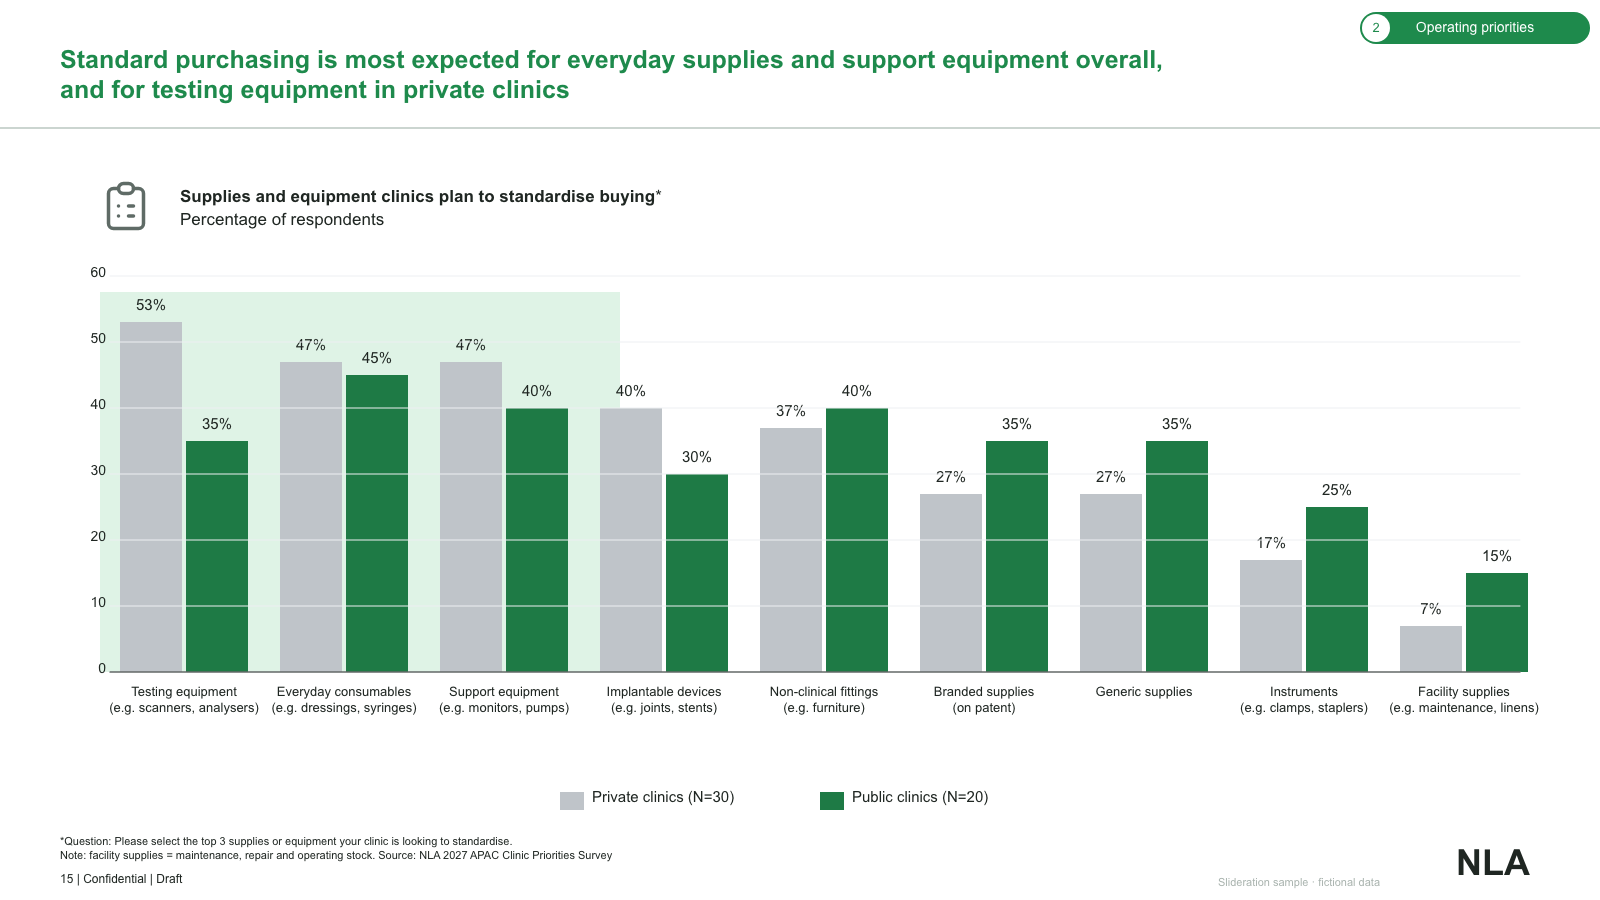
Paired category bars with a highlighted first block, two-colour legend and survey footnotes

Paired category bars with a highlighted first block, two-colour legend and survey footnotes

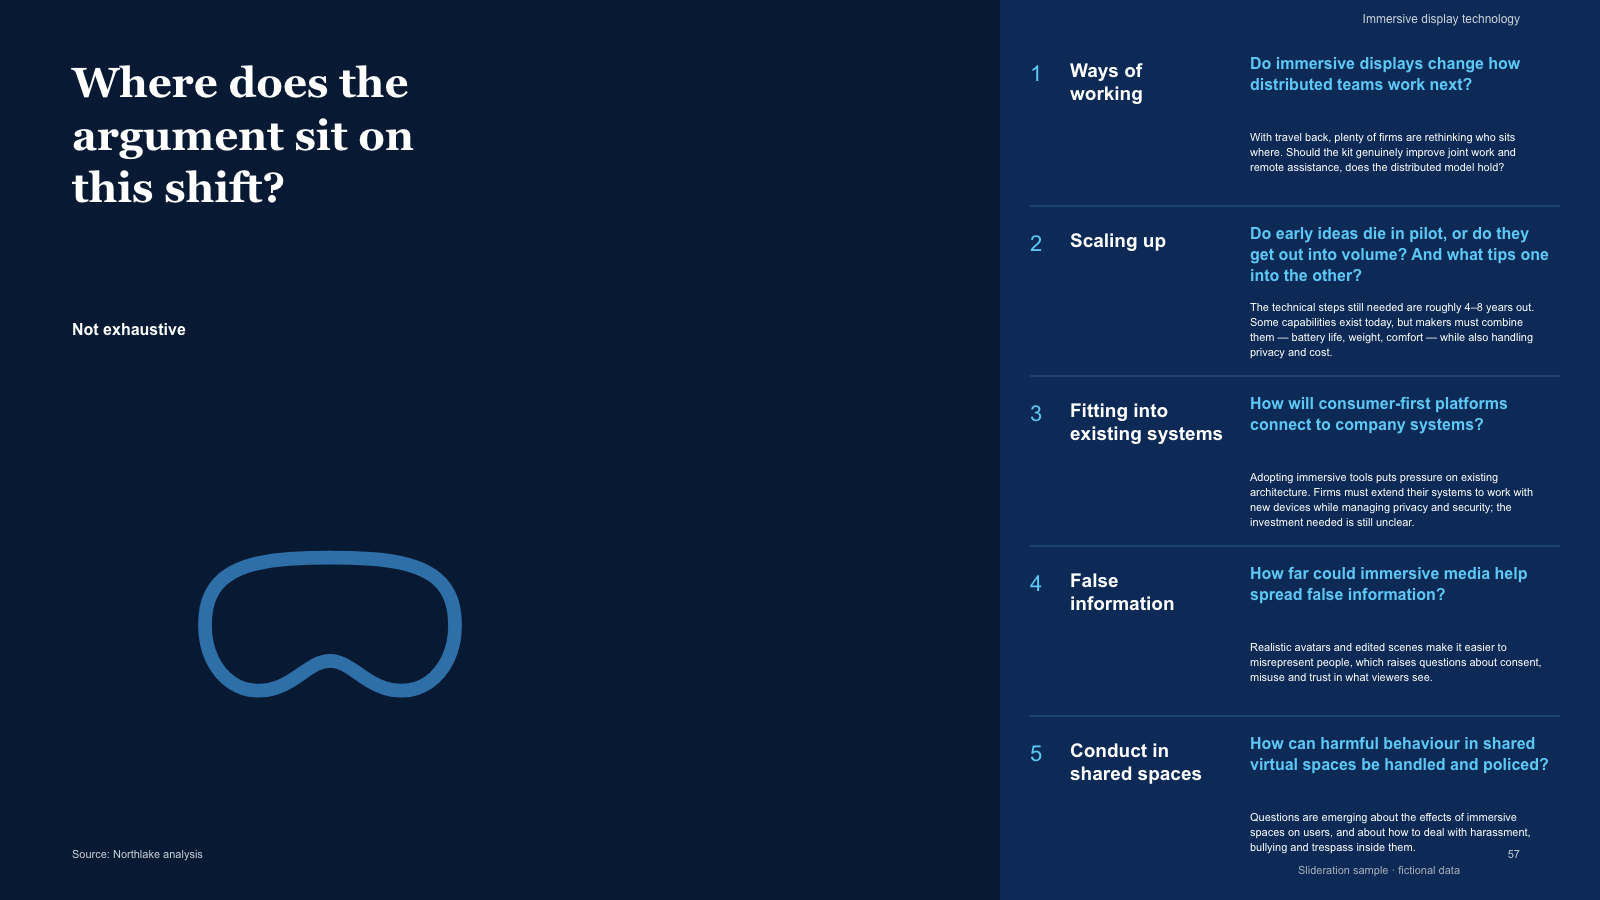
Dark gradient panel — serif question on the left and five numbered debate topics on the right

Dark gradient panel — serif question on the left and five numbered debate topics on the right

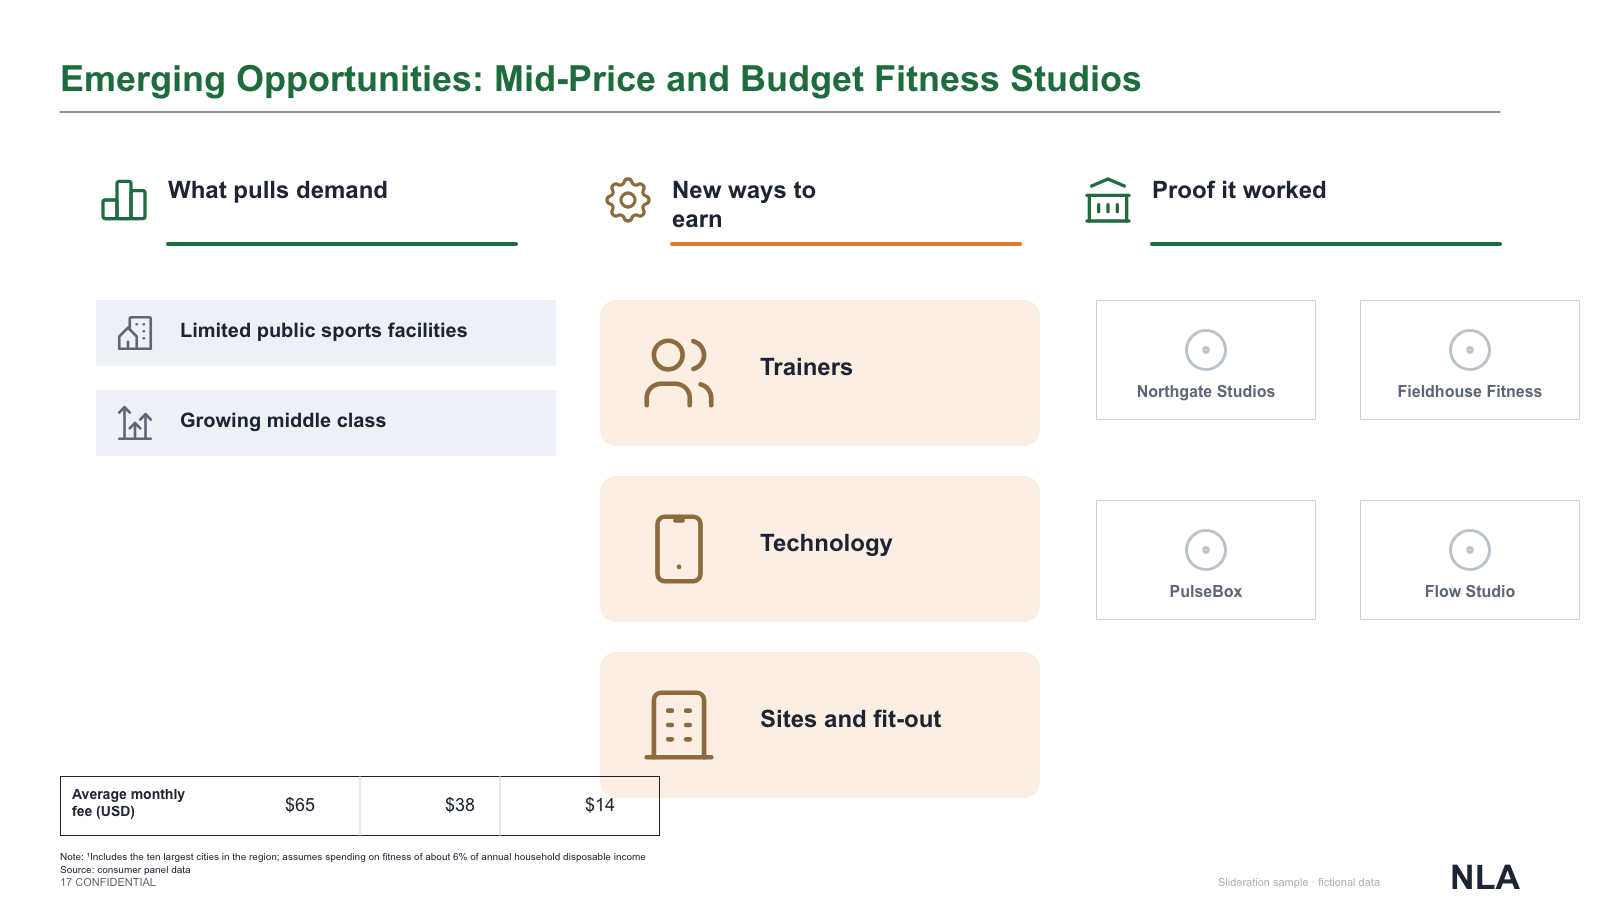
Three underlined columns — demand drivers, model pillars with icon panels, and partner tiles

Three underlined columns — demand drivers, model pillars with icon panels, and partner tiles

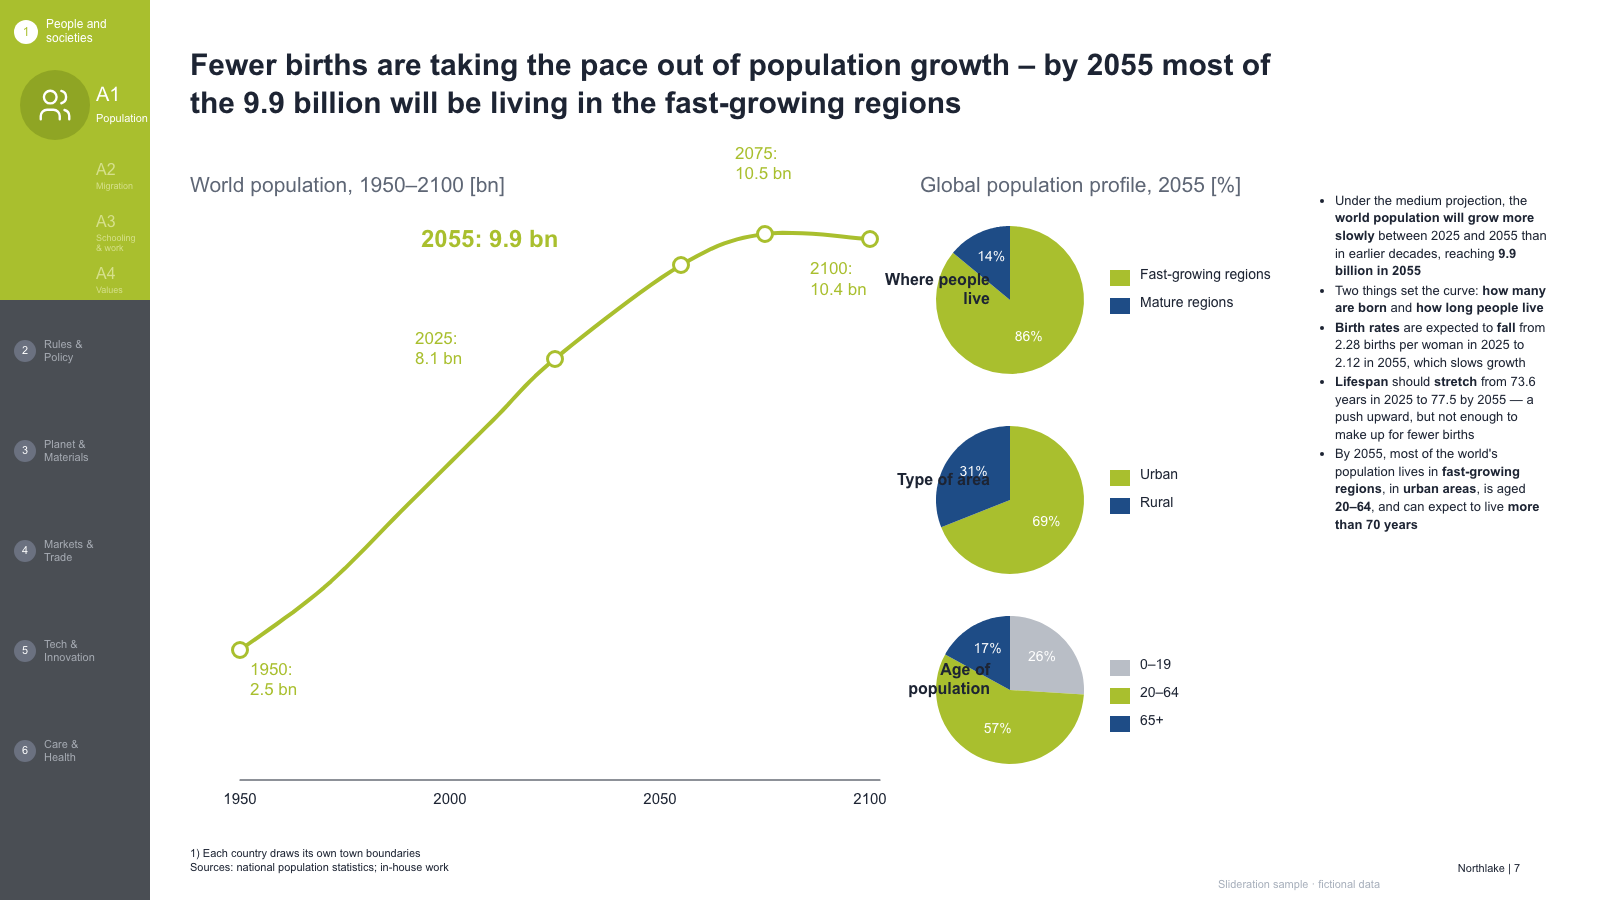
Rail, an S-curve population chart with year callouts, three small pies and a bullet column

Rail, an S-curve population chart with year callouts, three small pies and a bullet column

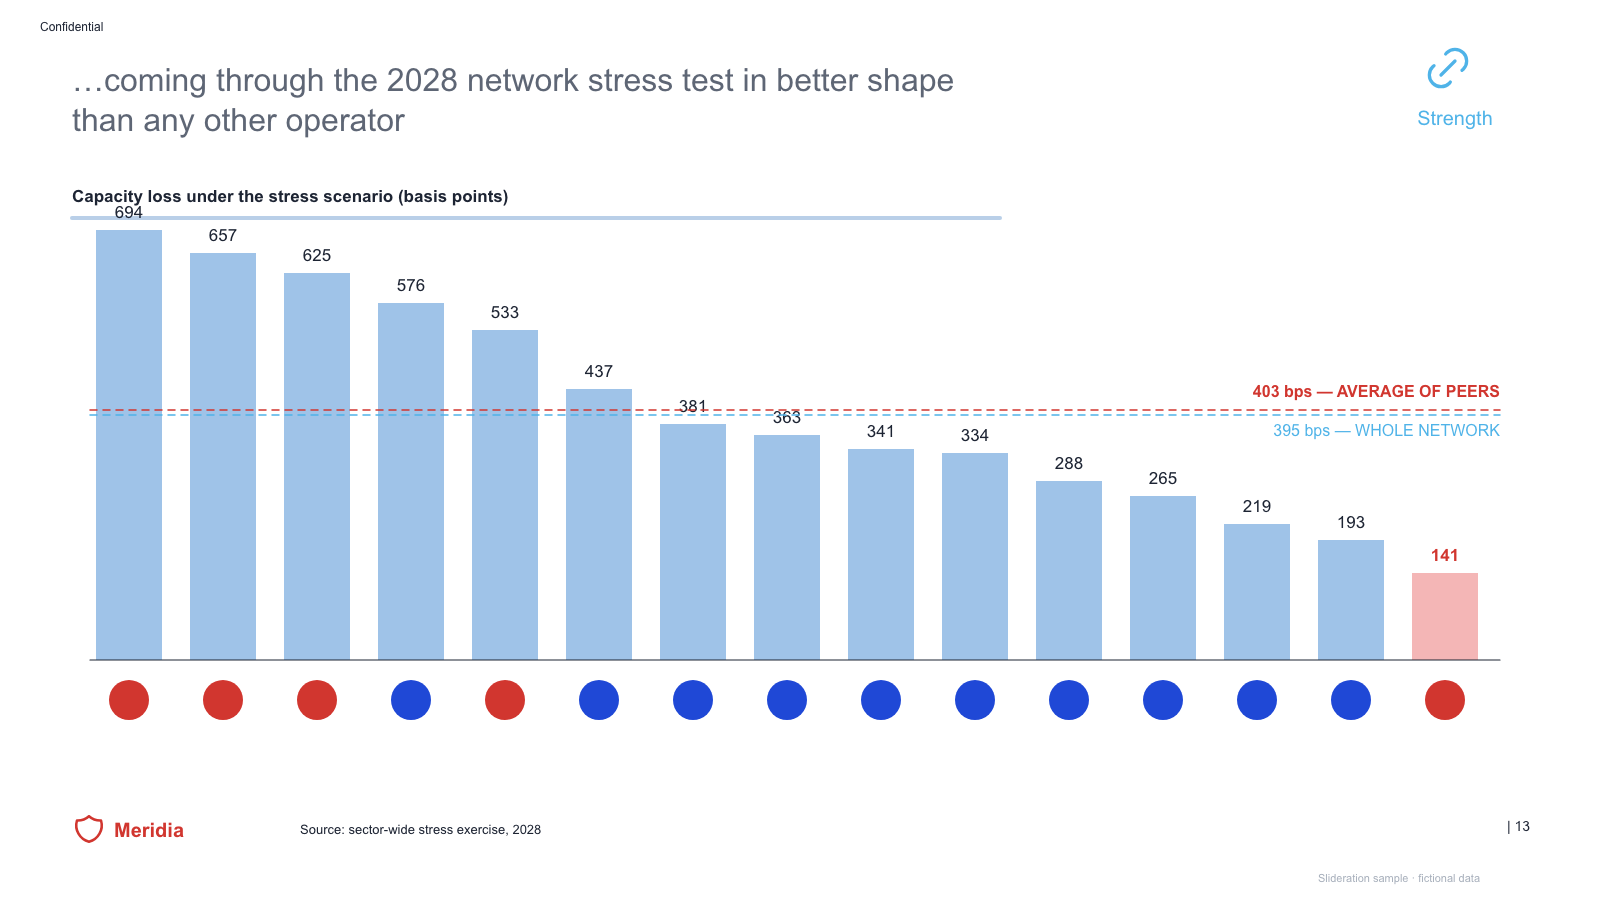
Ranked bar chart of peers with two reference lines, flag row and one highlighted bar

Ranked bar chart of peers with two reference lines, flag row and one highlighted bar

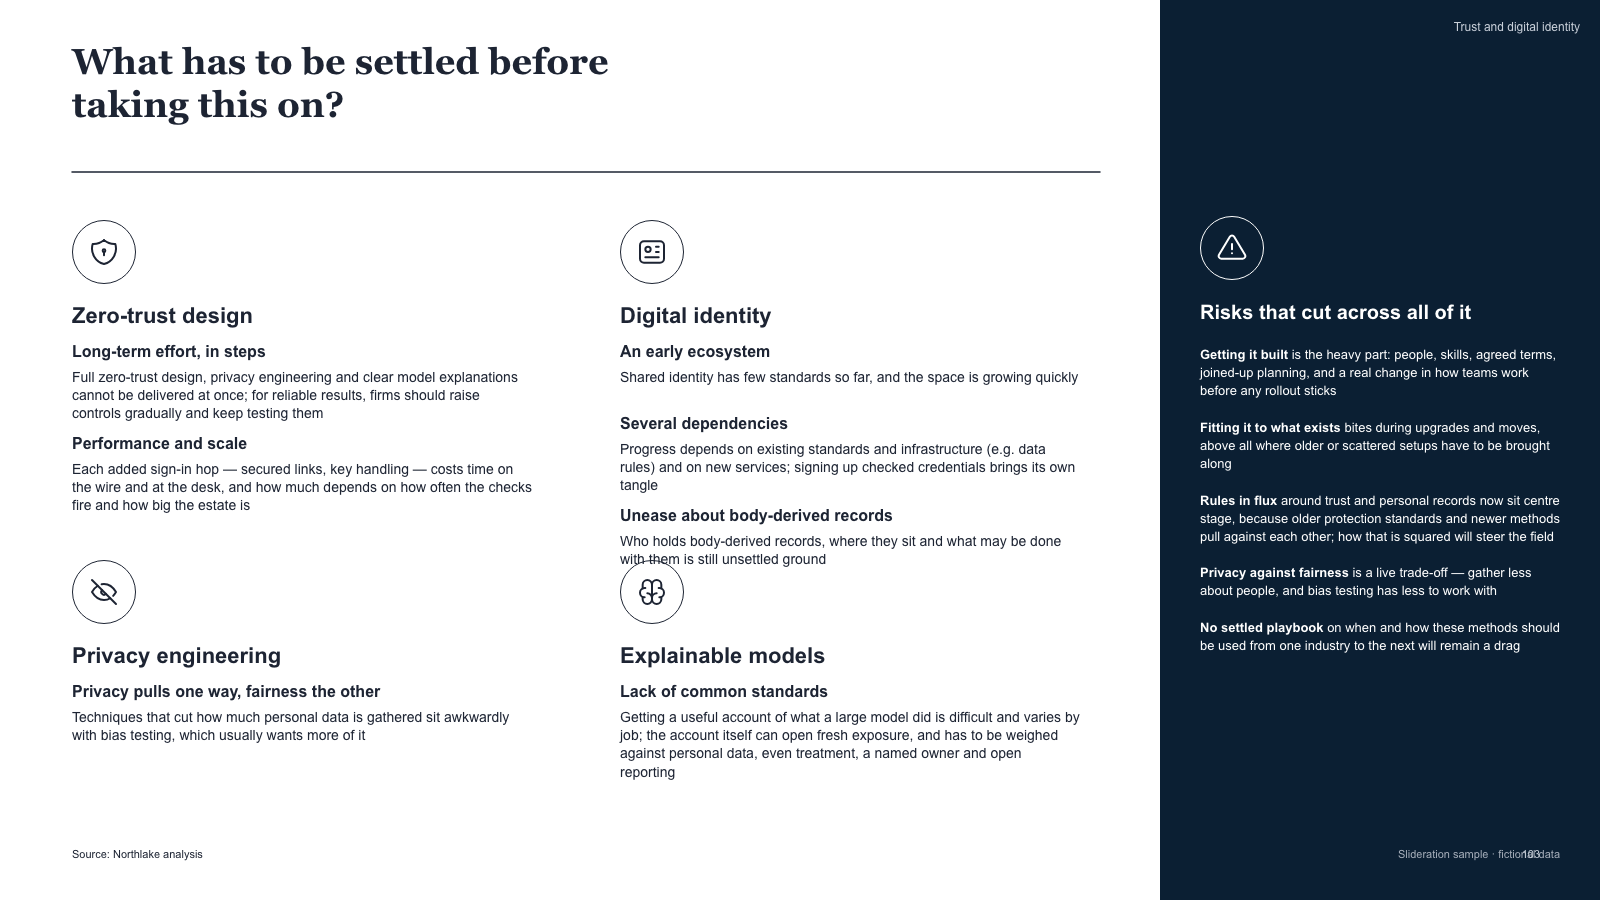
Four icon-led theme blocks on white beside a dark panel of overarching risks

Four icon-led theme blocks on white beside a dark panel of overarching risks

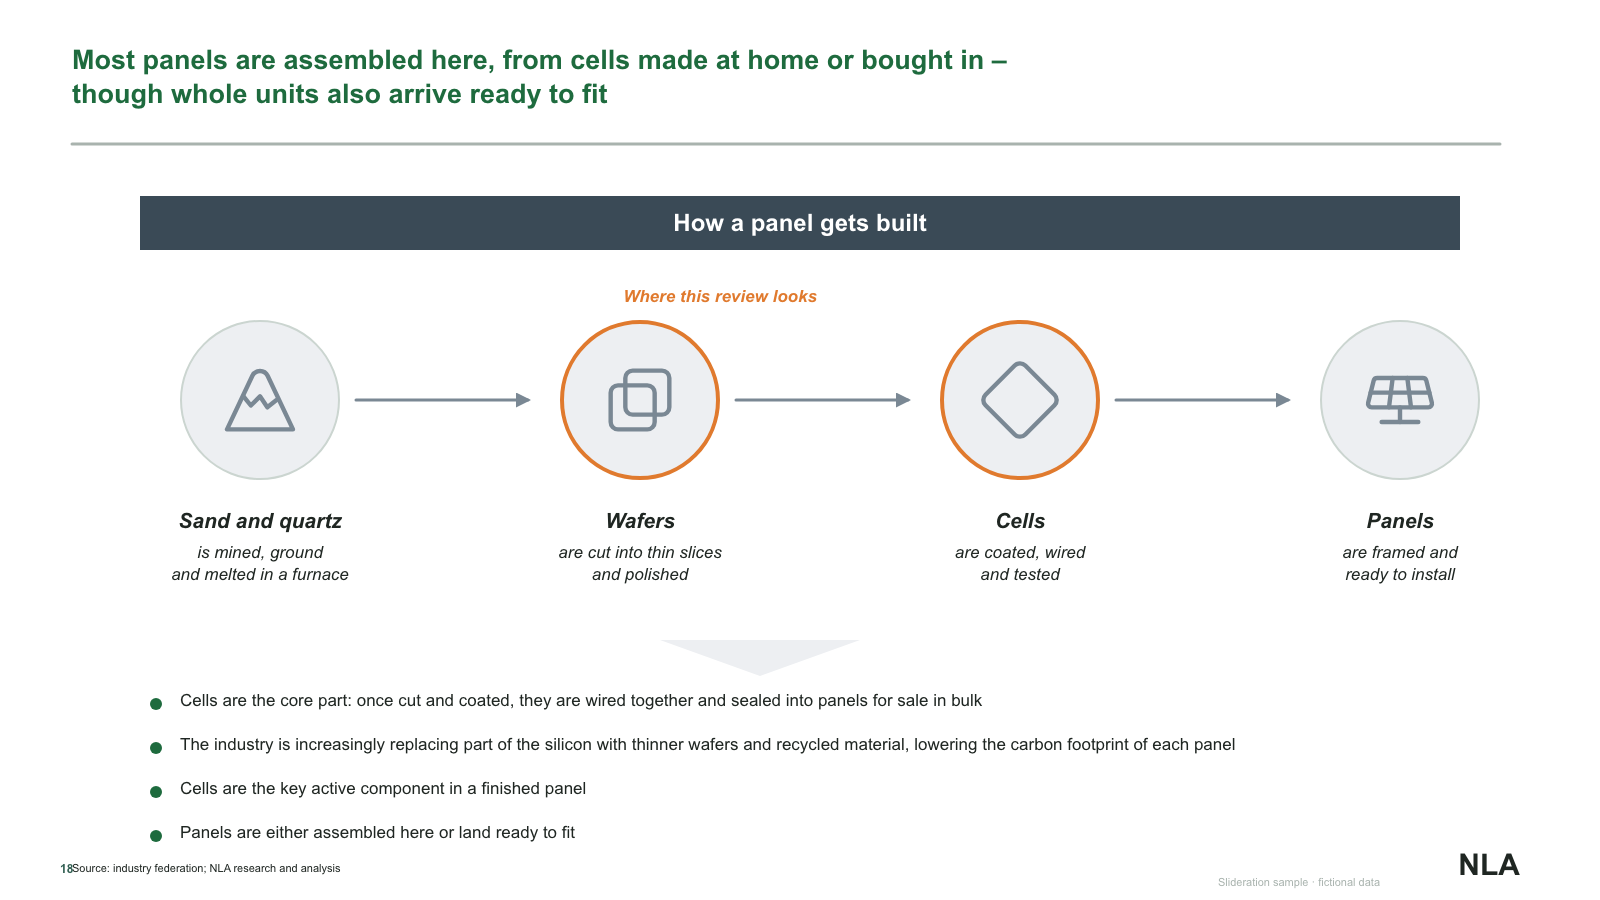
Dark process header bar over a four-step material flow with circle icons and bullet notes

Dark process header bar over a four-step material flow with circle icons and bullet notes

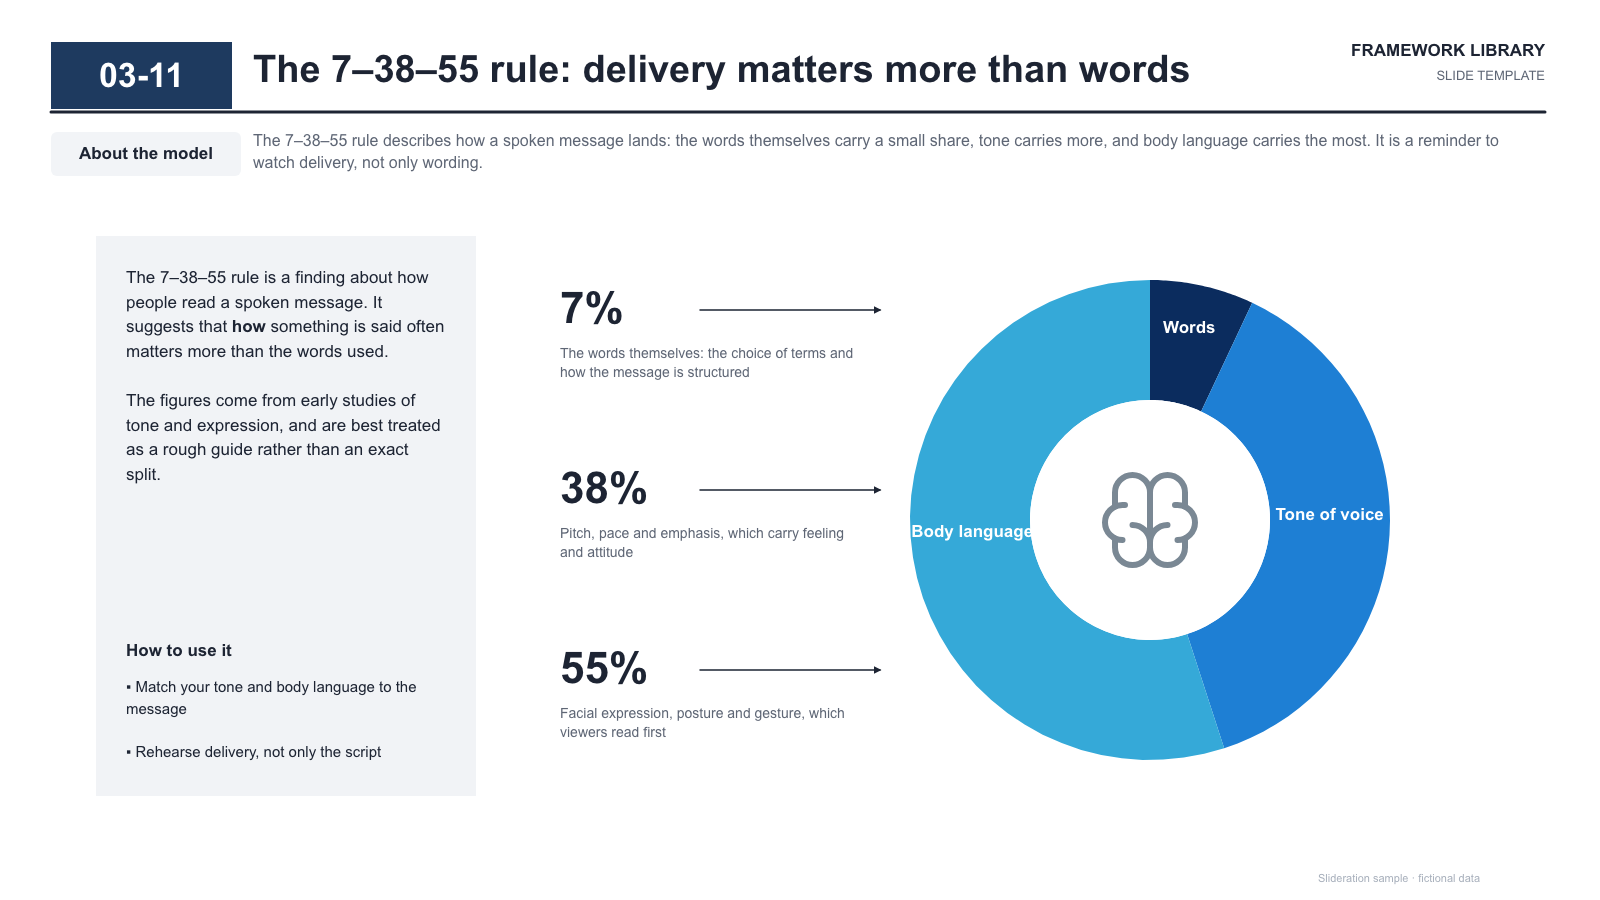
Explanatory text panel beside a three-segment donut with outside percentage callouts

Explanatory text panel beside a three-segment donut with outside percentage callouts

Rail, paired horizontal bars by country with a circular stat badge and a bullet column

Rail, paired horizontal bars by country with a circular stat badge and a bullet column

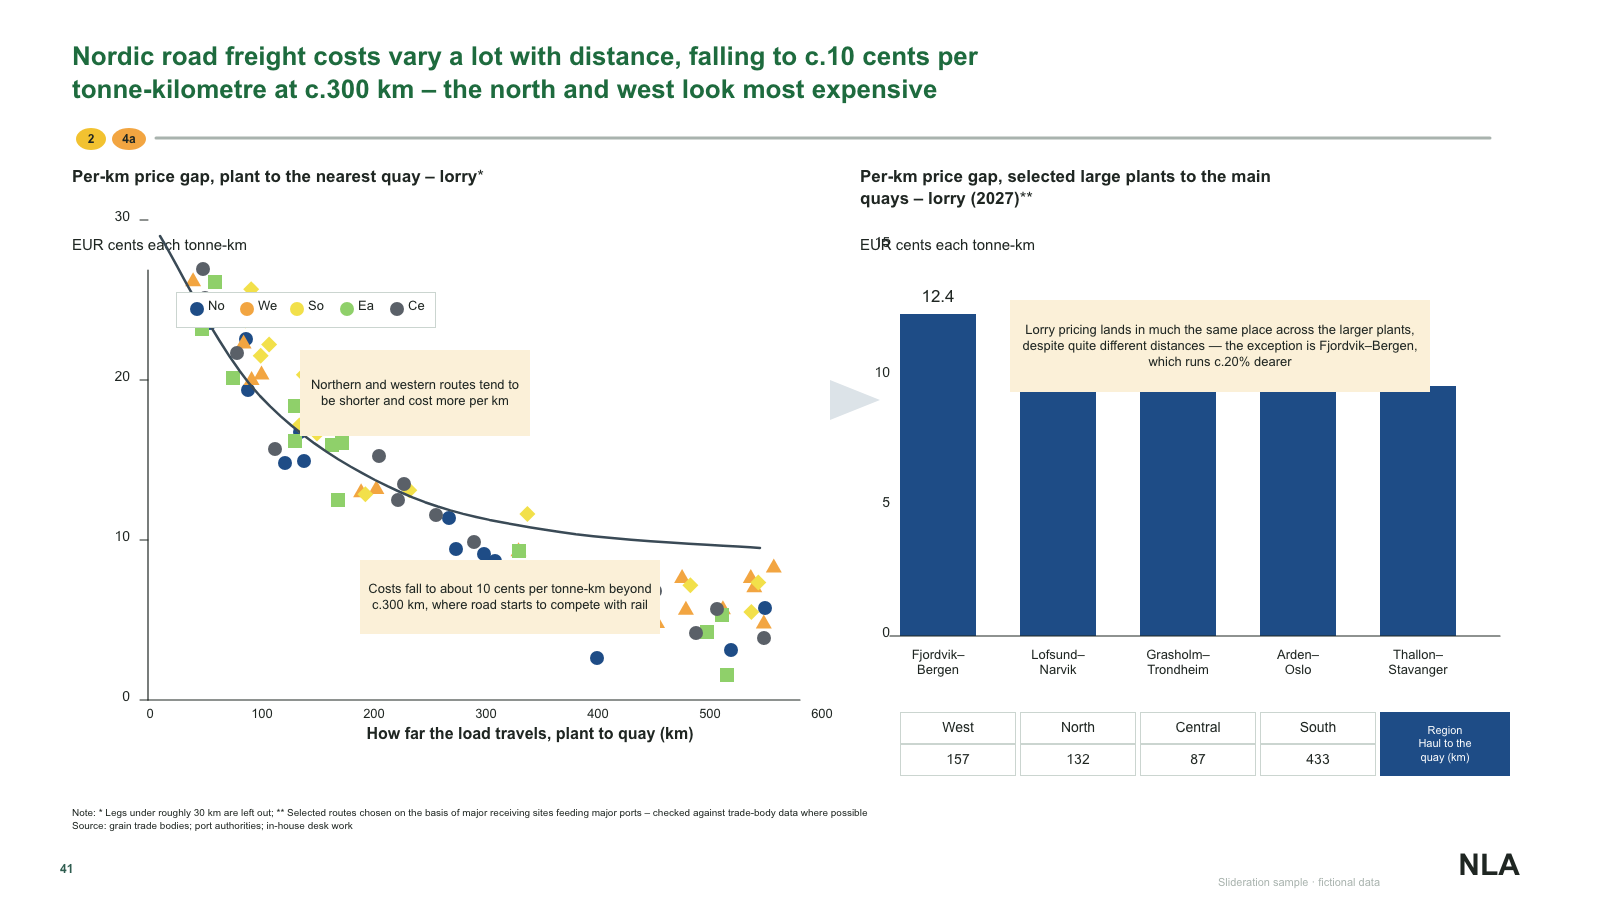
Scatter chart with trend line and callouts beside a ranked bar chart and a route table

Scatter chart with trend line and callouts beside a ranked bar chart and a route table

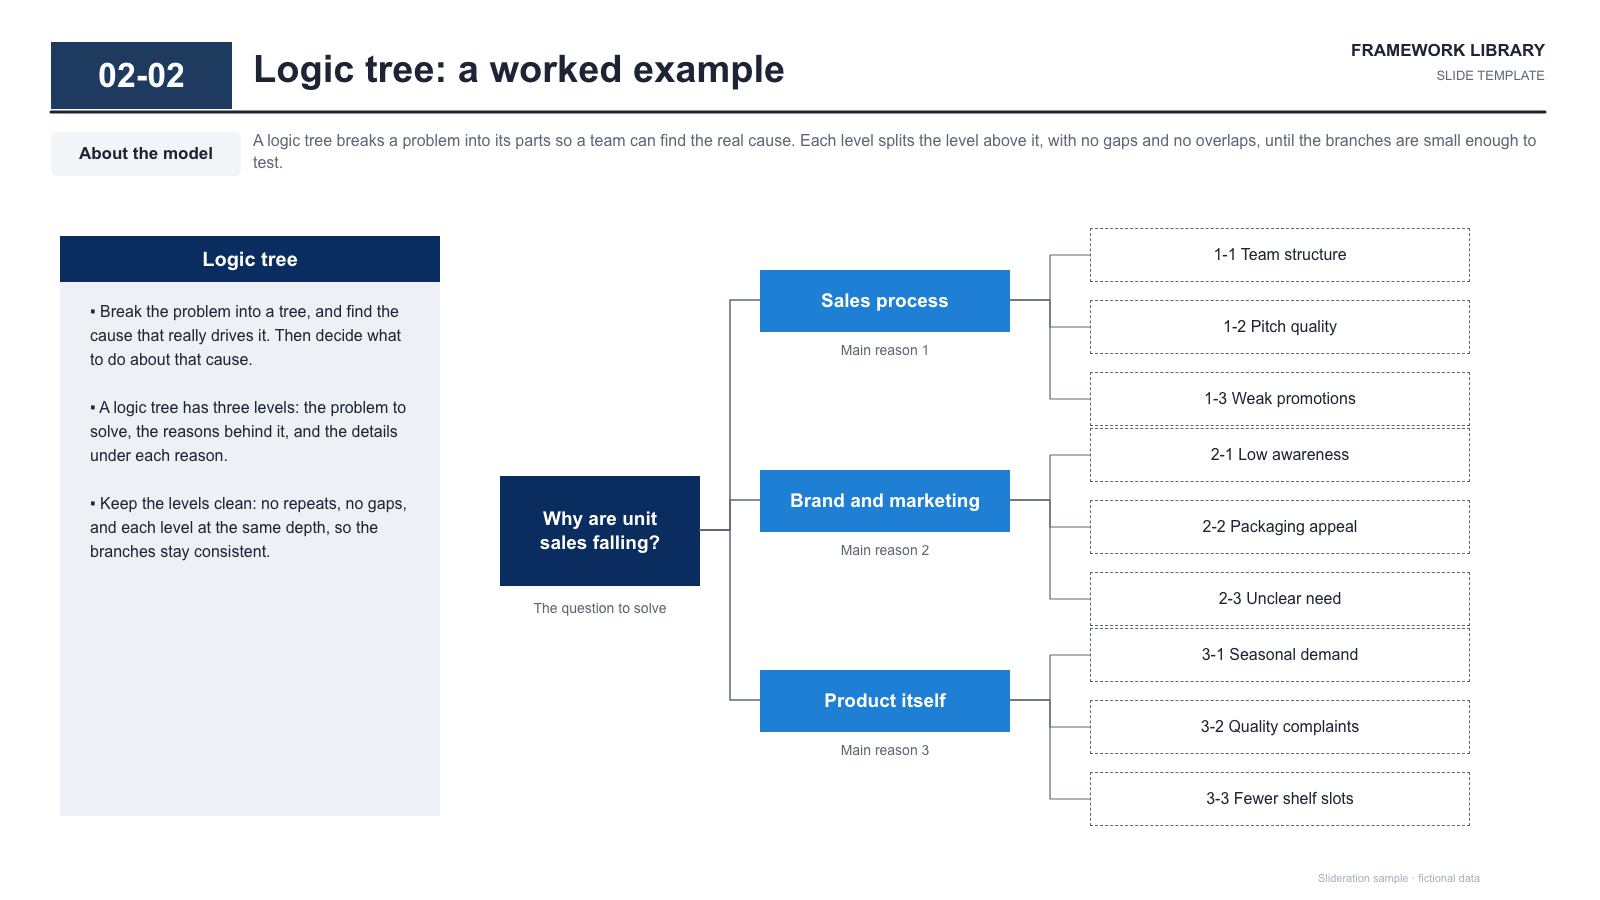
Explanation panel beside a three-level logic tree with dashed leaf boxes

Explanation panel beside a three-level logic tree with dashed leaf boxes

Free PPTX
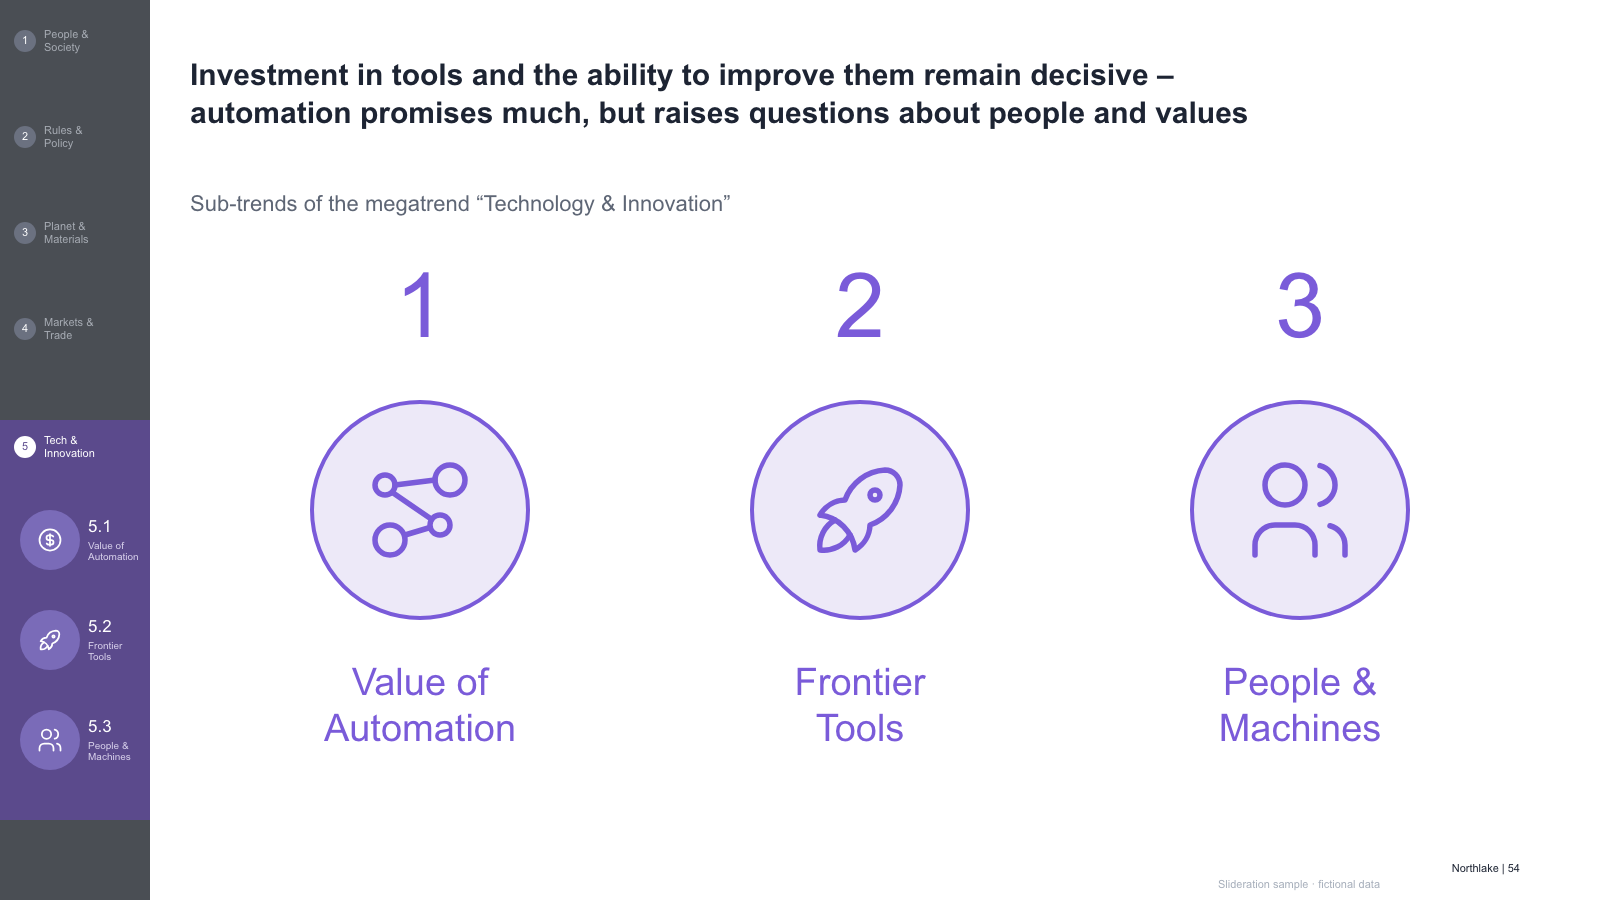
Rail with purple section, three large numbered circles with icon discs and colour titles

Rail with purple section, three large numbered circles with icon discs and colour titles

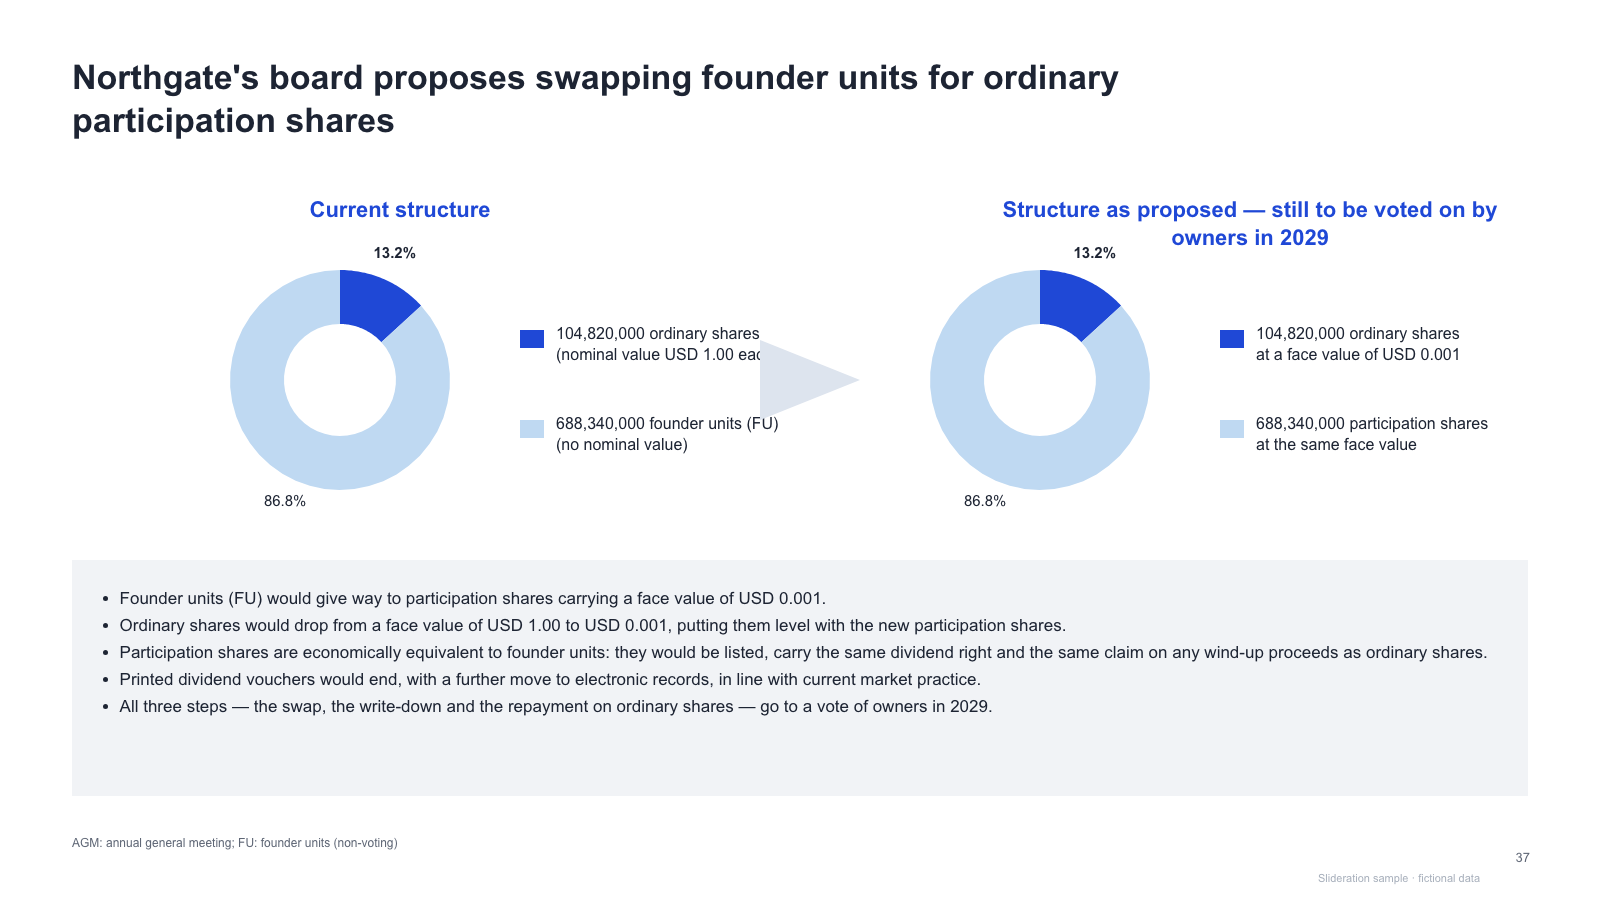
Two donut charts (current vs proposed) with legends, a wedge arrow between and bullet notes

Two donut charts (current vs proposed) with legends, a wedge arrow between and bullet notes

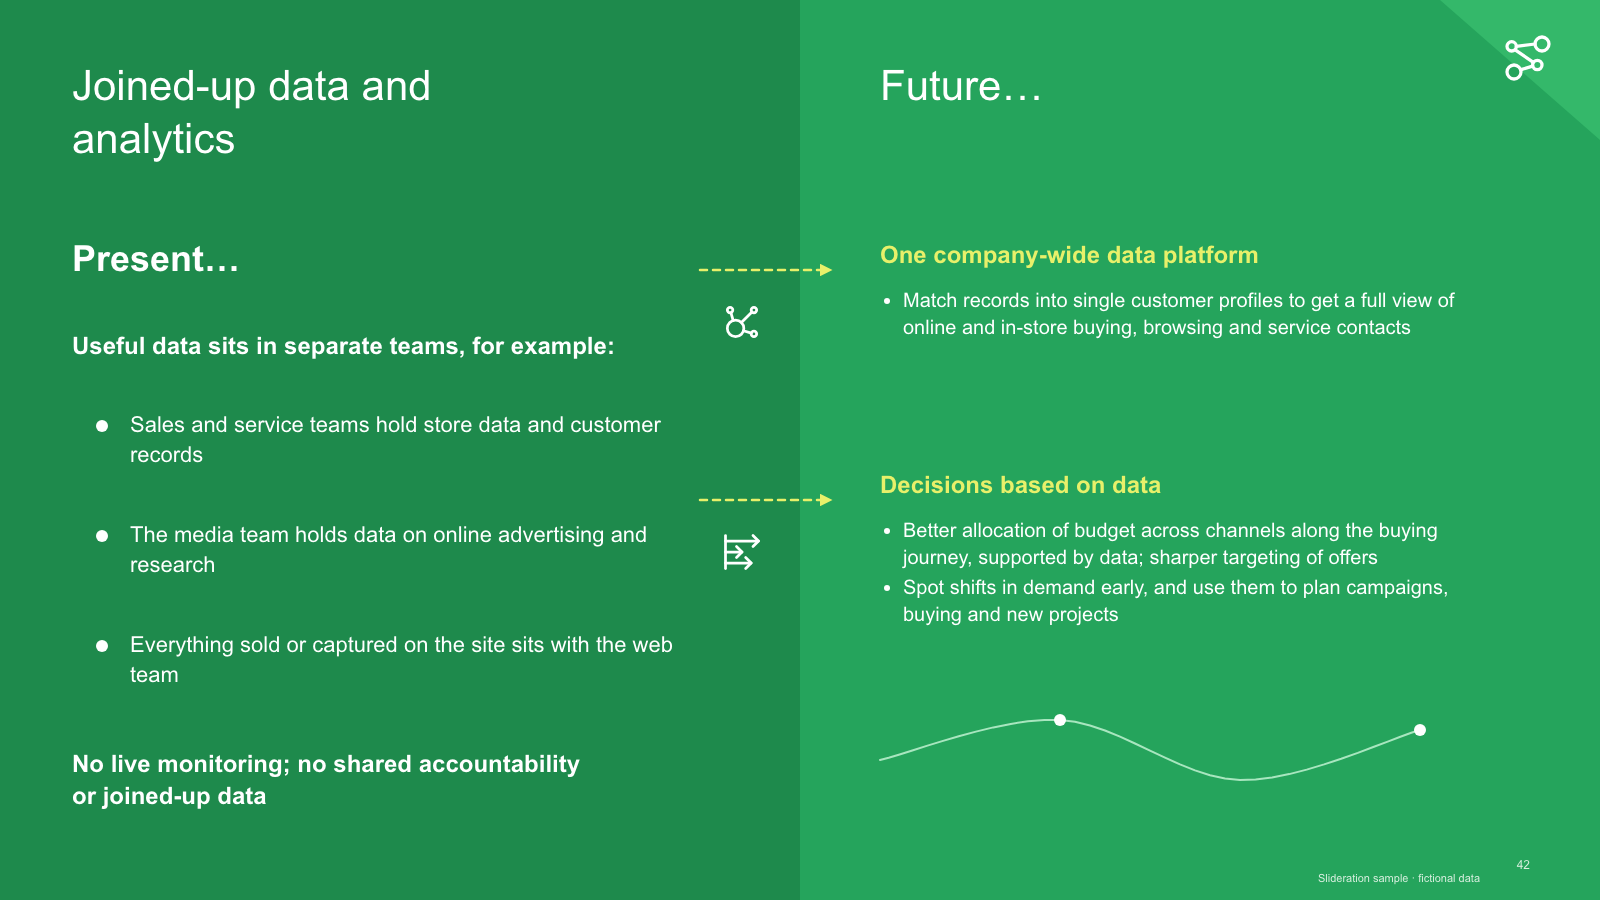
Full-colour split — present-state bullets and future-state blocks joined by dashed arrows

Full-colour split — present-state bullets and future-state blocks joined by dashed arrows

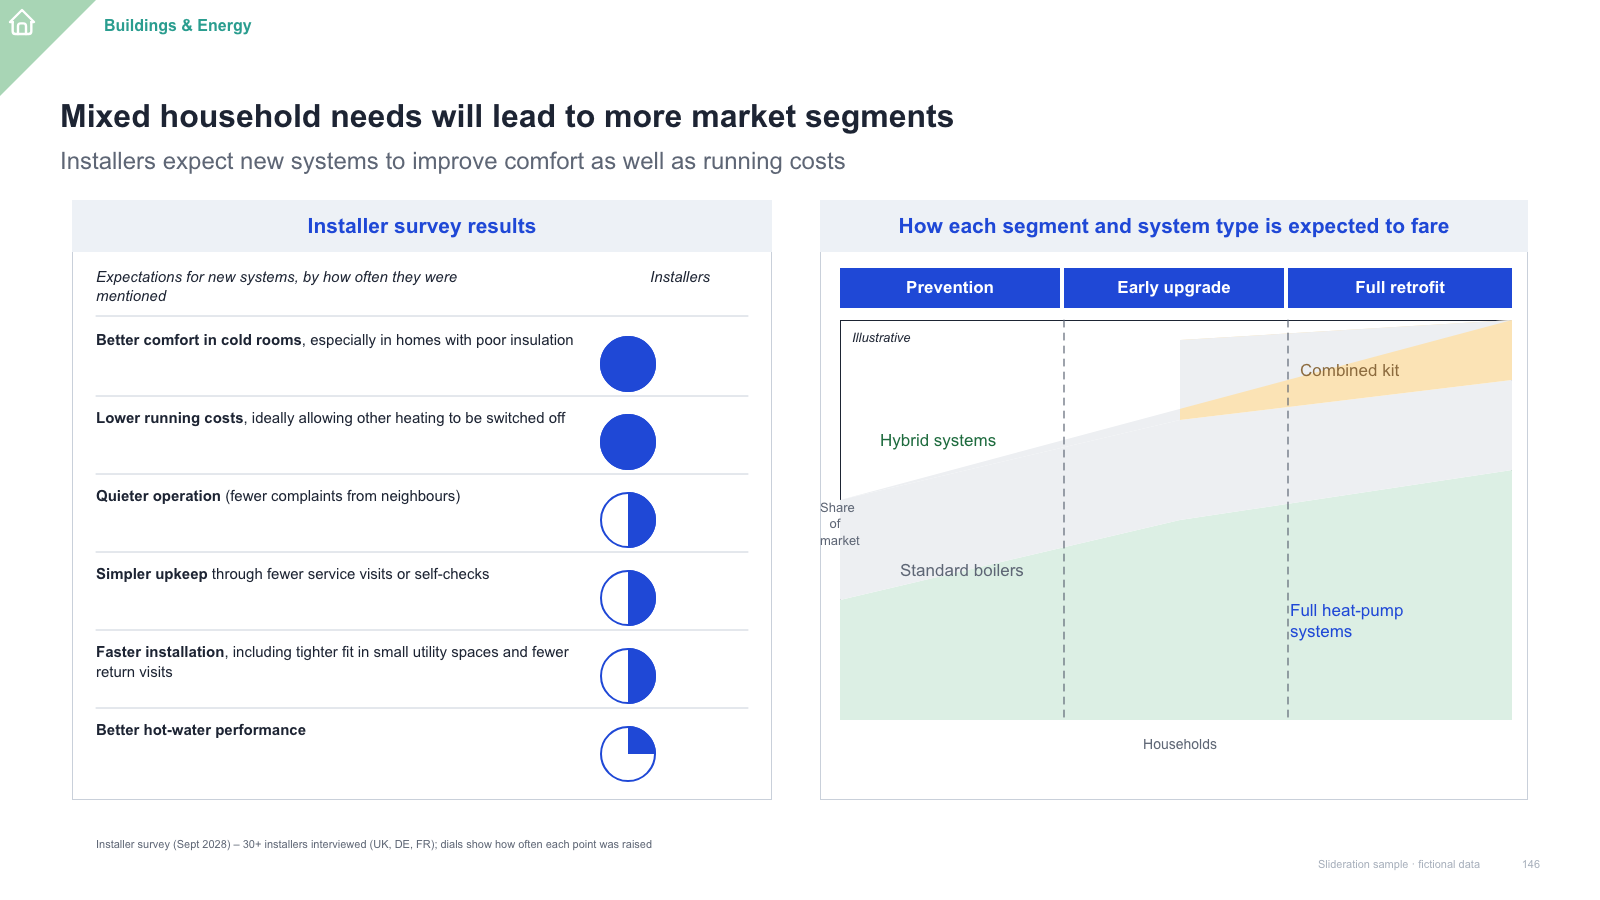
Two bordered panels — survey rows with quarter-filled dials, and a stacked area outlook chart

Two bordered panels — survey rows with quarter-filled dials, and a stacked area outlook chart

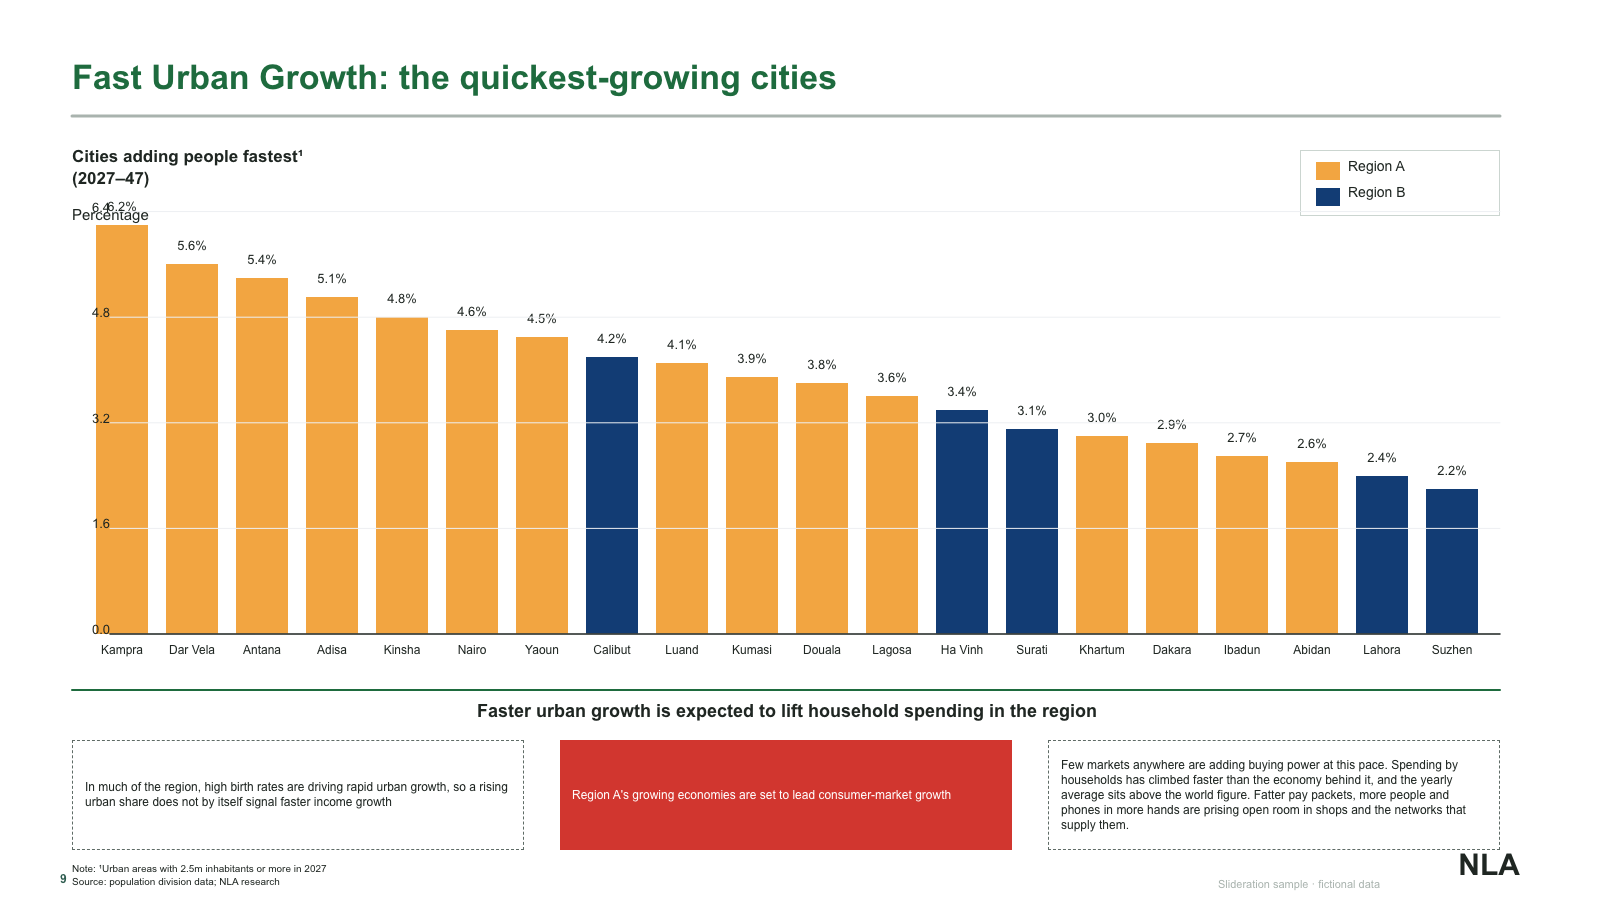
Ranked city growth bars with two-colour legend and three boxed commentary tiles

Ranked city growth bars with two-colour legend and three boxed commentary tiles

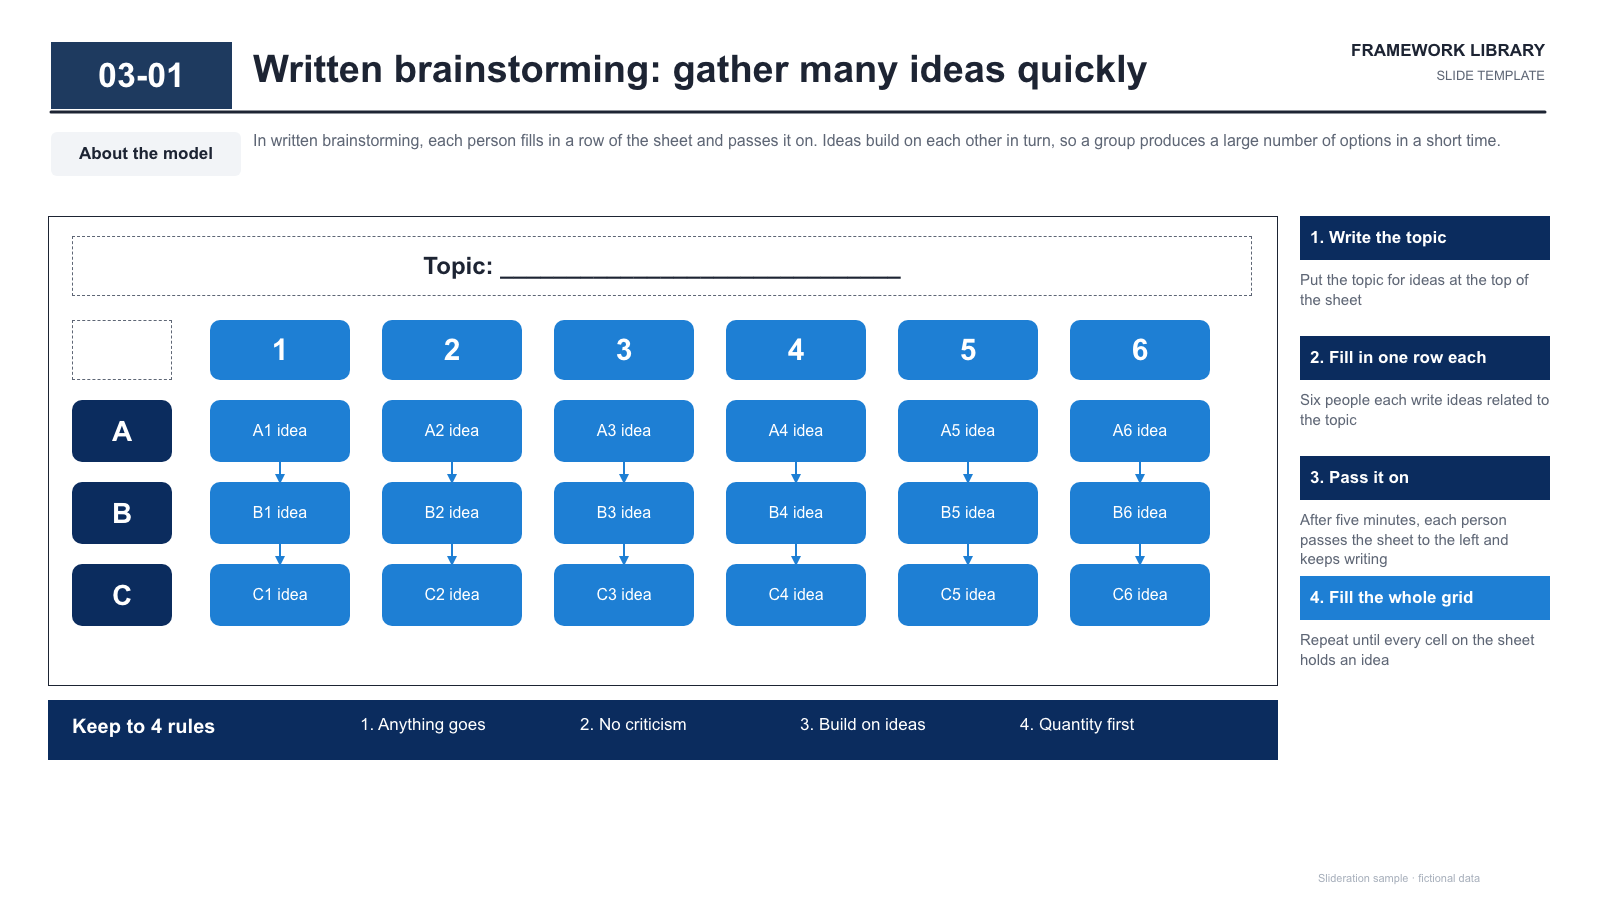
Worksheet grid of idea cells with row/column headers, a side step list and a rules strip

Worksheet grid of idea cells with row/column headers, a side step list and a rules strip

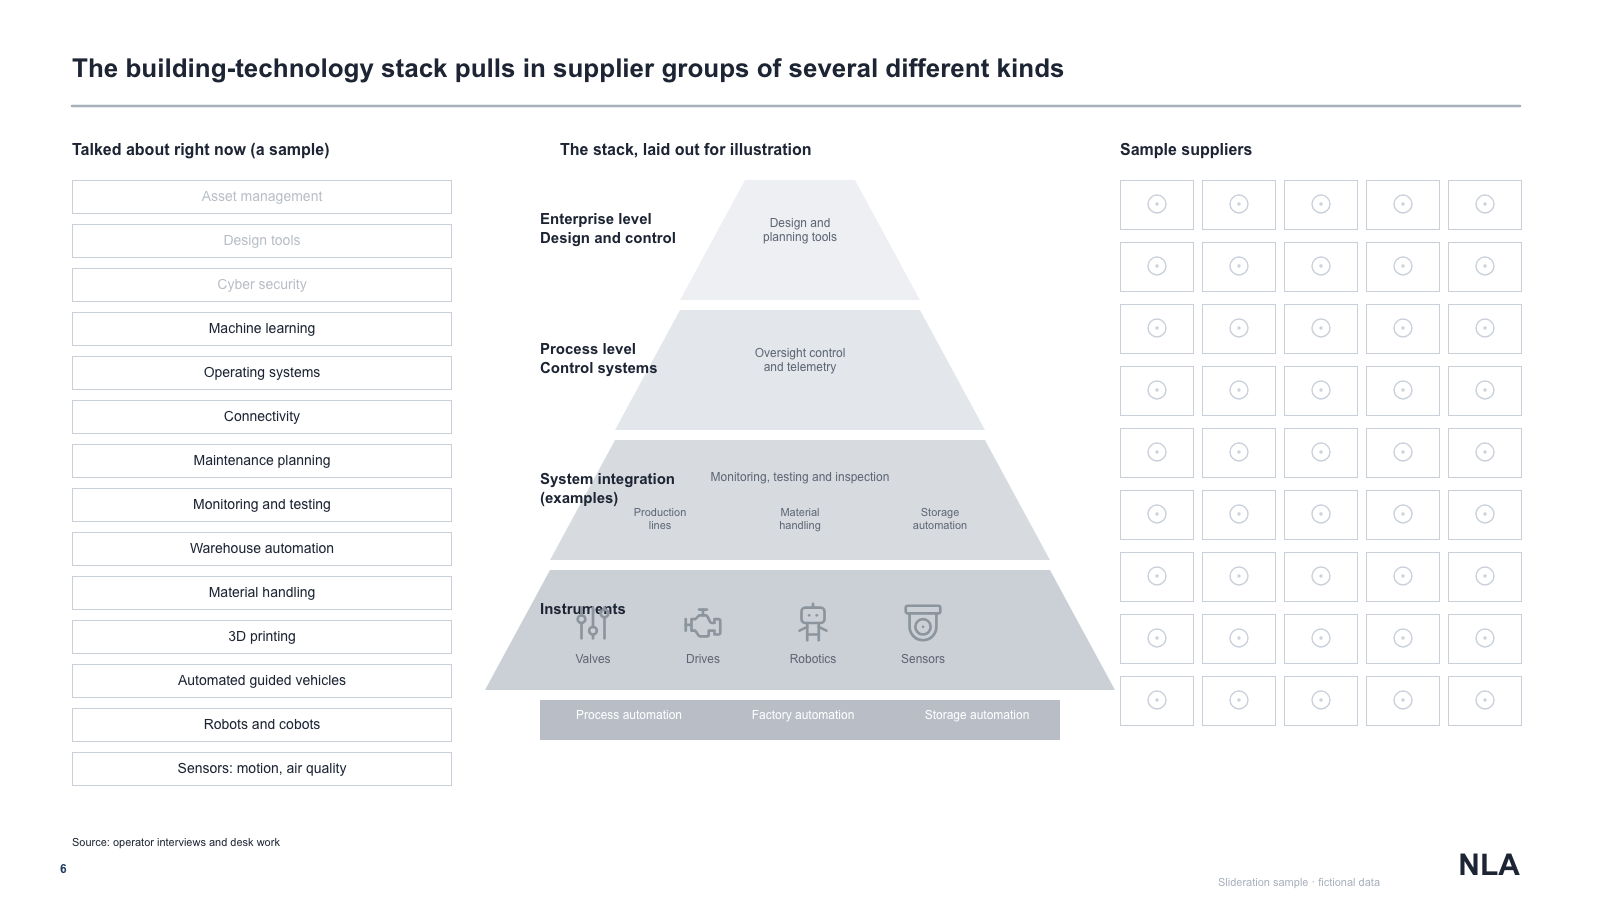
Three-column technology-stack page — topic chips, a layered pyramid and a supplier tile grid

Three-column technology-stack page — topic chips, a layered pyramid and a supplier tile grid

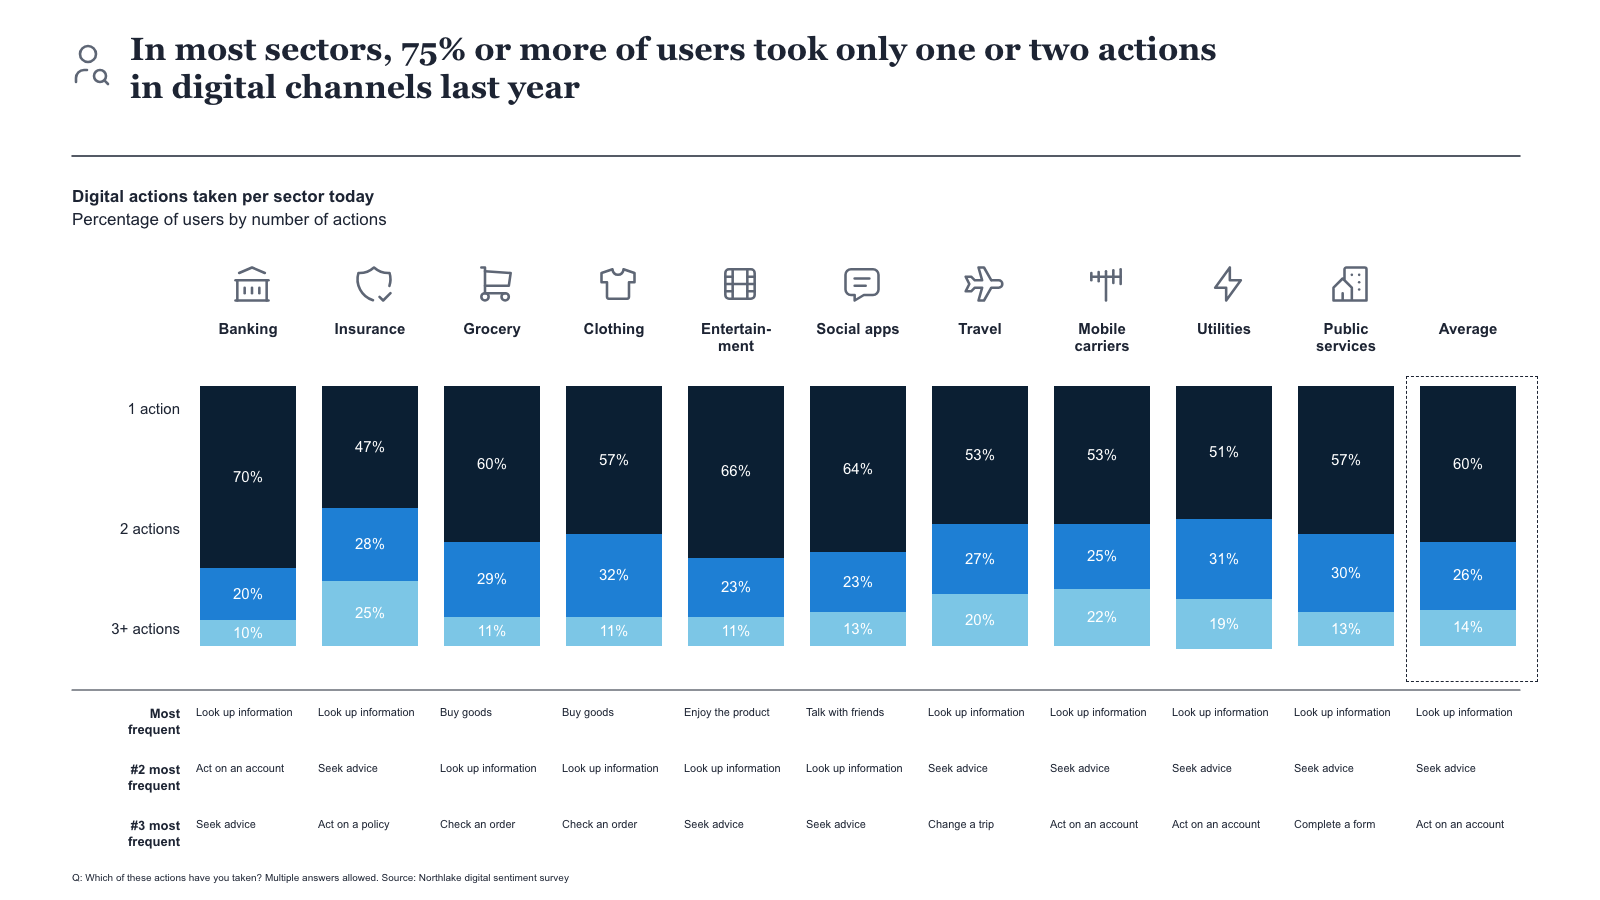
Stacked action-count columns by sector with icon headers and a three-row ranked action table

Stacked action-count columns by sector with icon headers and a three-row ranked action table

Rail, two tinted quote panels with flags, a third wide quote and a right bullet column

Rail, two tinted quote panels with flags, a third wide quote and a right bullet column

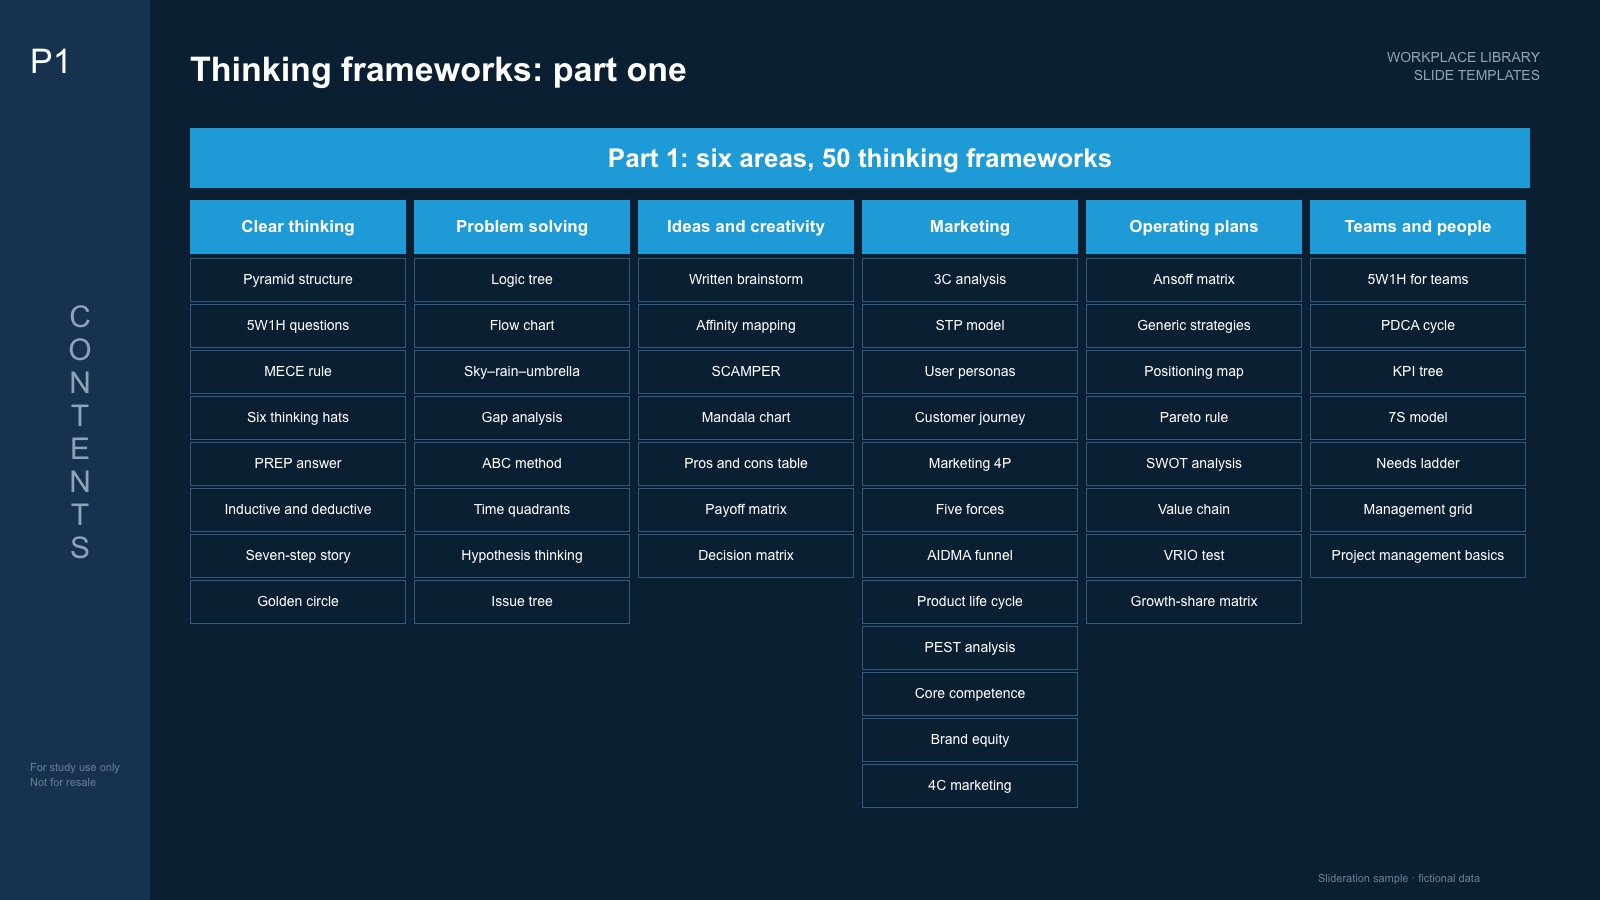
Dark contents page — six themed columns of framework names under a title band

Dark contents page — six themed columns of framework names under a title band

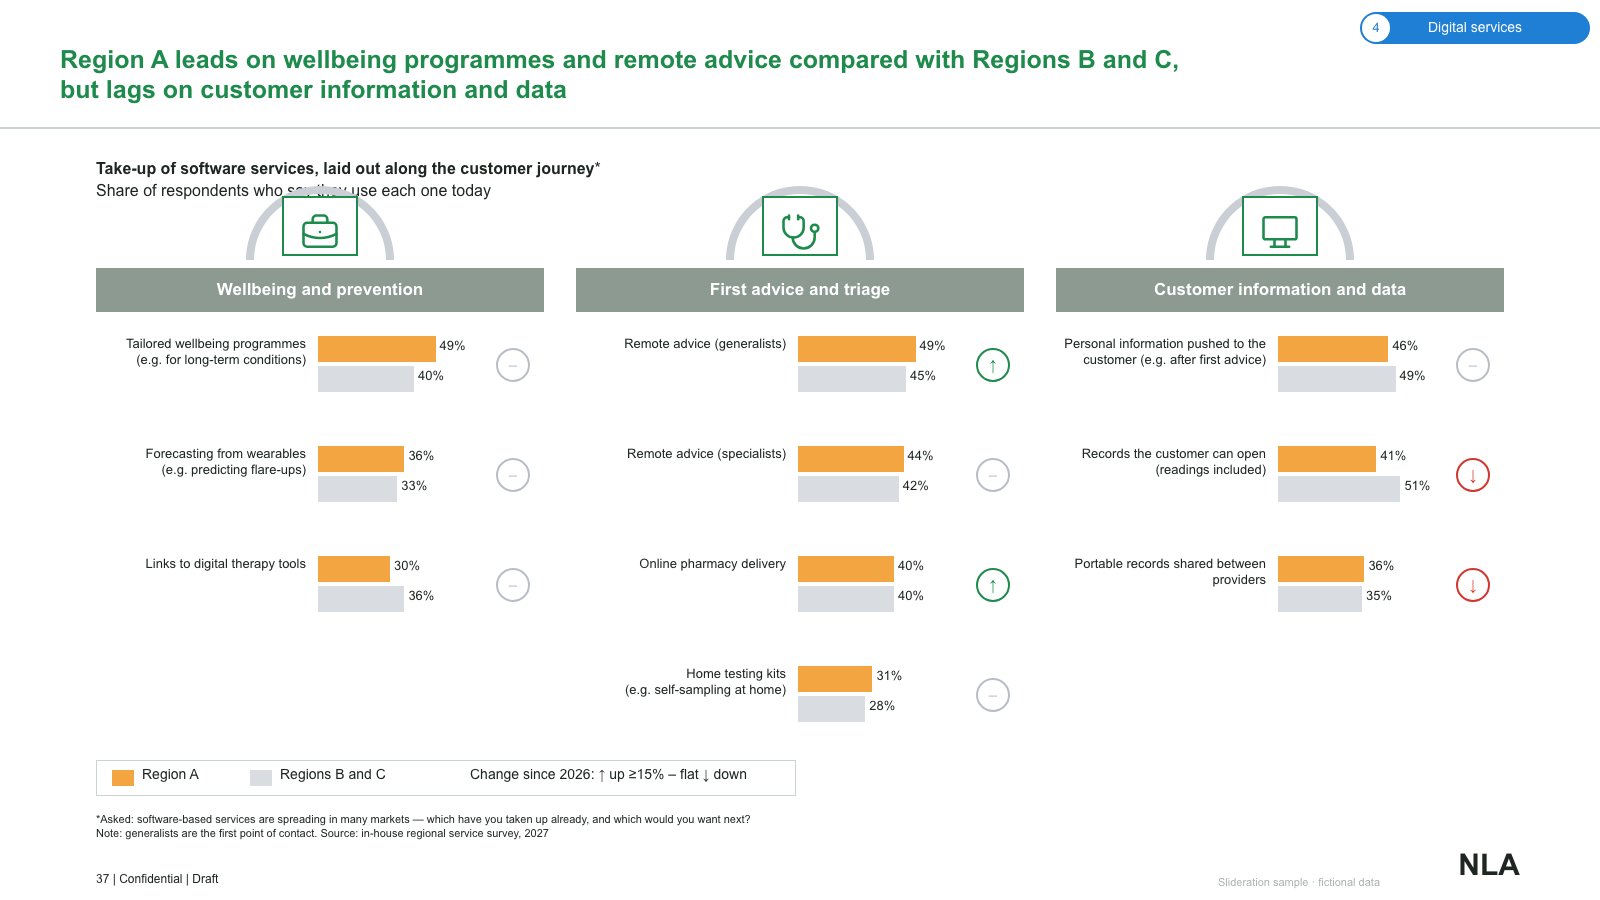
Three grouped adoption panels with arch icons, paired bars and change badges

Three grouped adoption panels with arch icons, paired bars and change badges

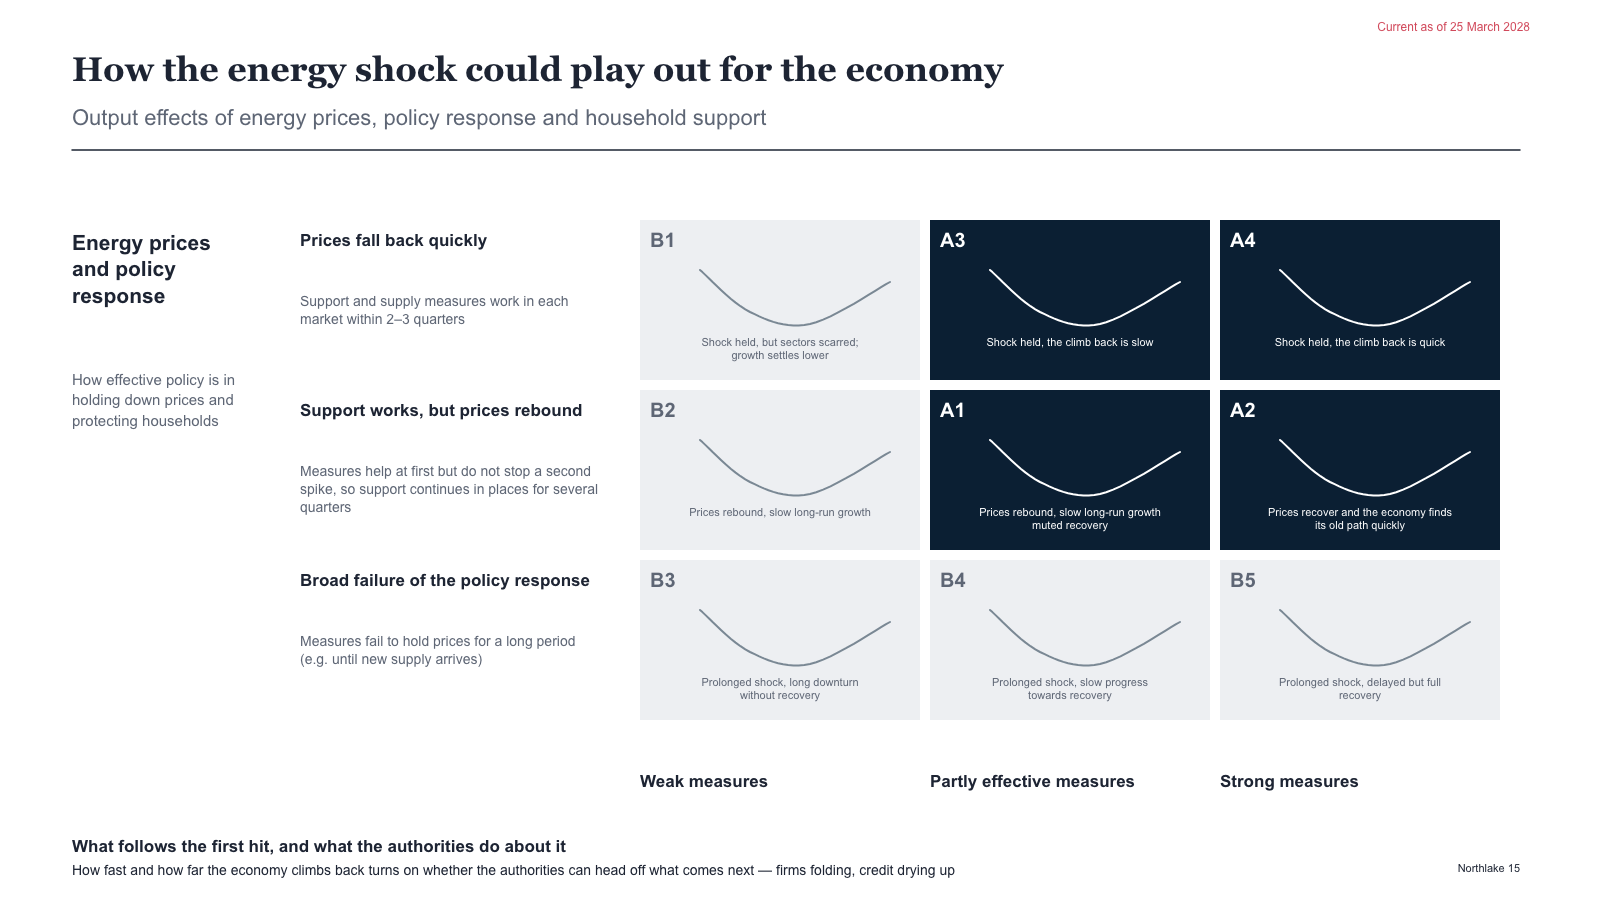
Scenario matrix — row descriptions beside a 3x3 grid of mini curve cards with column headings

Scenario matrix — row descriptions beside a 3x3 grid of mini curve cards with column headings

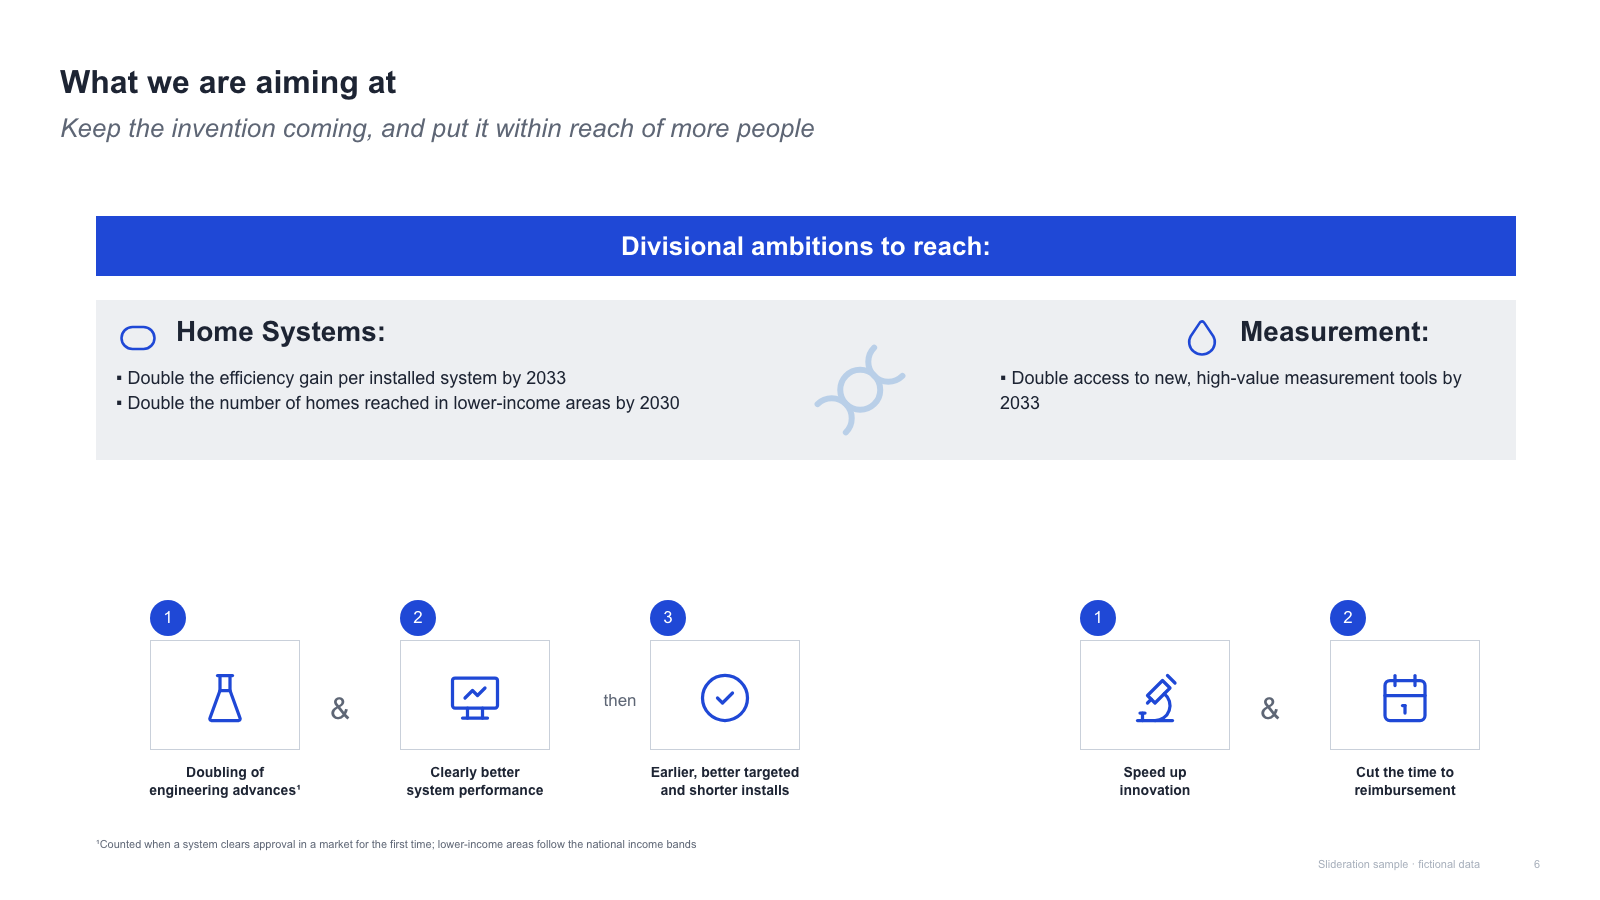
Divisional ambition banner with two wedge panels and two rows of numbered icon steps

Divisional ambition banner with two wedge panels and two rows of numbered icon steps

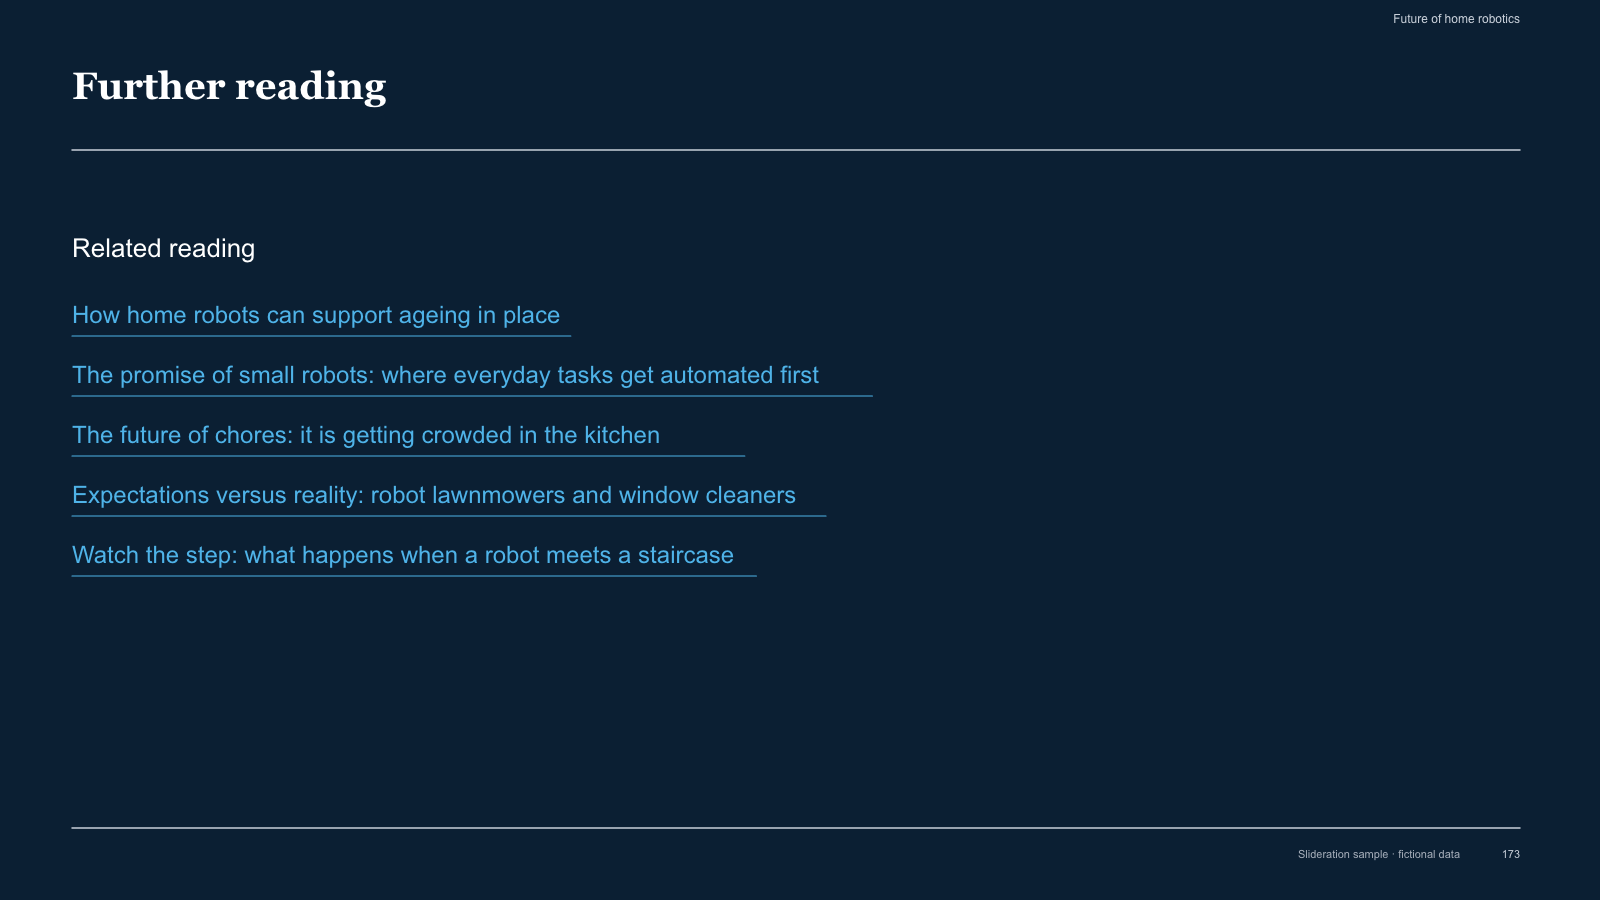
Dark resources page — heading, rule and a list of underlined link lines

Dark resources page — heading, rule and a list of underlined link lines

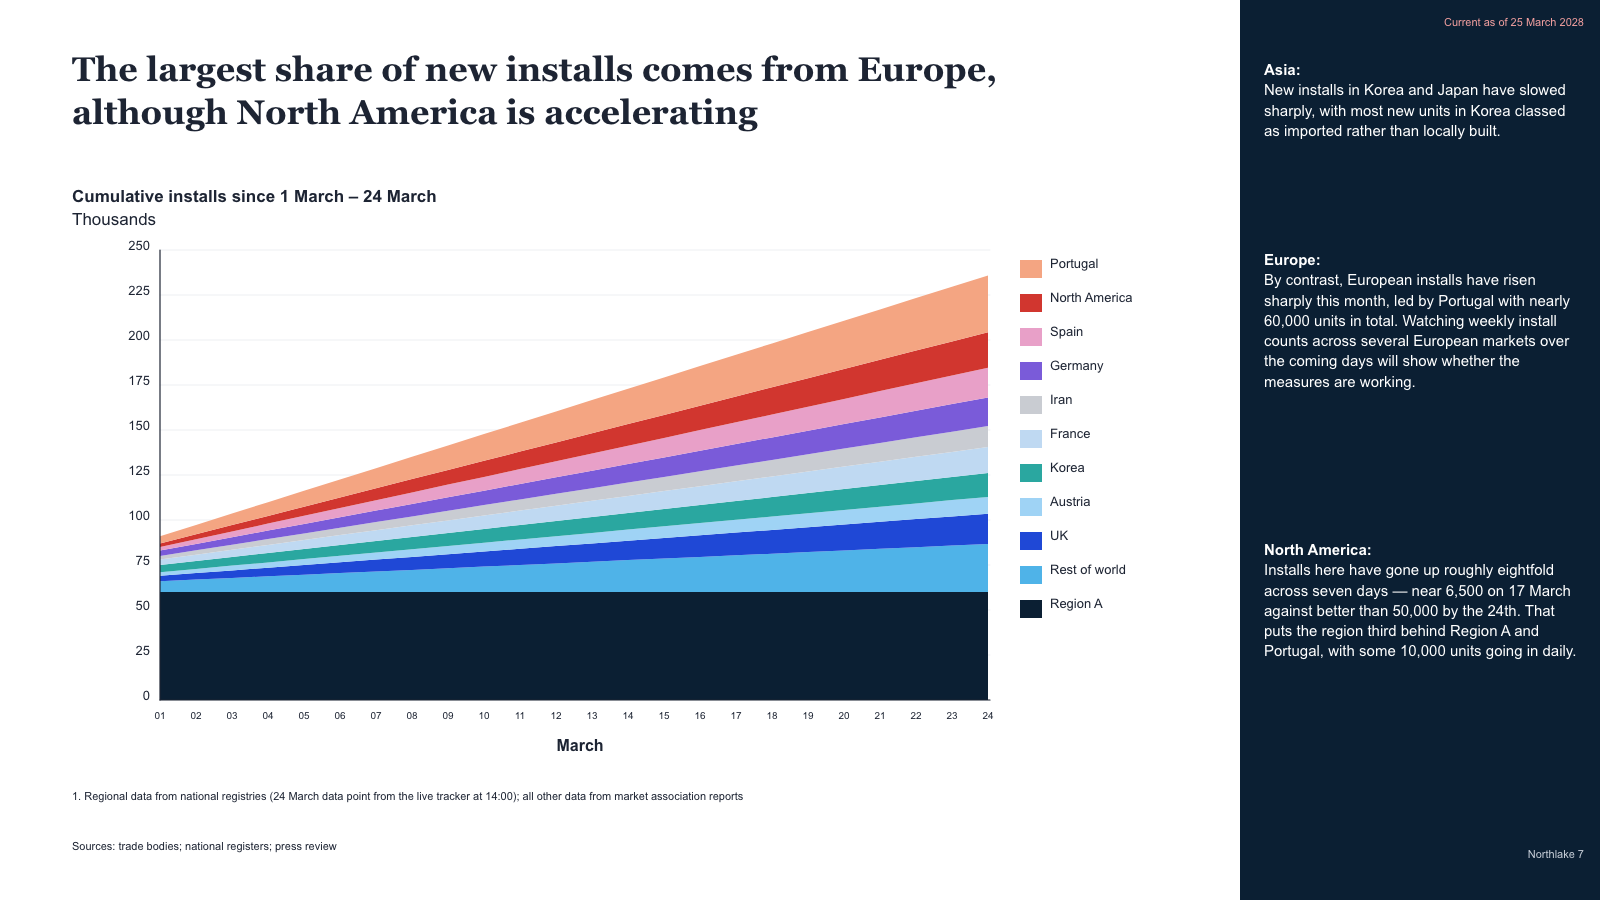
Stacked area chart of cumulative volumes with a market legend and a dark commentary sidebar

Stacked area chart of cumulative volumes with a market legend and a dark commentary sidebar

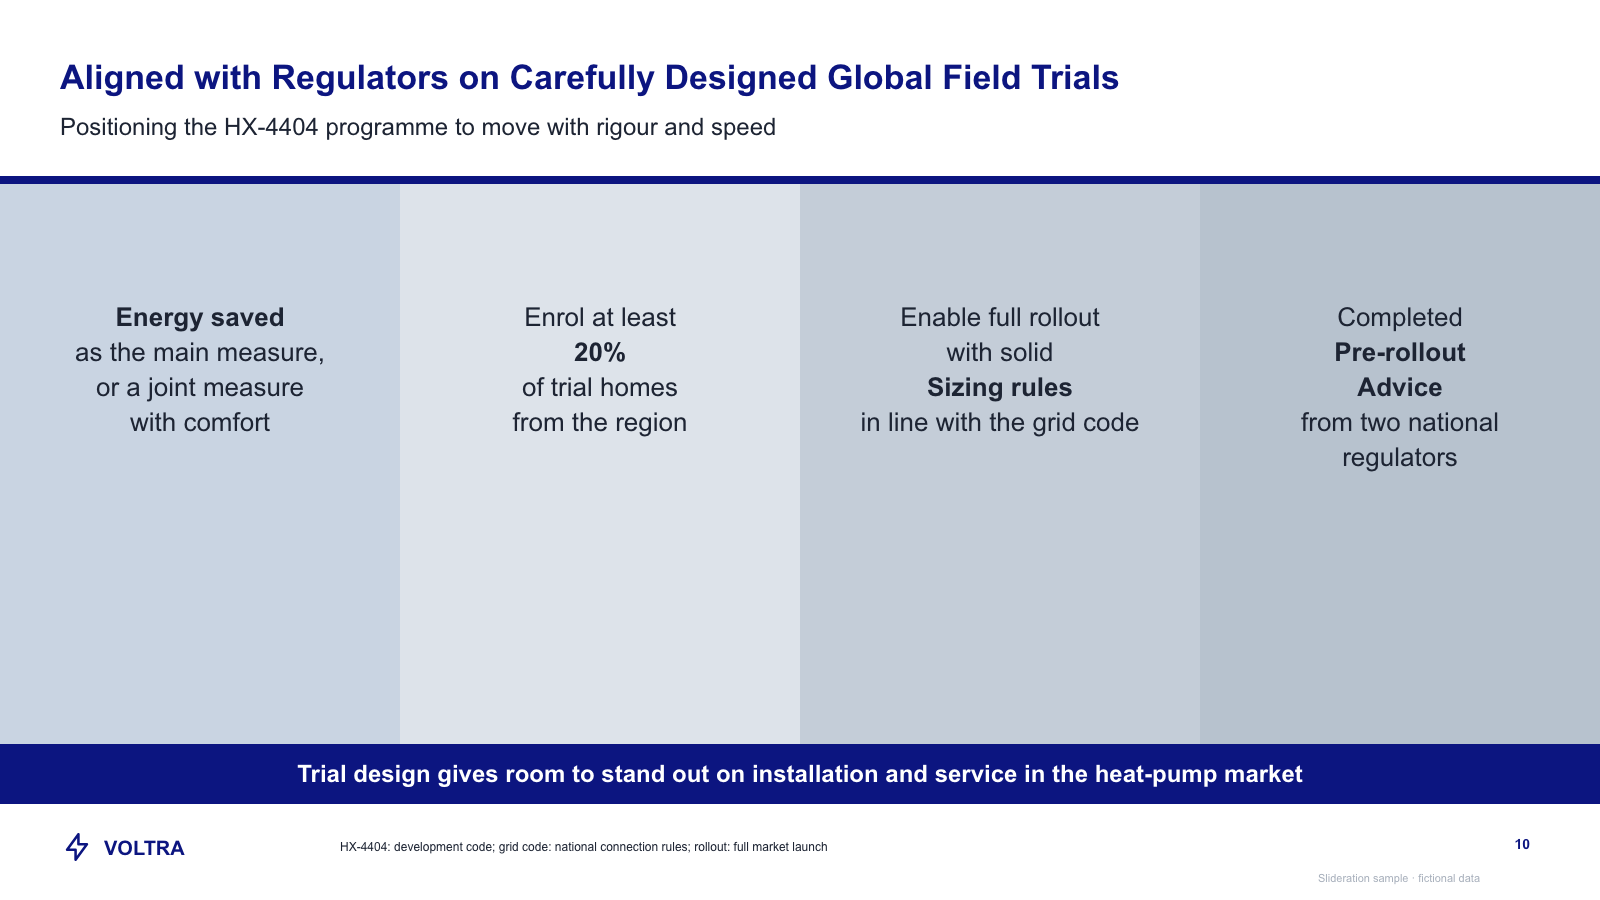
Four tinted image-style panels with large statements over a full-width conclusion bar

Four tinted image-style panels with large statements over a full-width conclusion bar

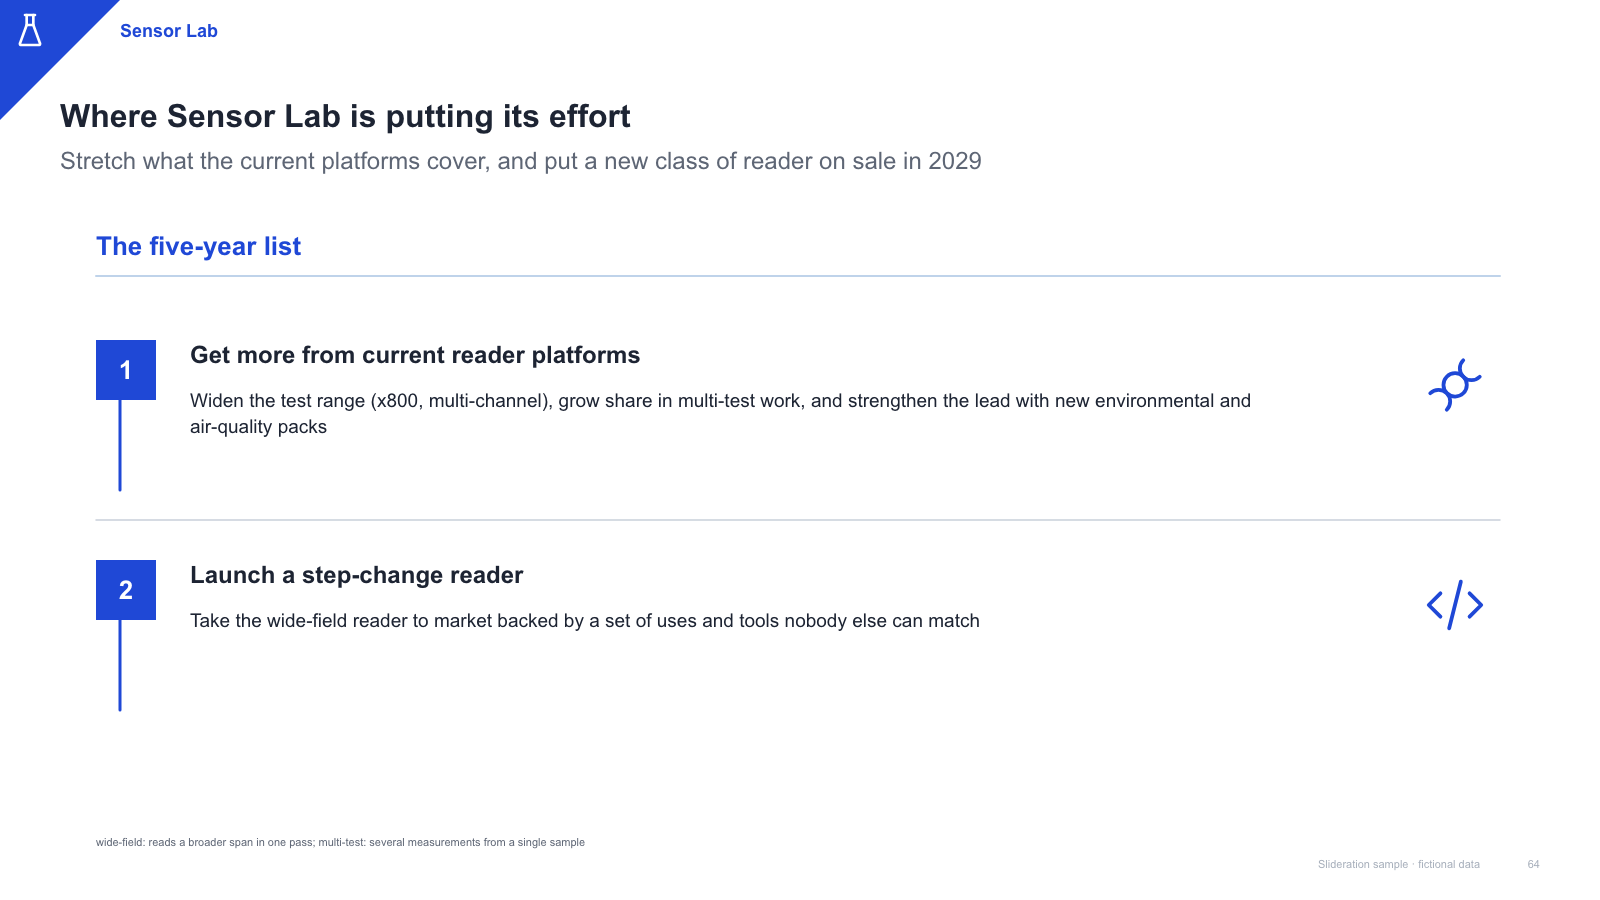
Corner tag, blue section heading and two numbered priority rows with side icons

Corner tag, blue section heading and two numbered priority rows with side icons

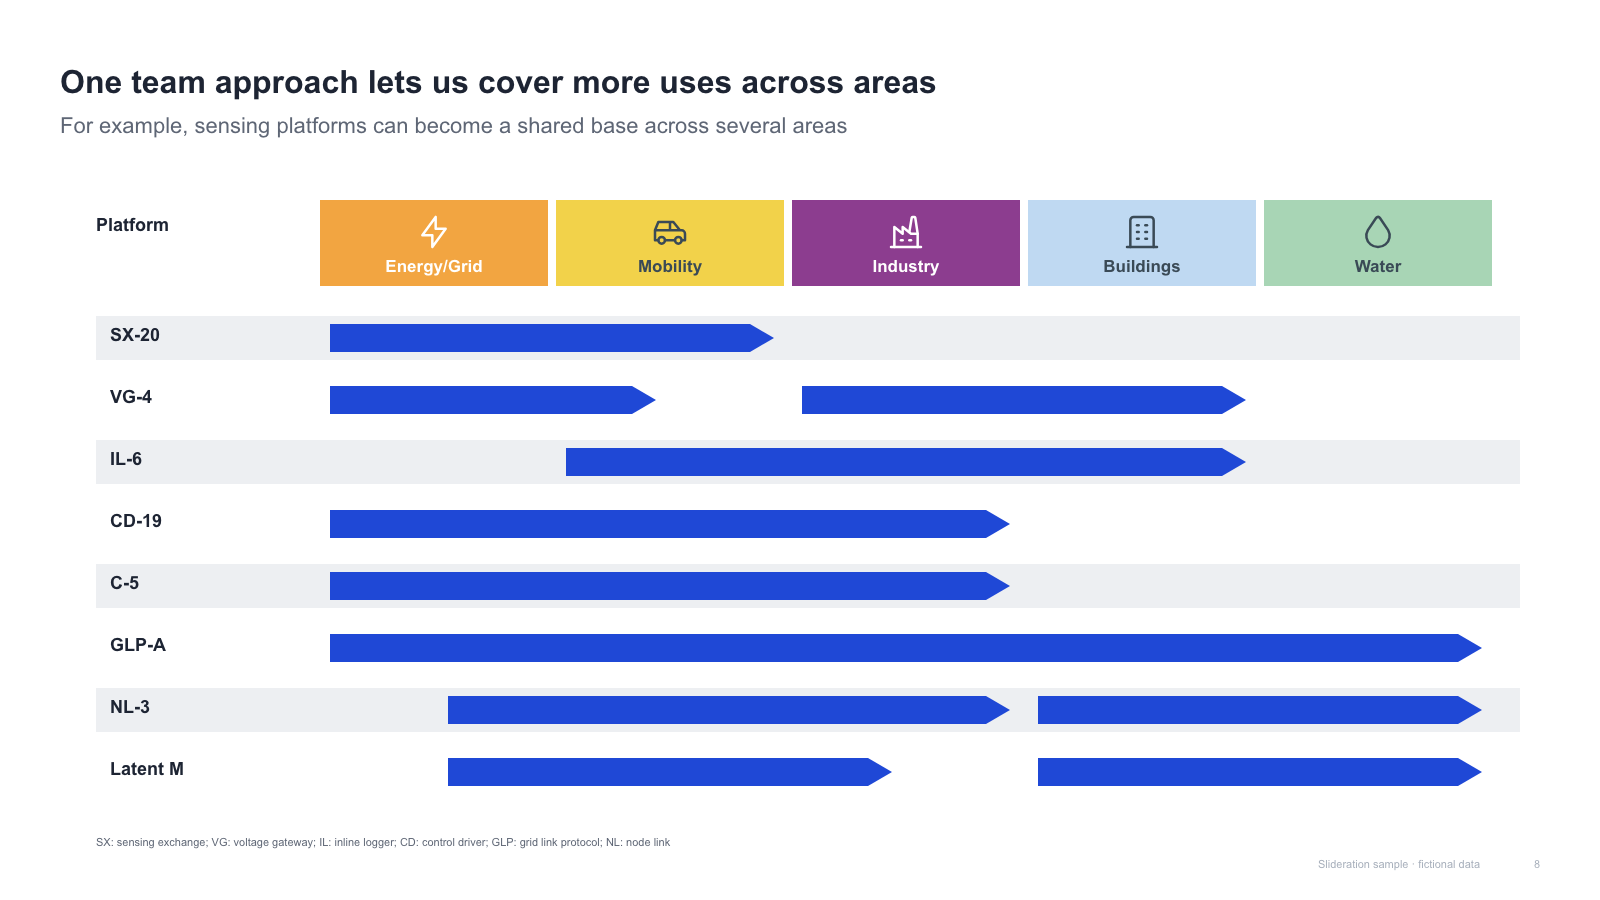
Target-by-area matrix — coloured area headers with icons and bar ranges per target row

Target-by-area matrix — coloured area headers with icons and bar ranges per target row

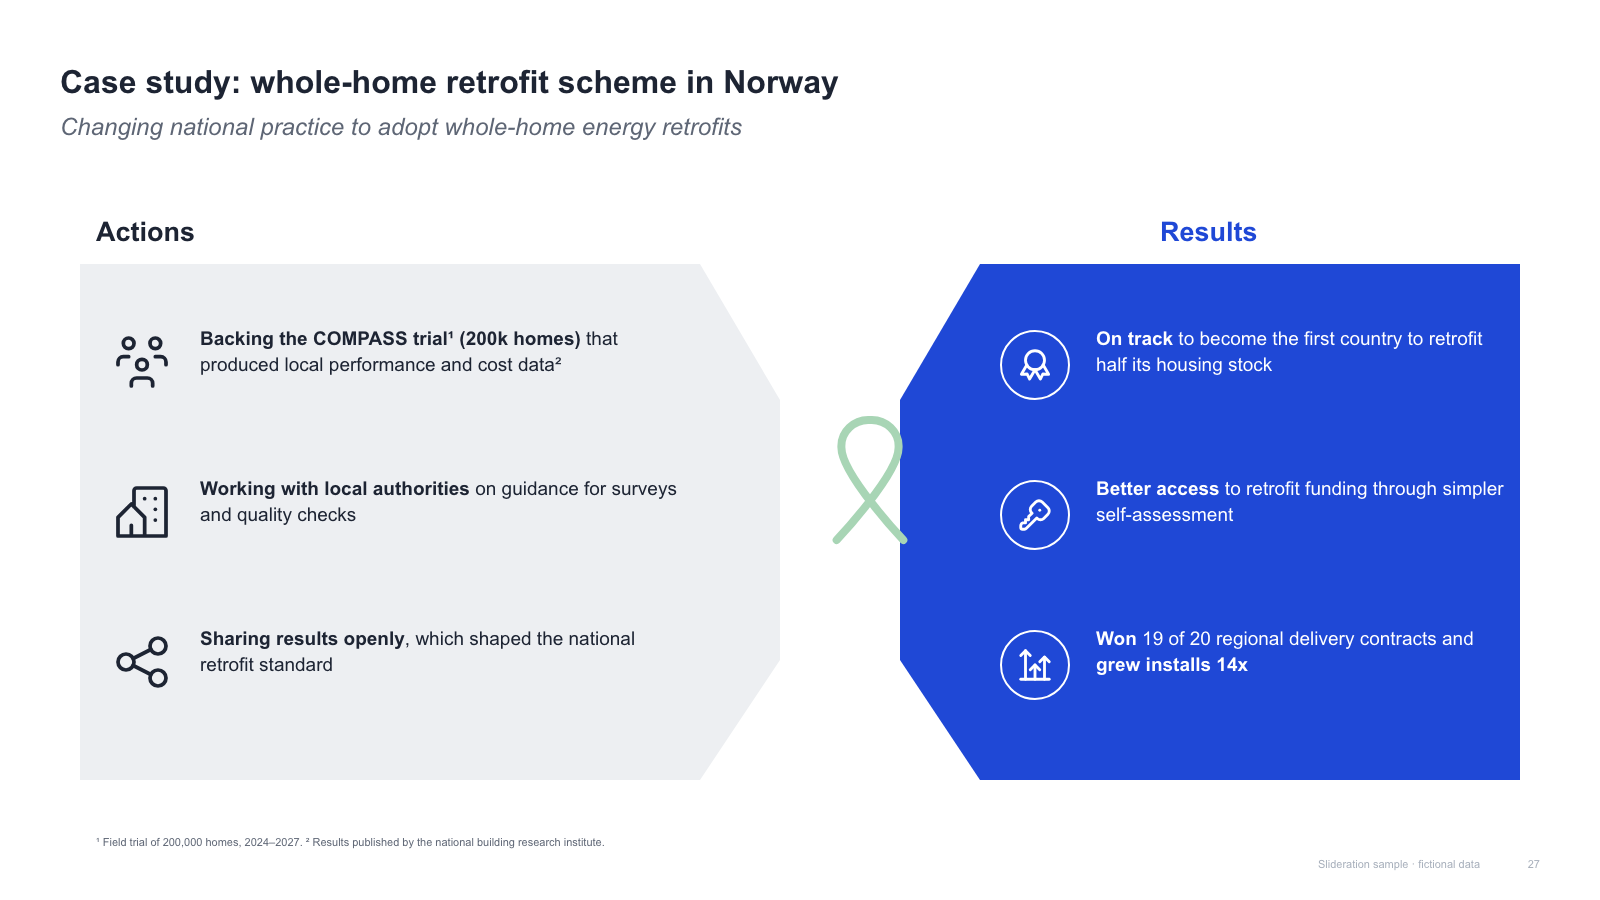
Actions panel with icon rows, a ribbon emblem and a blue results panel with badge icons

Actions panel with icon rows, a ribbon emblem and a blue results panel with badge icons

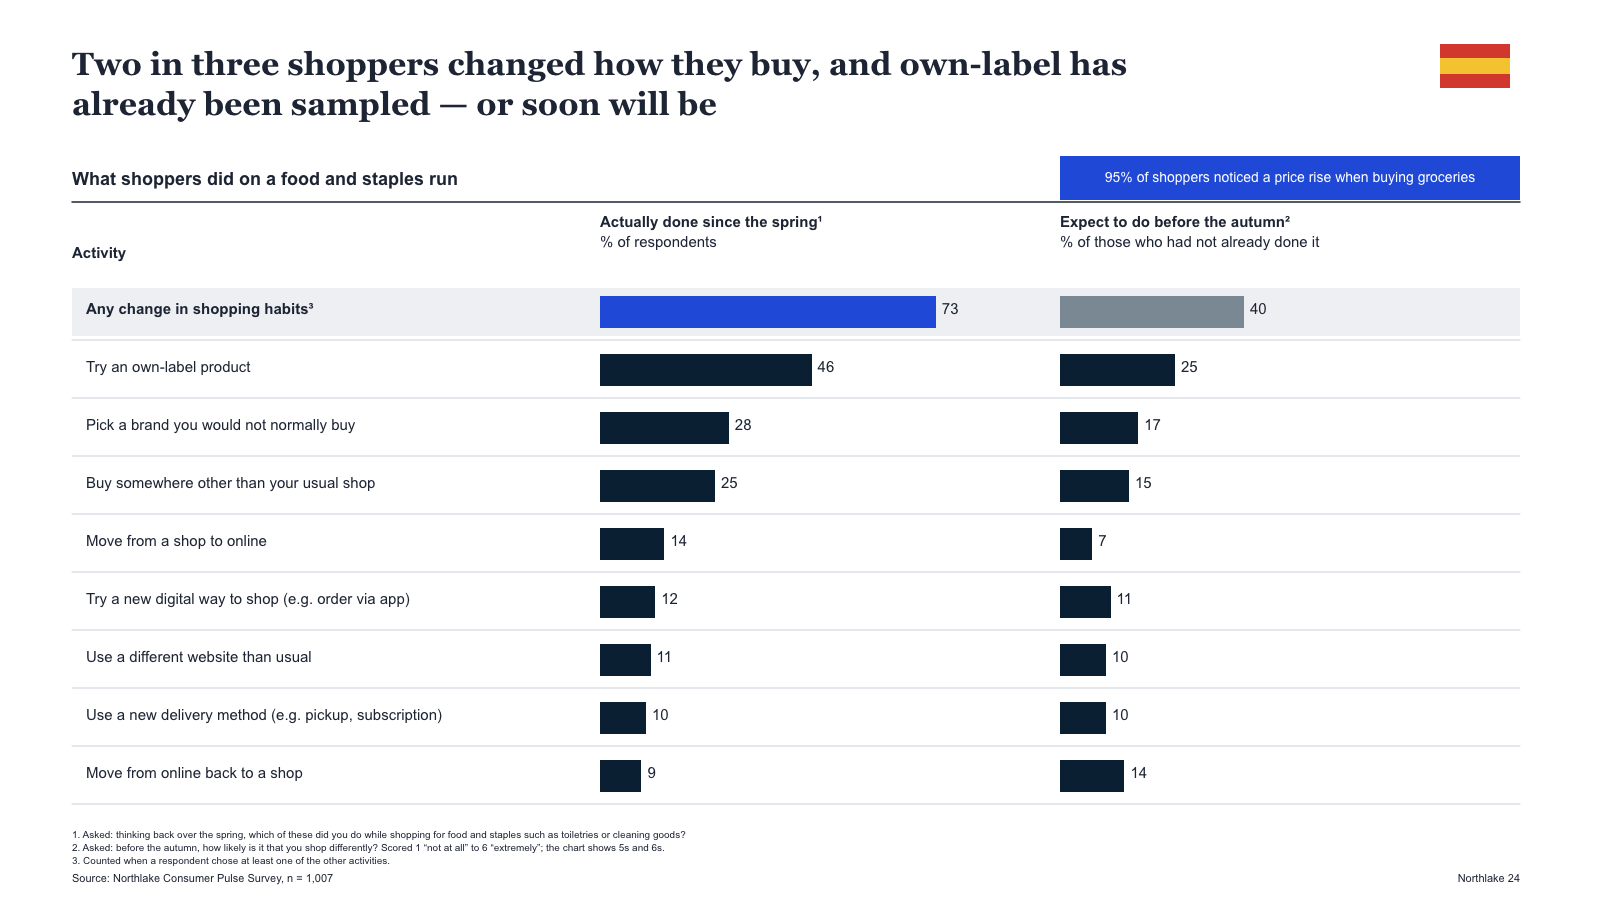
Activity table with two bar columns (done vs planned), a highlight row and a callout box

Activity table with two bar columns (done vs planned), a highlight row and a callout box

Three-tier pyramid with bracketed groupings and a right-hand explanation column

Three-tier pyramid with bracketed groupings and a right-hand explanation column

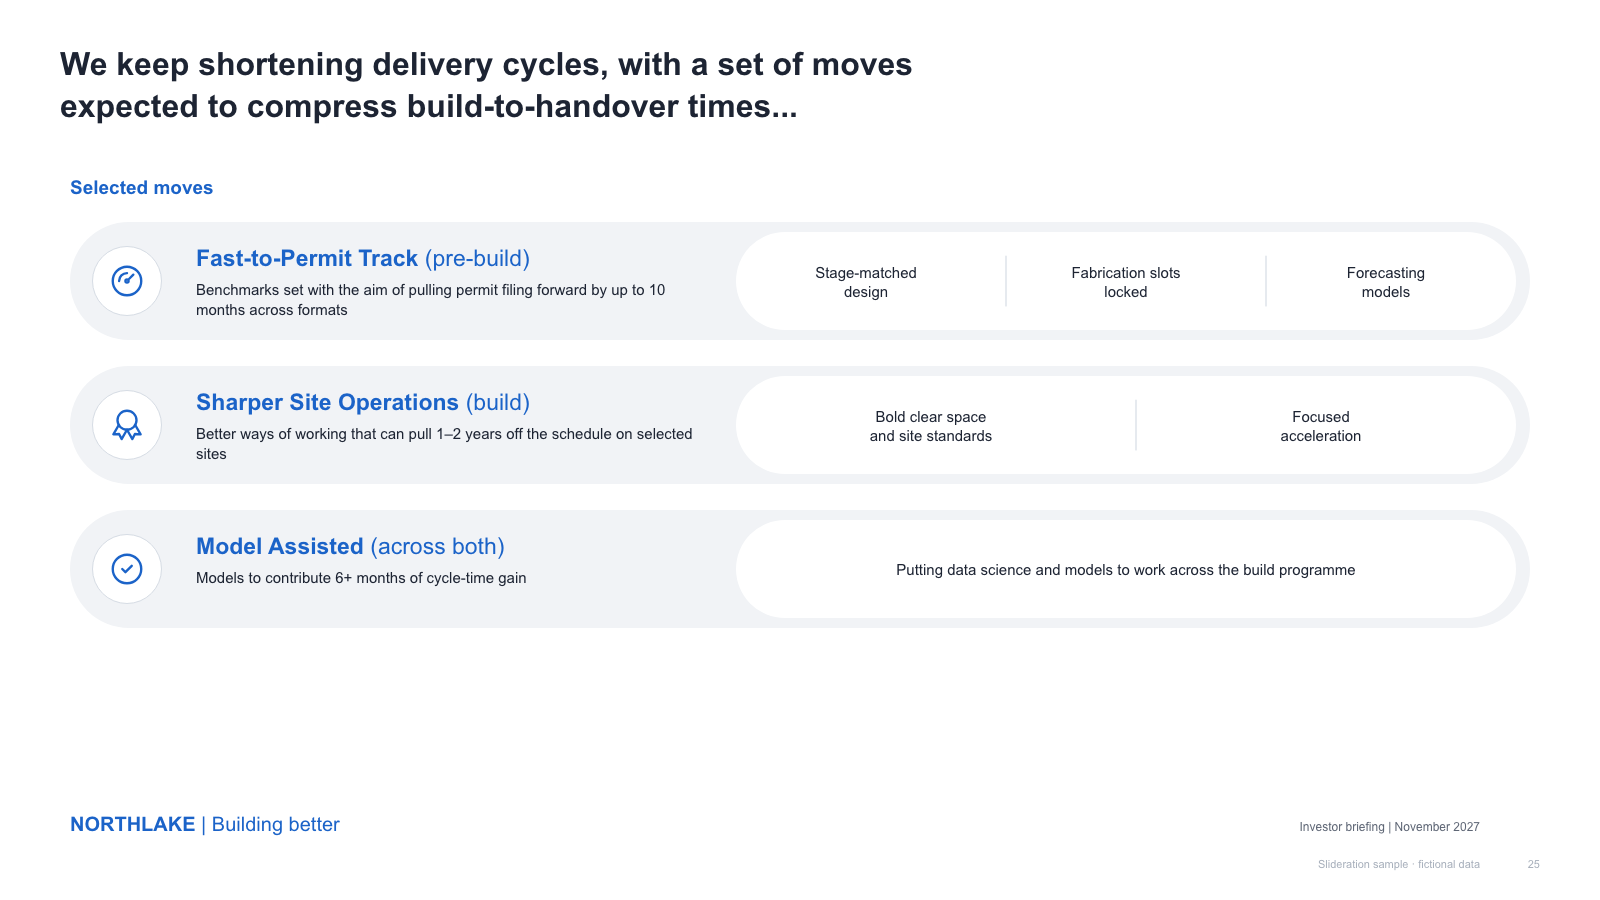
Three rounded initiative pills — icon disc, coloured title and a divided detail capsule on the right

Three rounded initiative pills — icon disc, coloured title and a divided detail capsule on the right

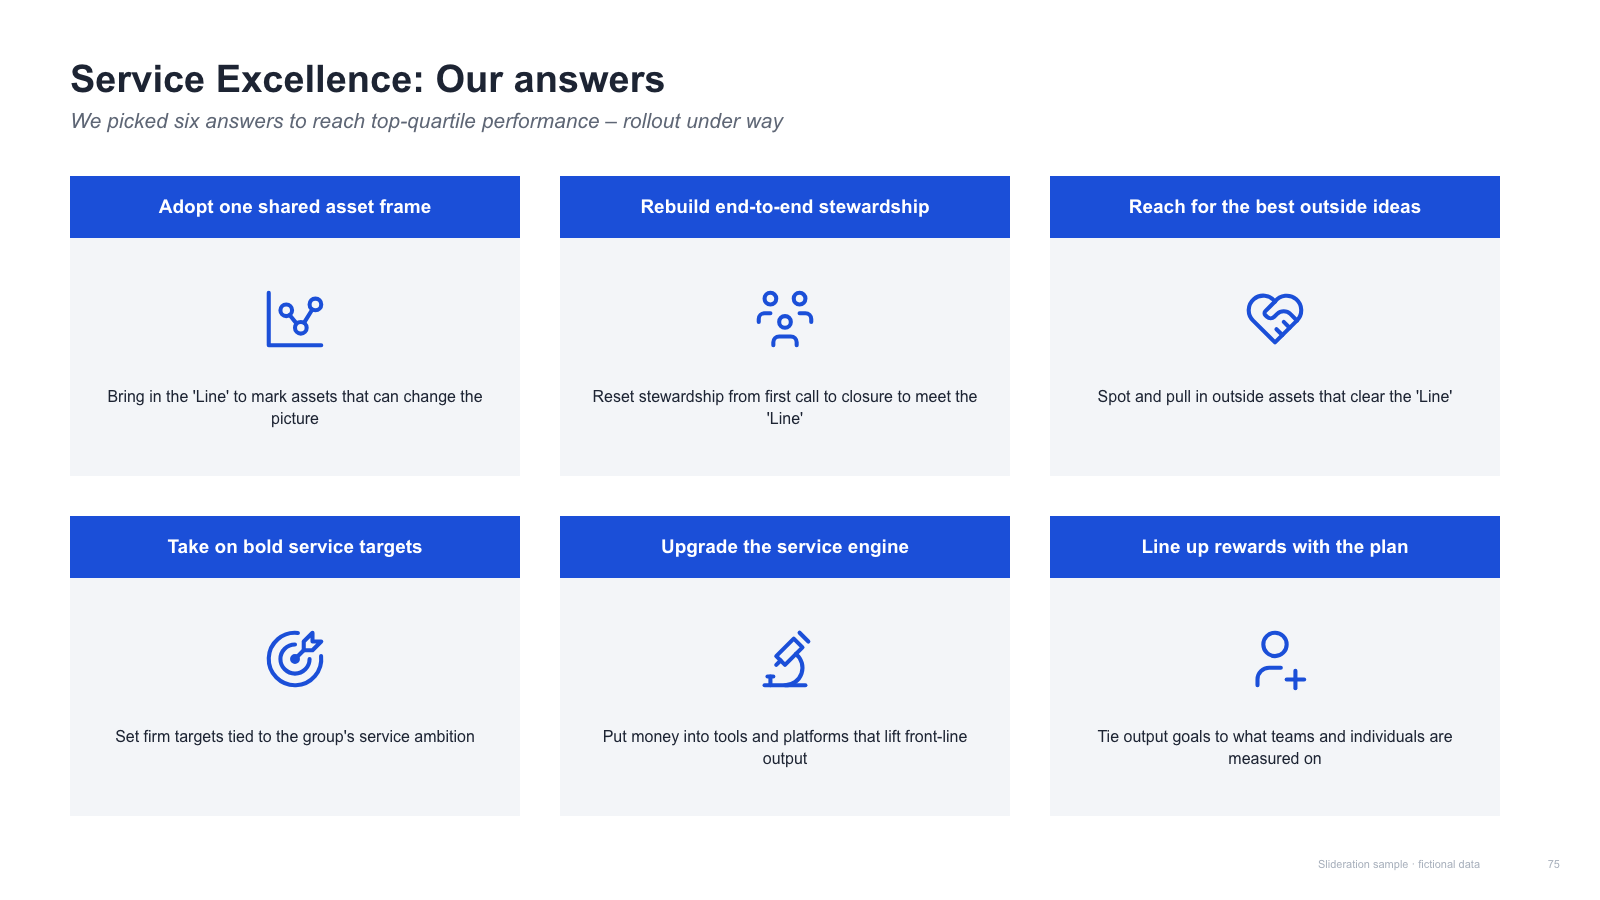
Two rows of three solution cards — blue header bar, centred line icon and a caption line

Two rows of three solution cards — blue header bar, centred line icon and a caption line

Three columns, each a circular icon badge over a coloured header block and a bullet list

Three columns, each a circular icon badge over a coloured header block and a bullet list

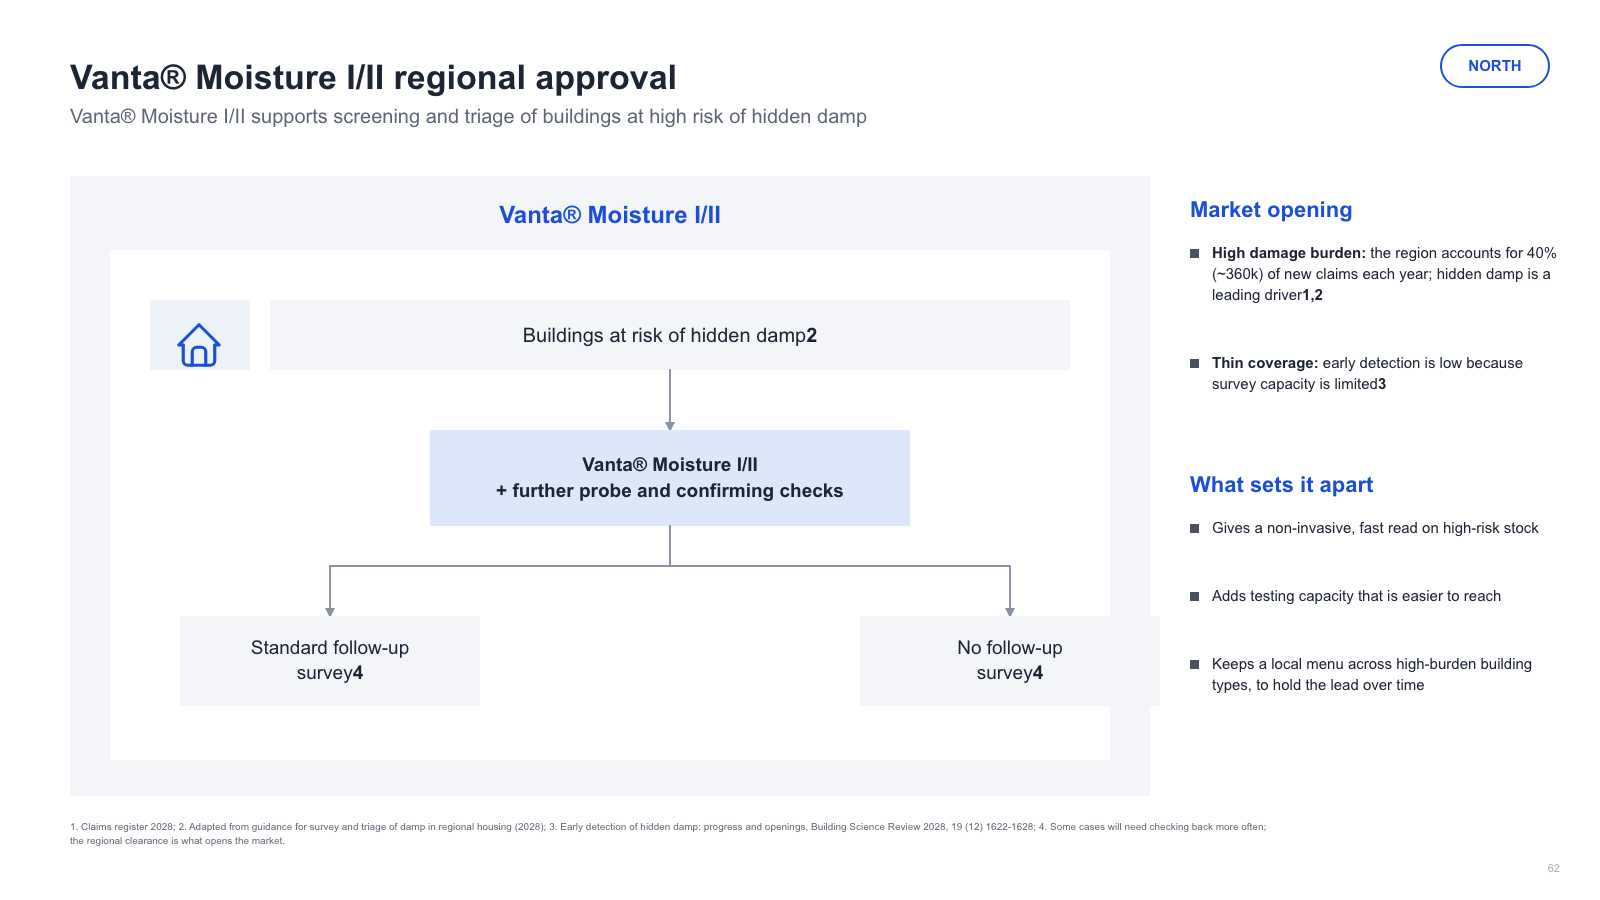
Grey panel holding a four-box screening flow beside a right column of headed bullet groups

Grey panel holding a four-box screening flow beside a right column of headed bullet groups

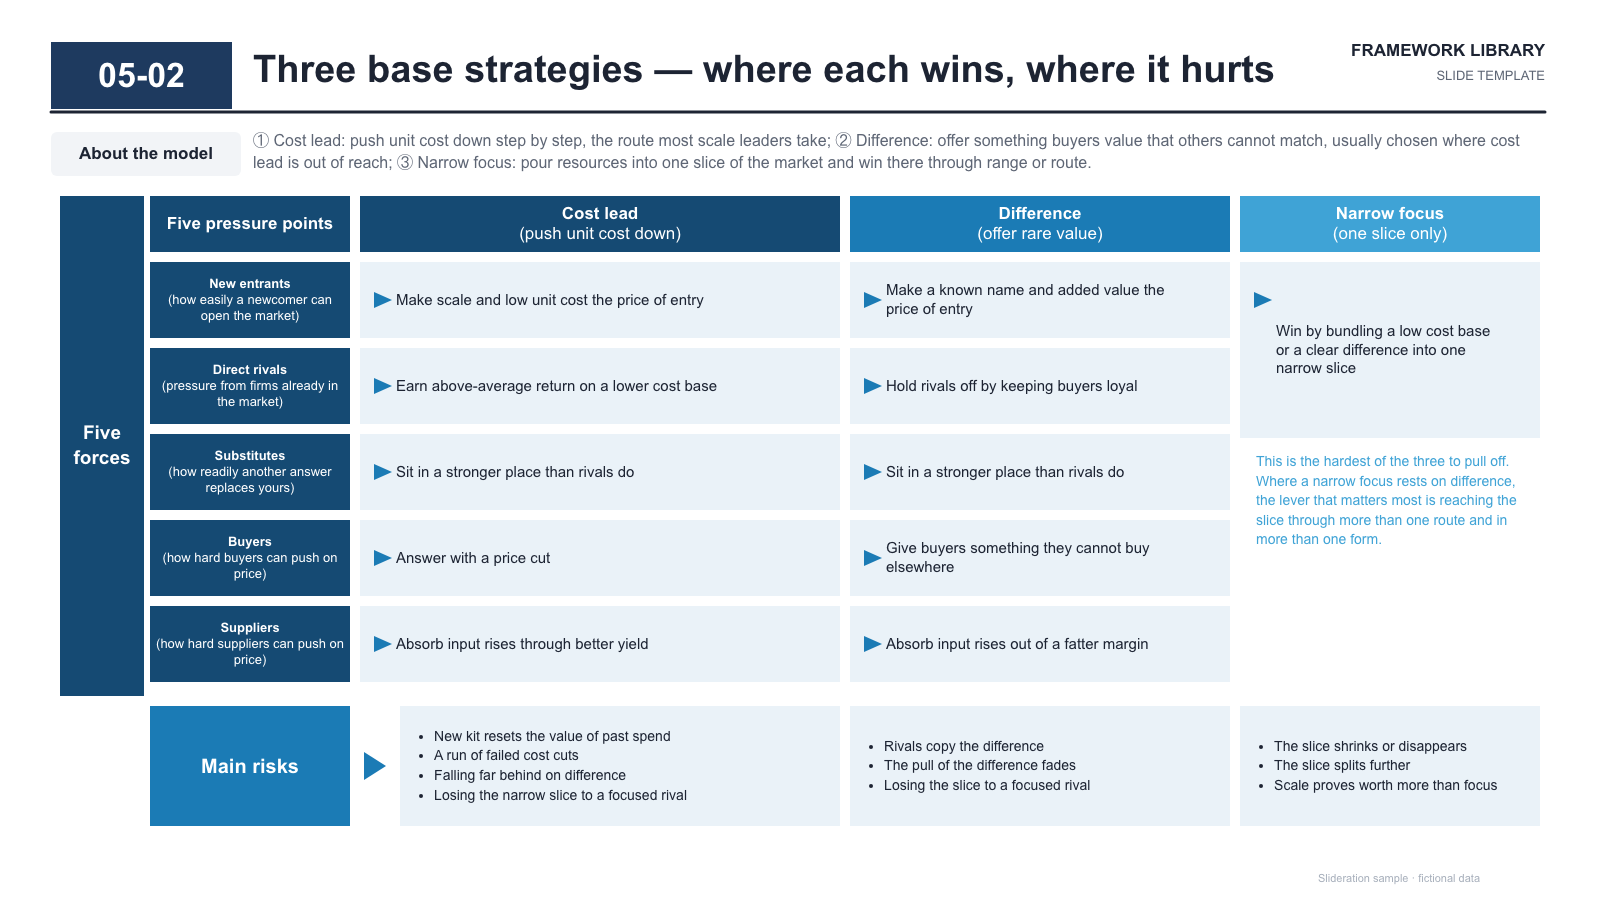
Framework page — force rows on a dark rail beside three strategy columns over a risks band

Framework page — force rows on a dark rail beside three strategy columns over a risks band

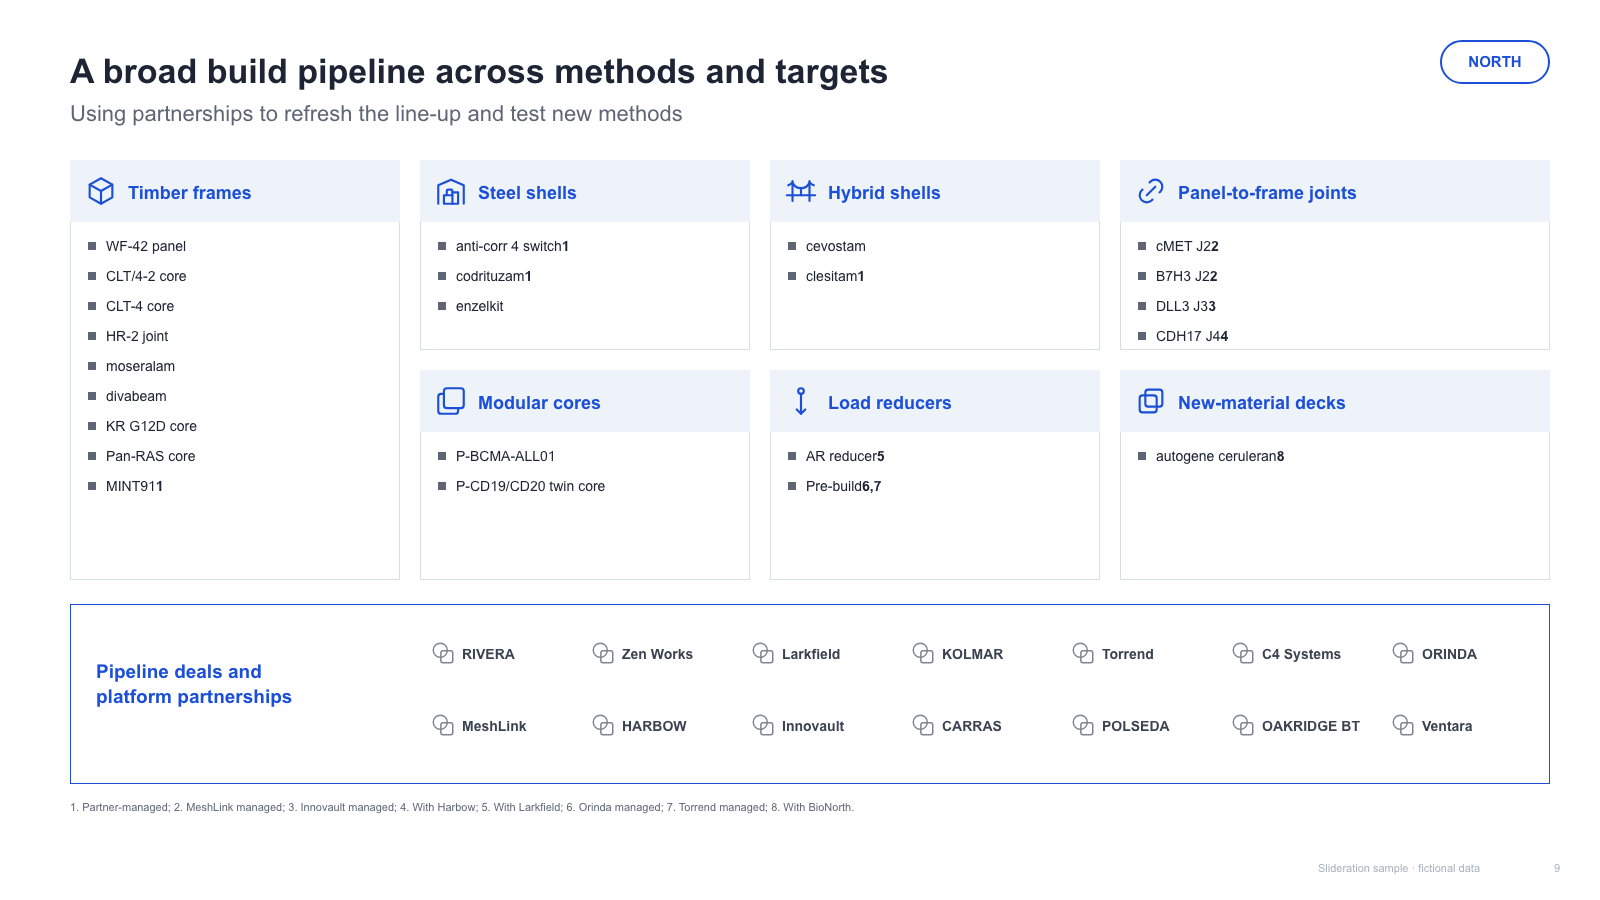
Grid of bordered bullet panels with icon headers over a wide partner-logo band

Grid of bordered bullet panels with icon headers over a wide partner-logo band

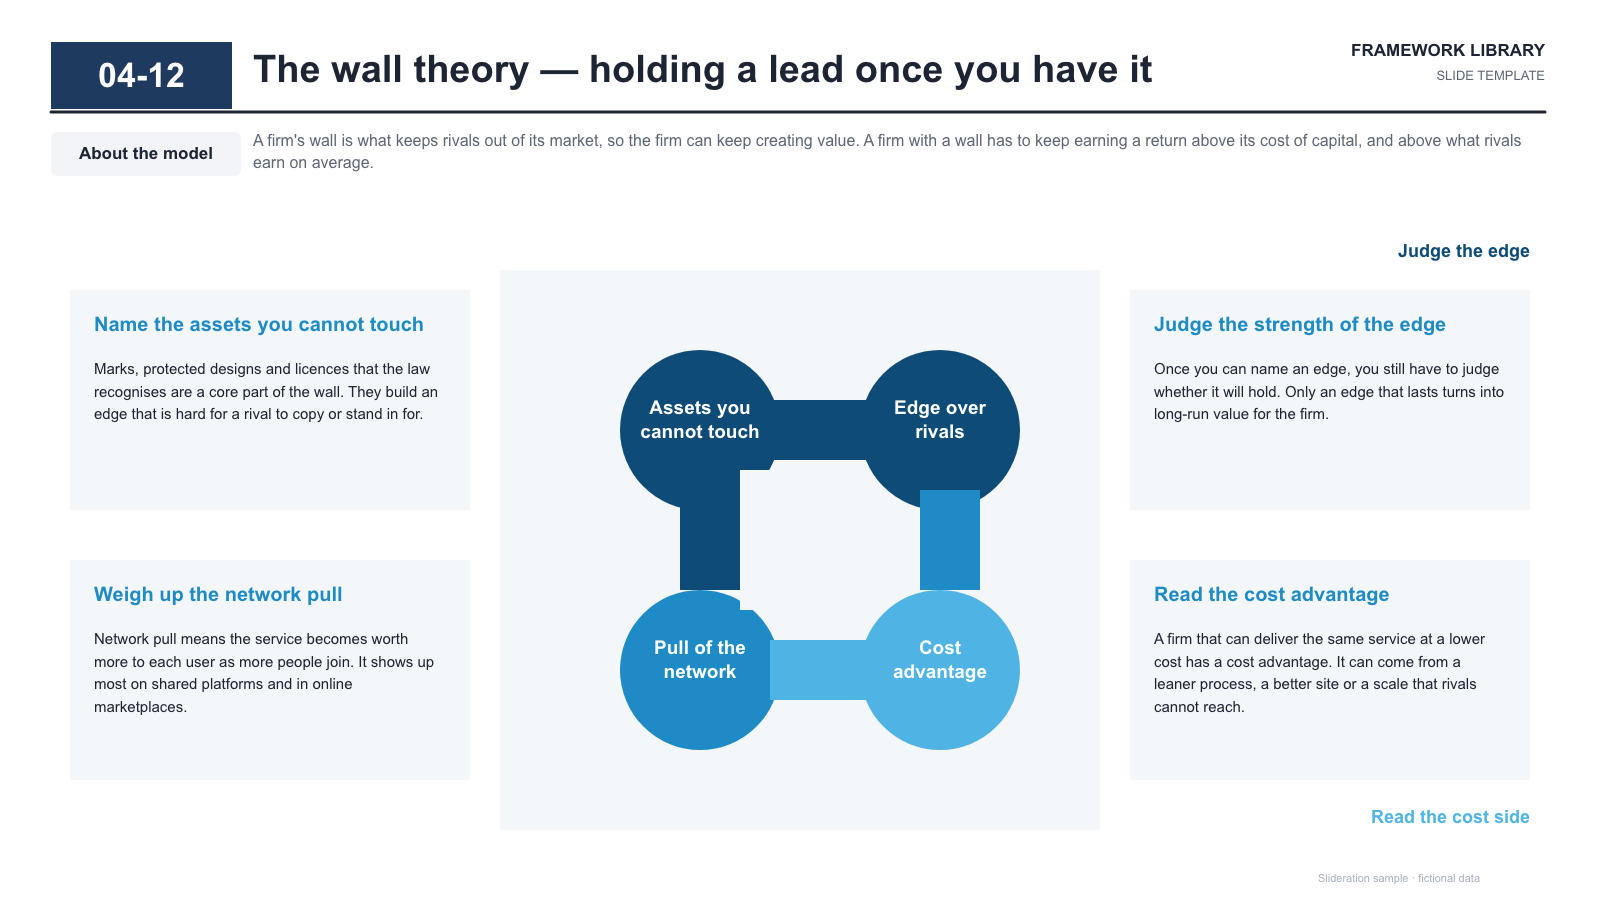
Framework page — four linked circular nodes in a dark centre panel with tinted note blocks each side

Framework page — four linked circular nodes in a dark centre panel with tinted note blocks each side

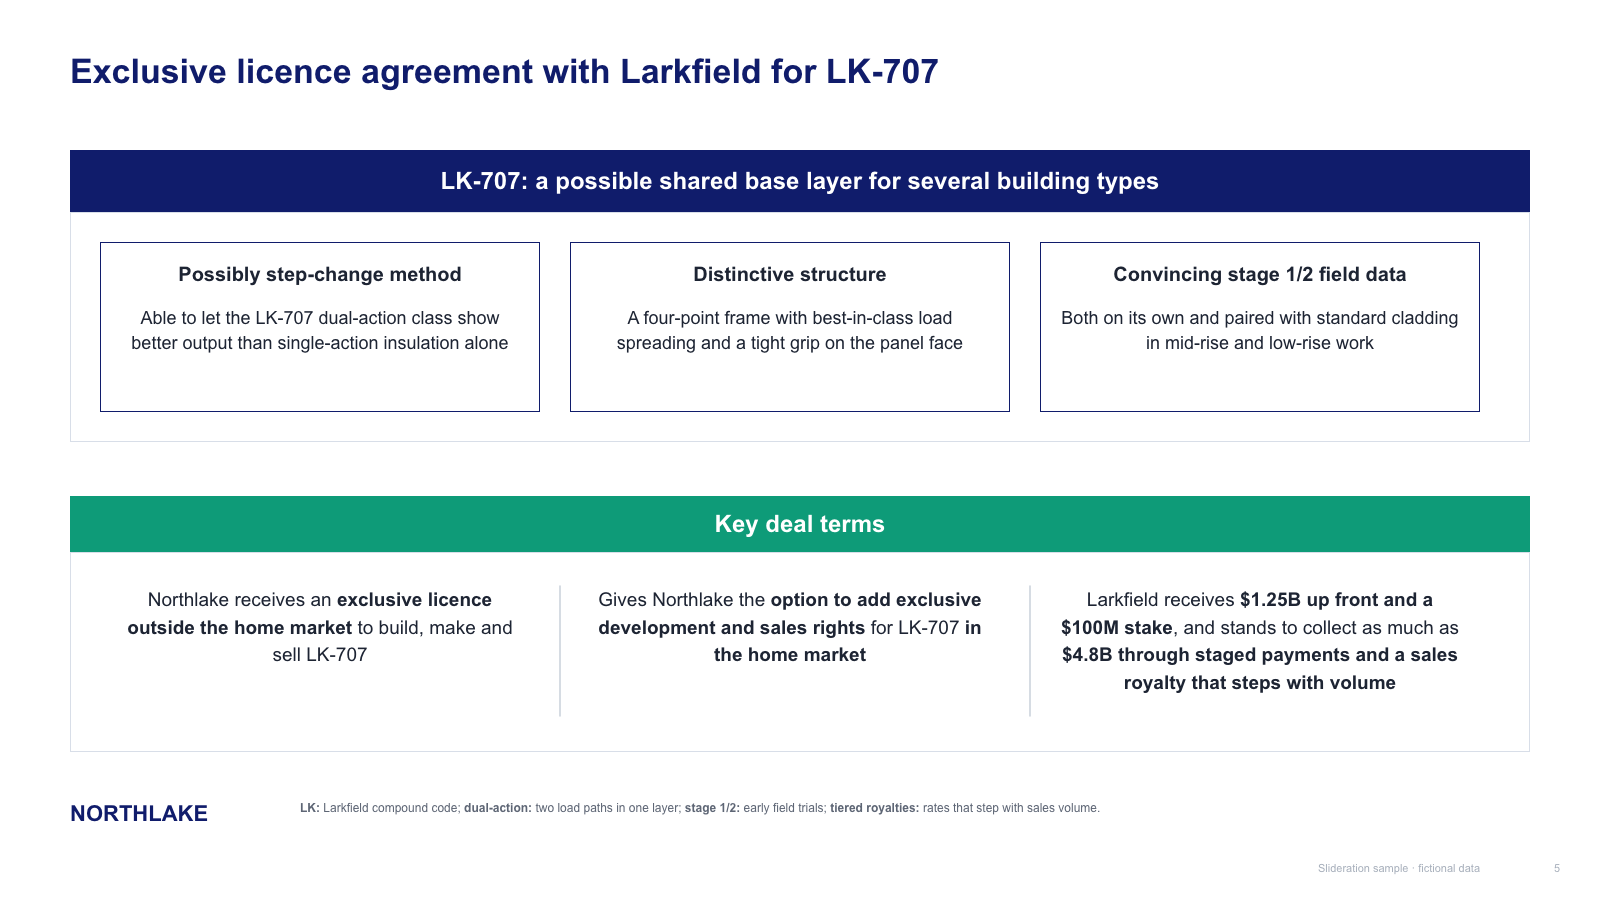
Dark banner over three bordered claim cards, then a green band with three divided term columns

Dark banner over three bordered claim cards, then a green band with three divided term columns

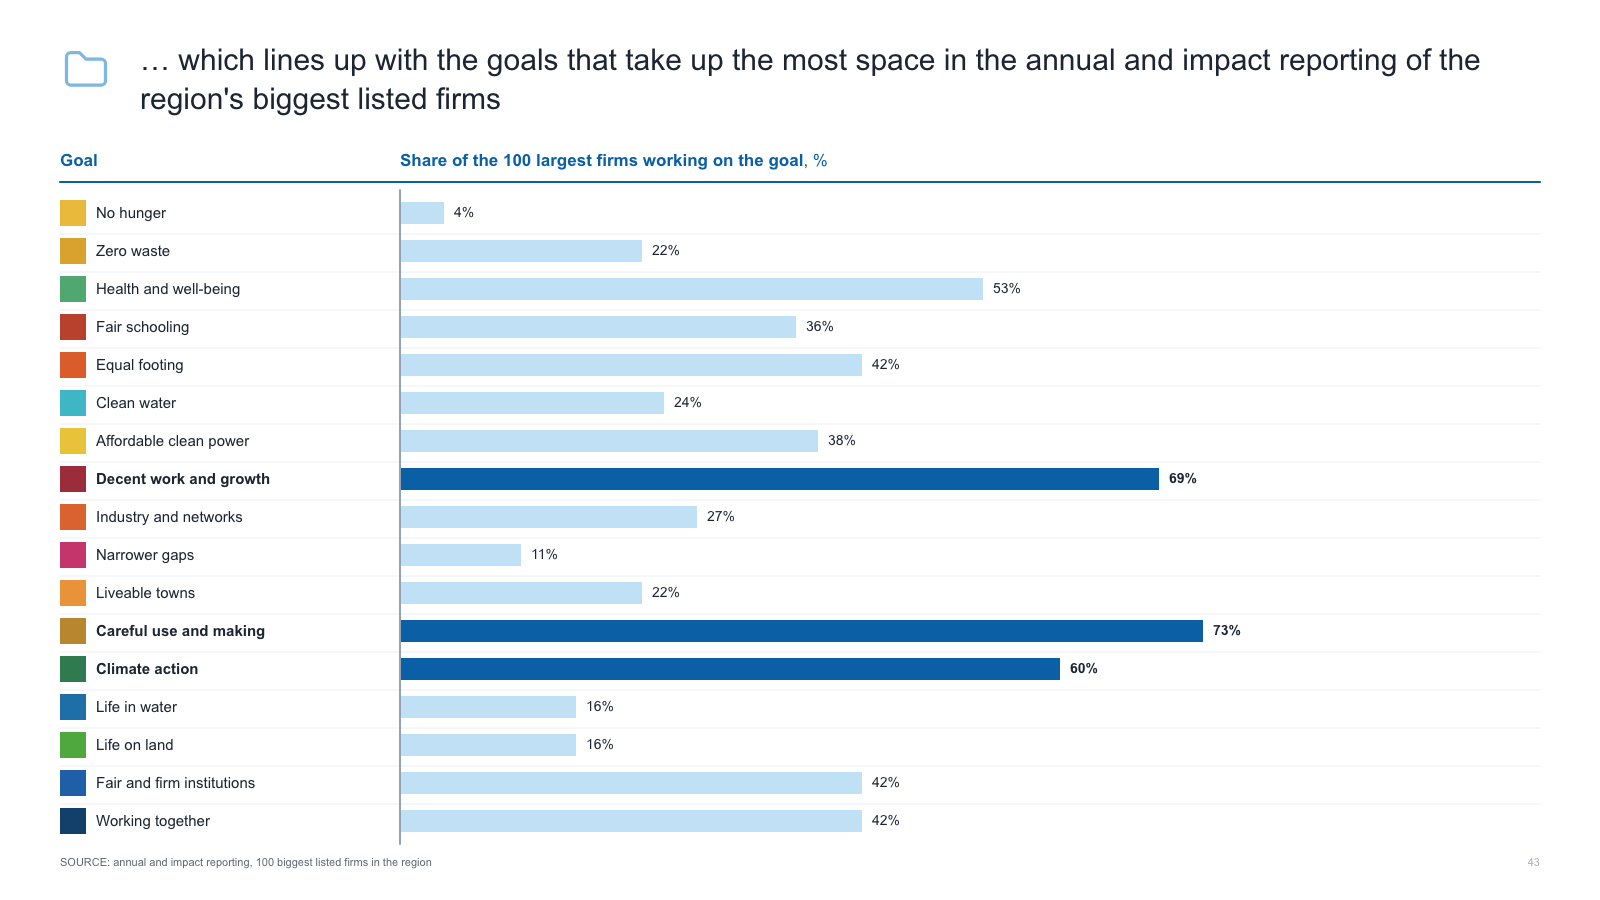
Goal rows with a coloured icon column beside labelled horizontal bars, three rows highlighted

Goal rows with a coloured icon column beside labelled horizontal bars, three rows highlighted

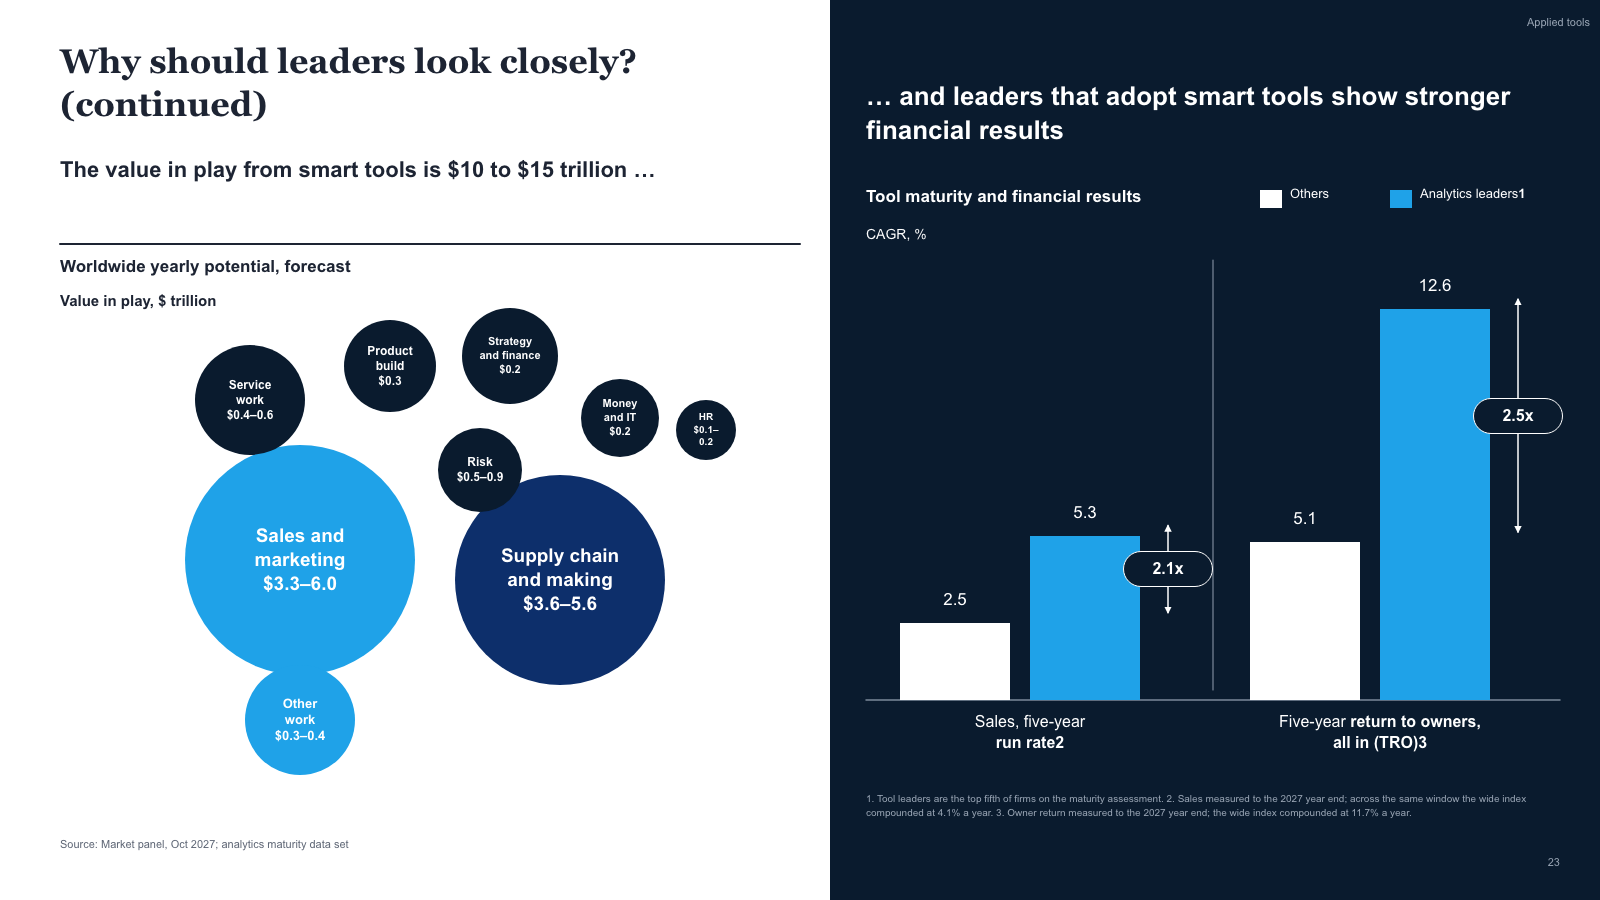
White bubble-chart panel on the left, dark panel on the right with paired bars and multiple brackets

White bubble-chart panel on the left, dark panel on the right with paired bars and multiple brackets

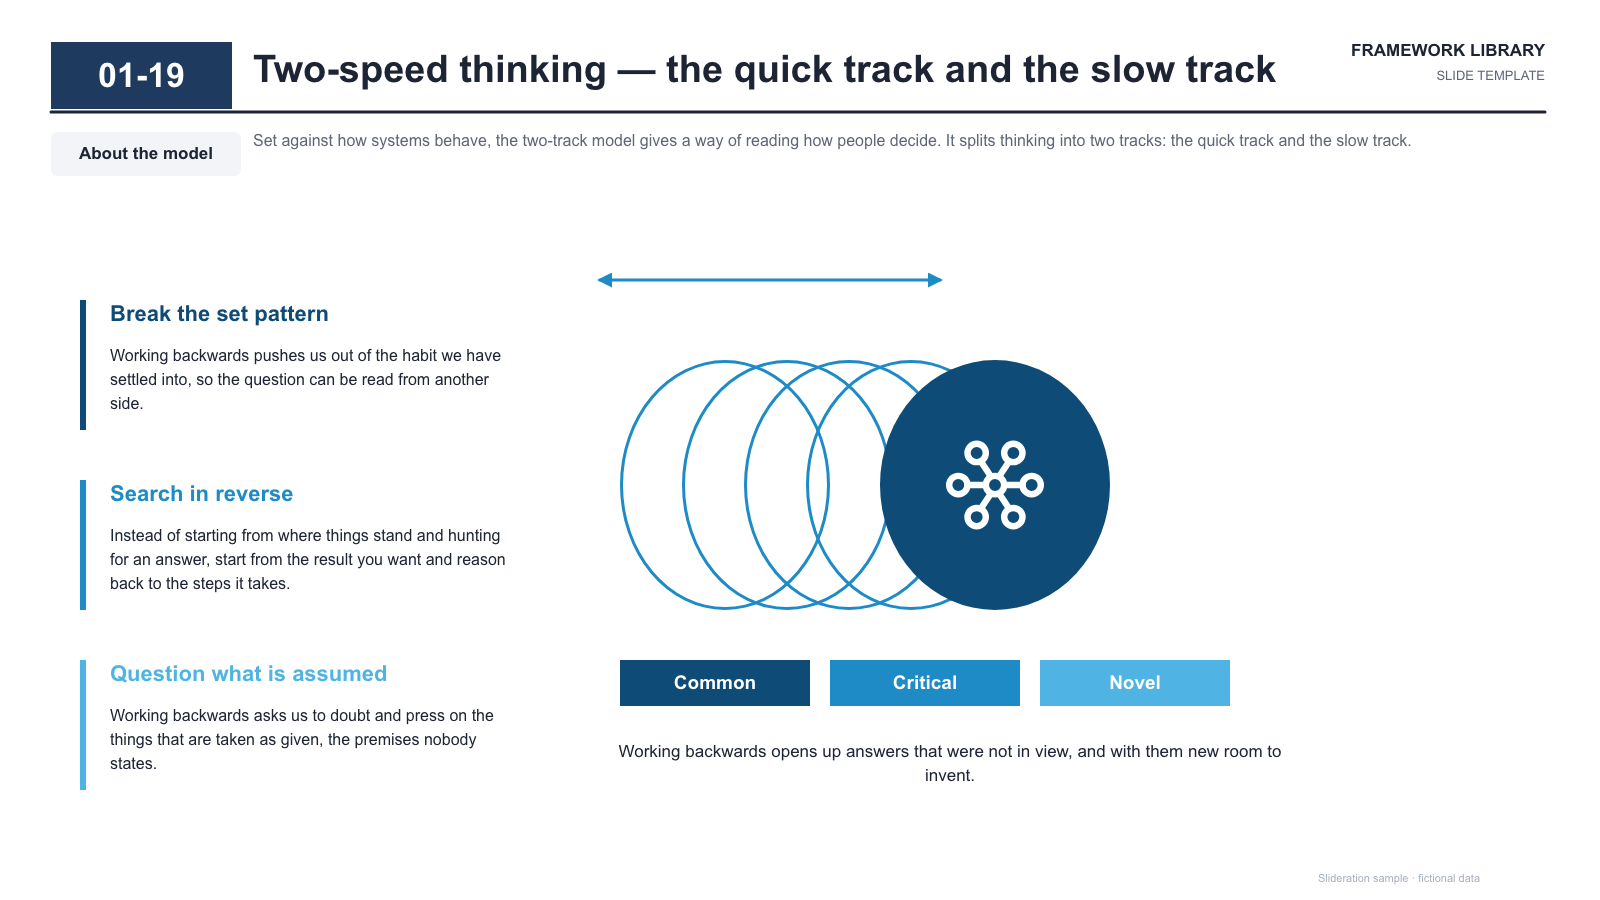
Framework page — three ruled note blocks on the left and an overlapping-heads figure with pill labels

Framework page — three ruled note blocks on the left and an overlapping-heads figure with pill labels

Dark navy page with four rounded claim cards around a central round emblem and a partner band

Dark navy page with four rounded claim cards around a central round emblem and a partner band

Three-column staggered portfolio grid with rising trend arrow and labeled acquisition callouts

Three-column staggered portfolio grid with rising trend arrow and labeled acquisition callouts

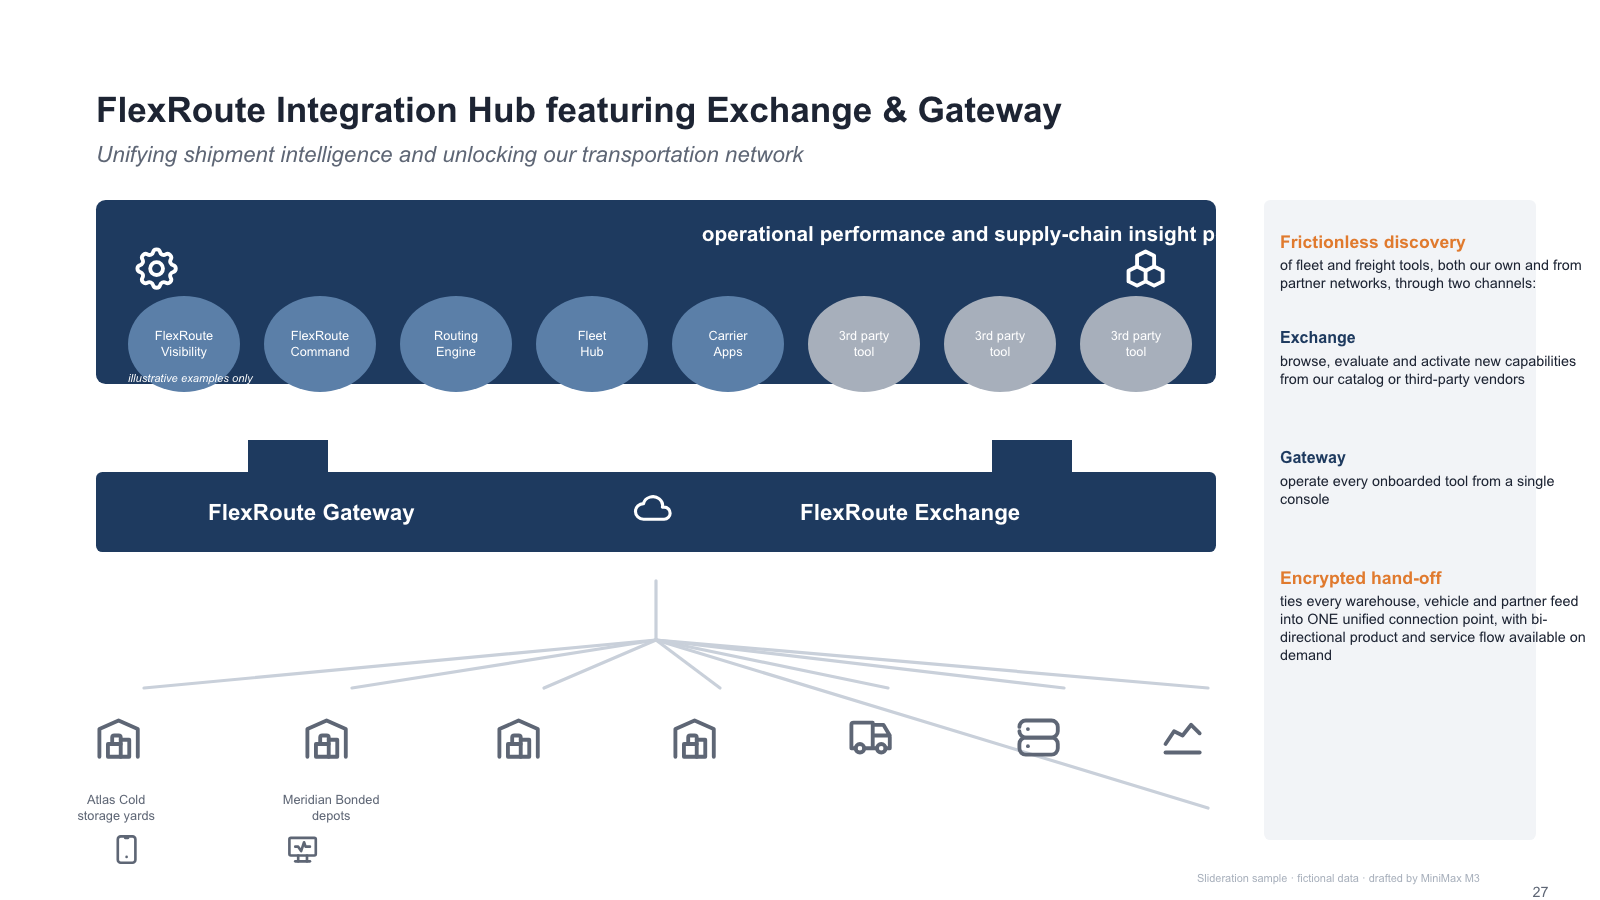
Platform architecture hub with connected modules

Platform architecture hub with connected modules

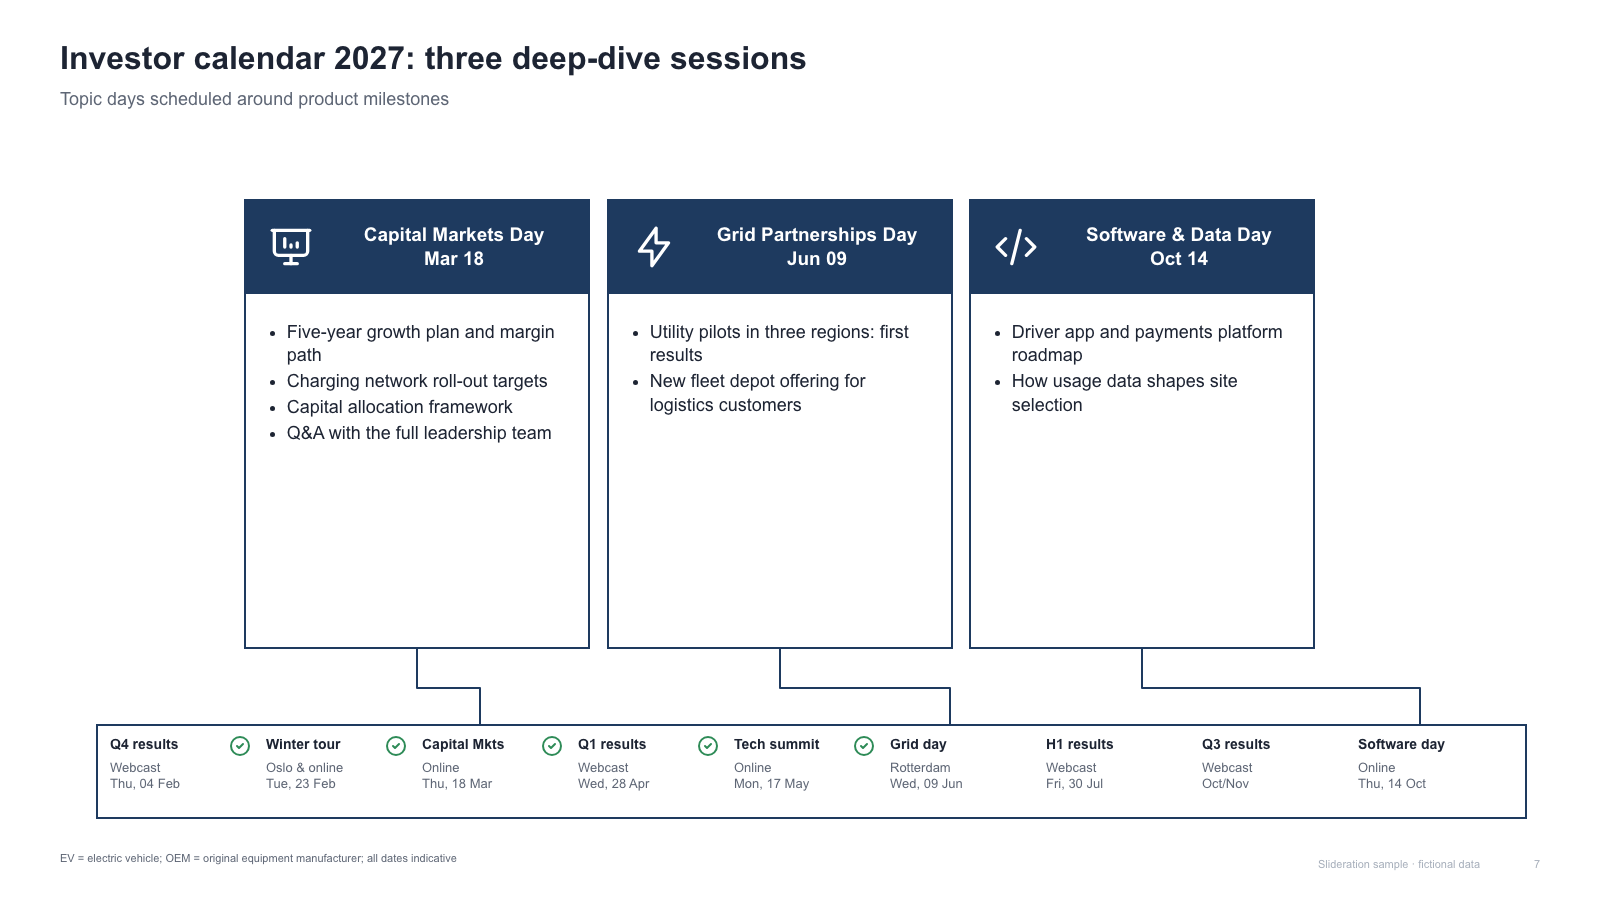
3 header cards with bullets + connected event strip

3 header cards with bullets + connected event strip

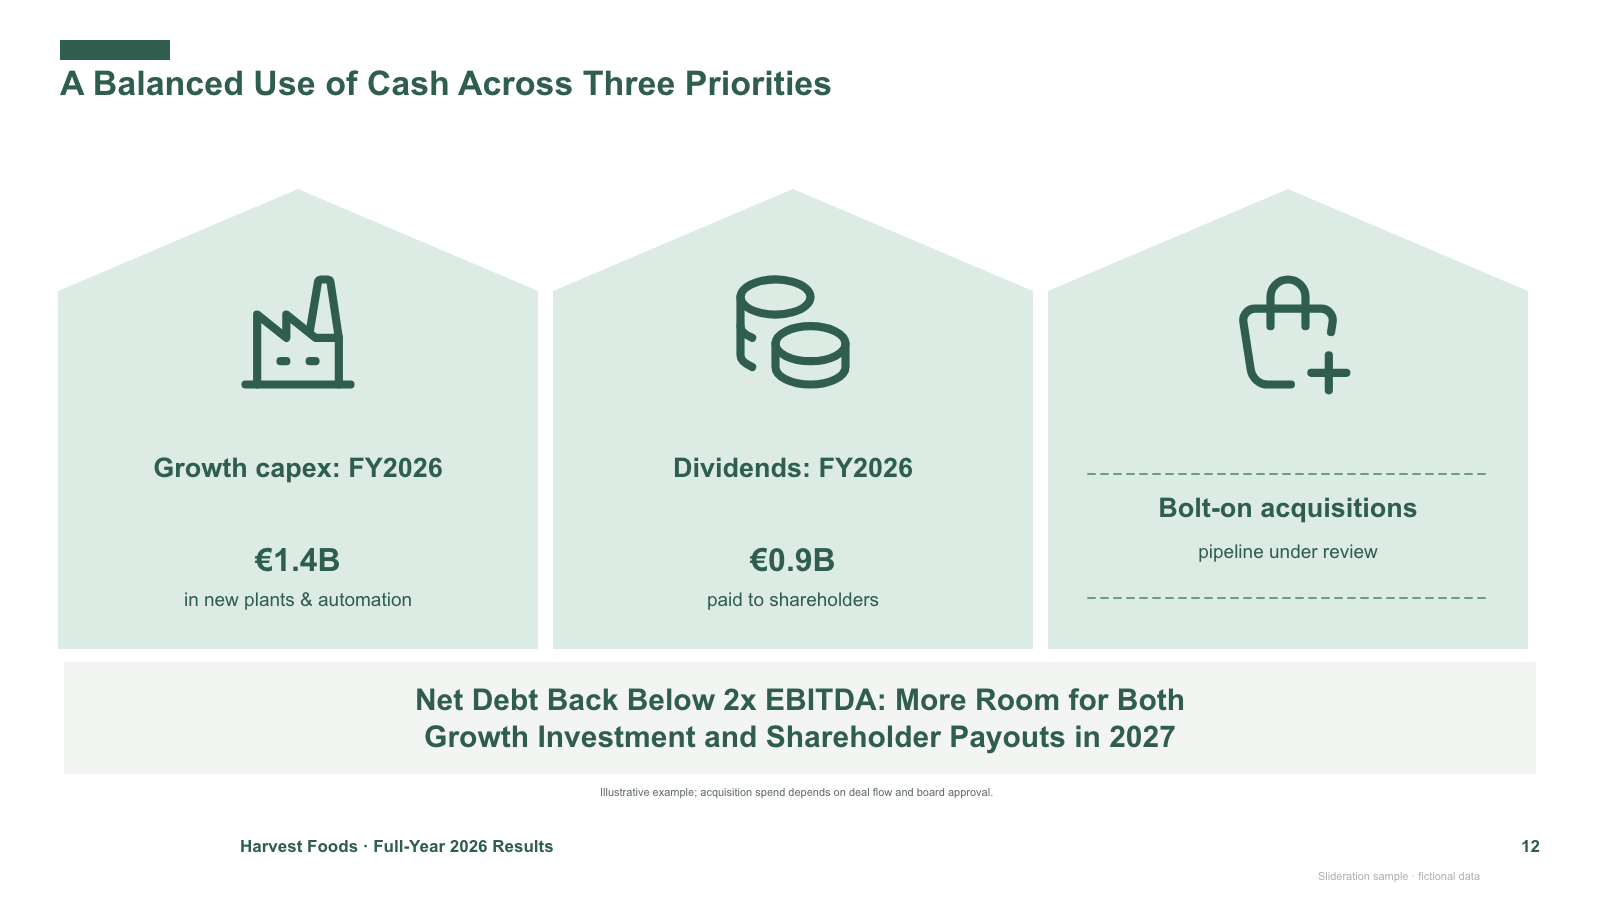
Three house-shaped pillars + bottom conclusion banner

Three house-shaped pillars + bottom conclusion banner

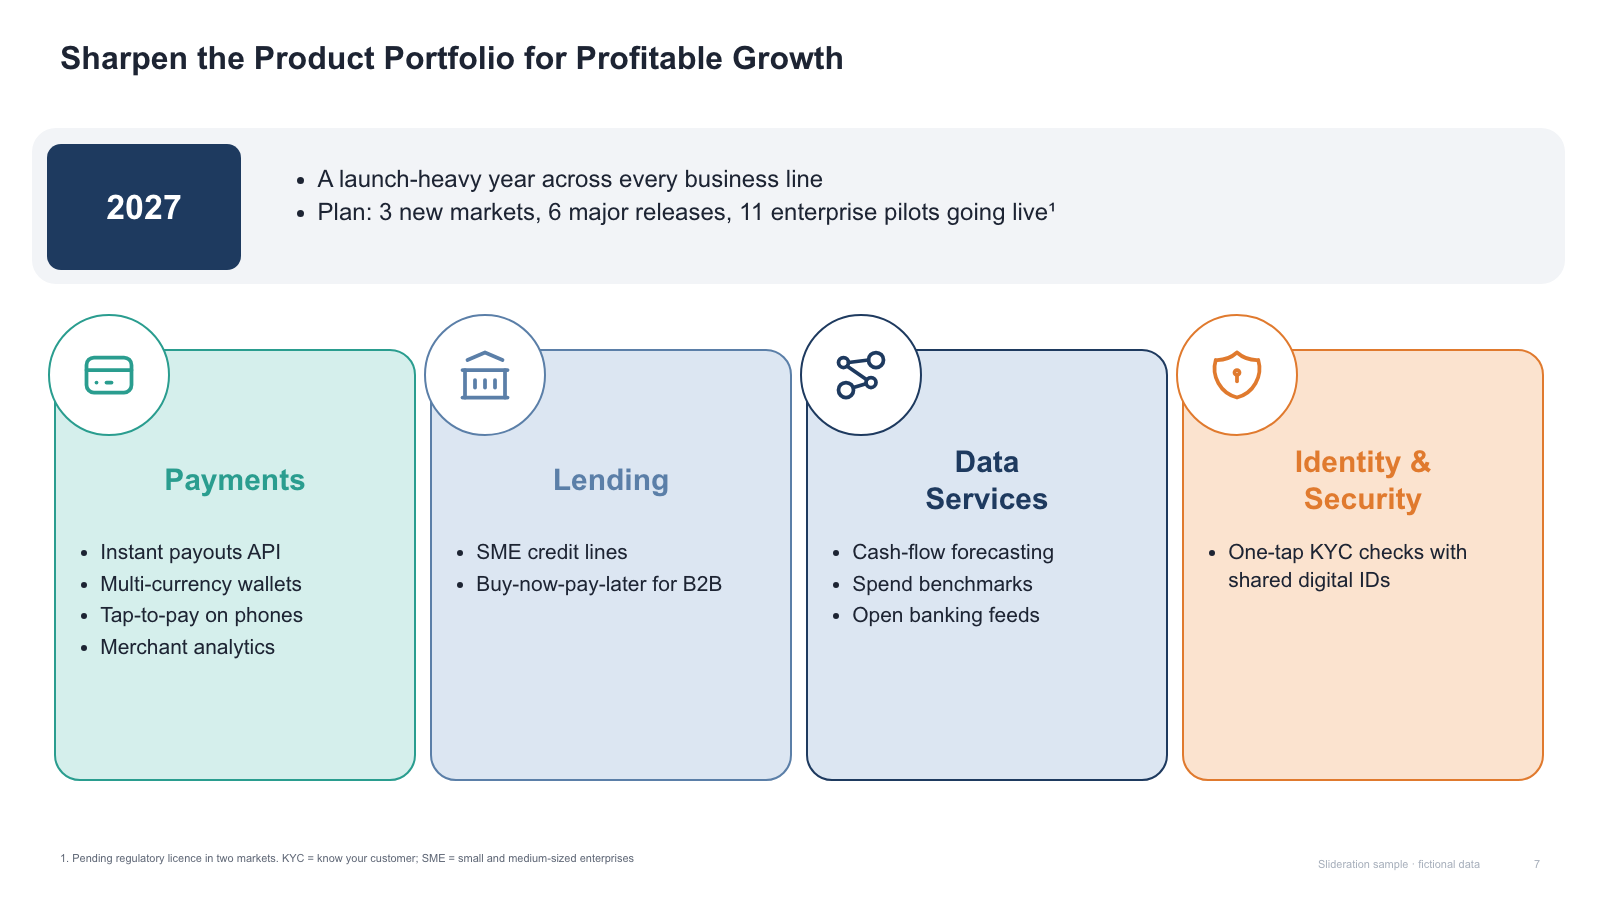
Highlight banner + four icon cards with bullets

Highlight banner + four icon cards with bullets

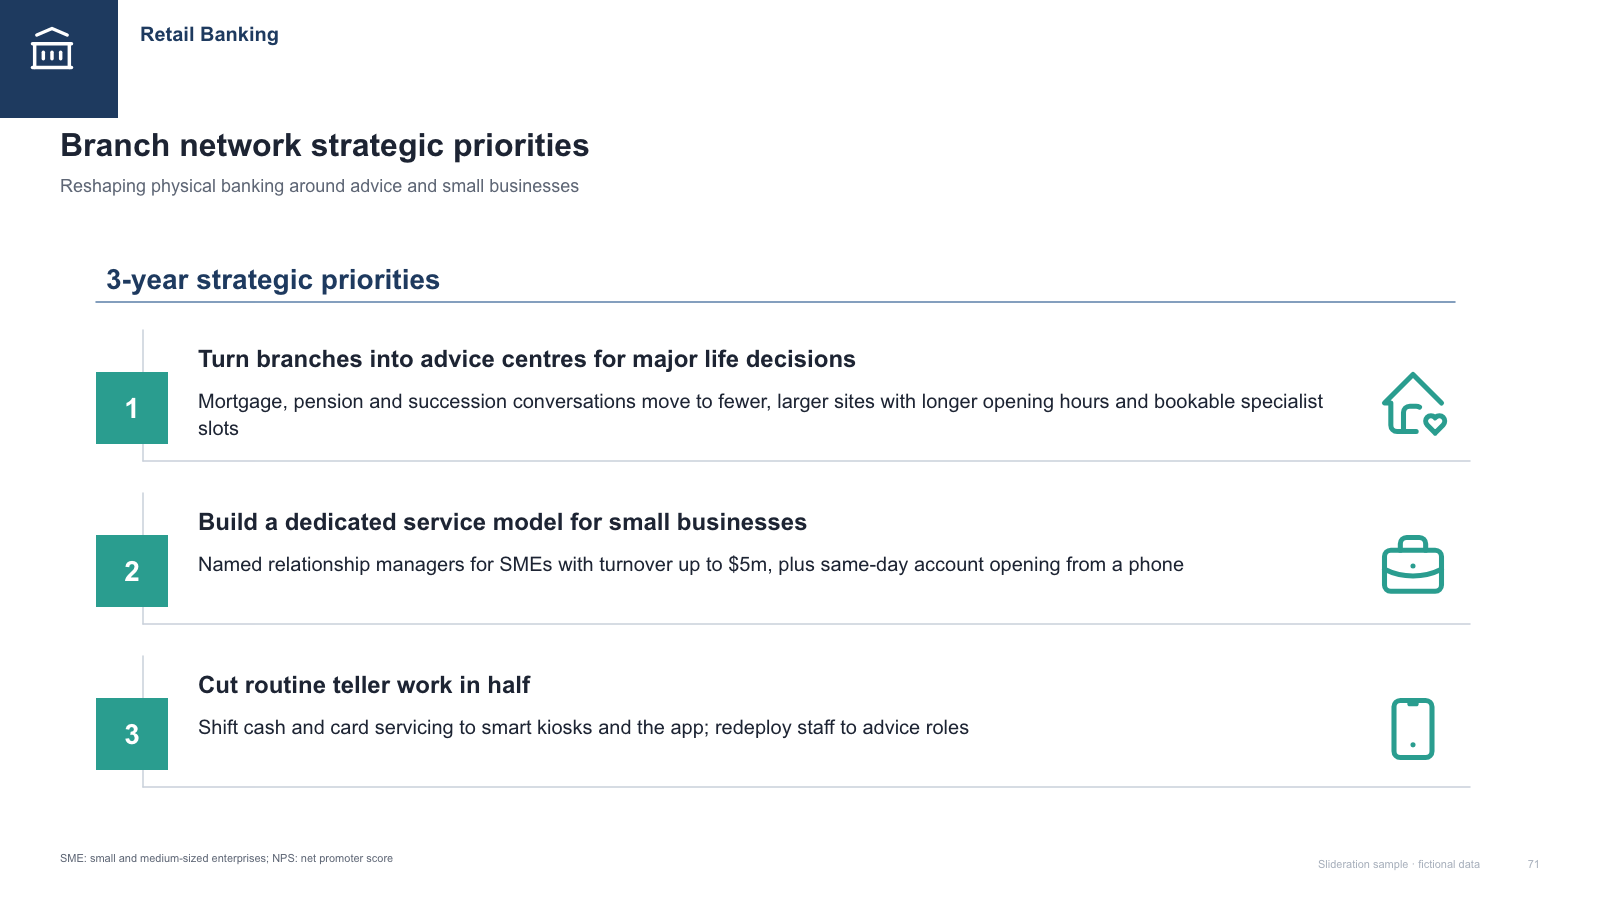
Numbered strategic priorities list with icons

Numbered strategic priorities list with icons

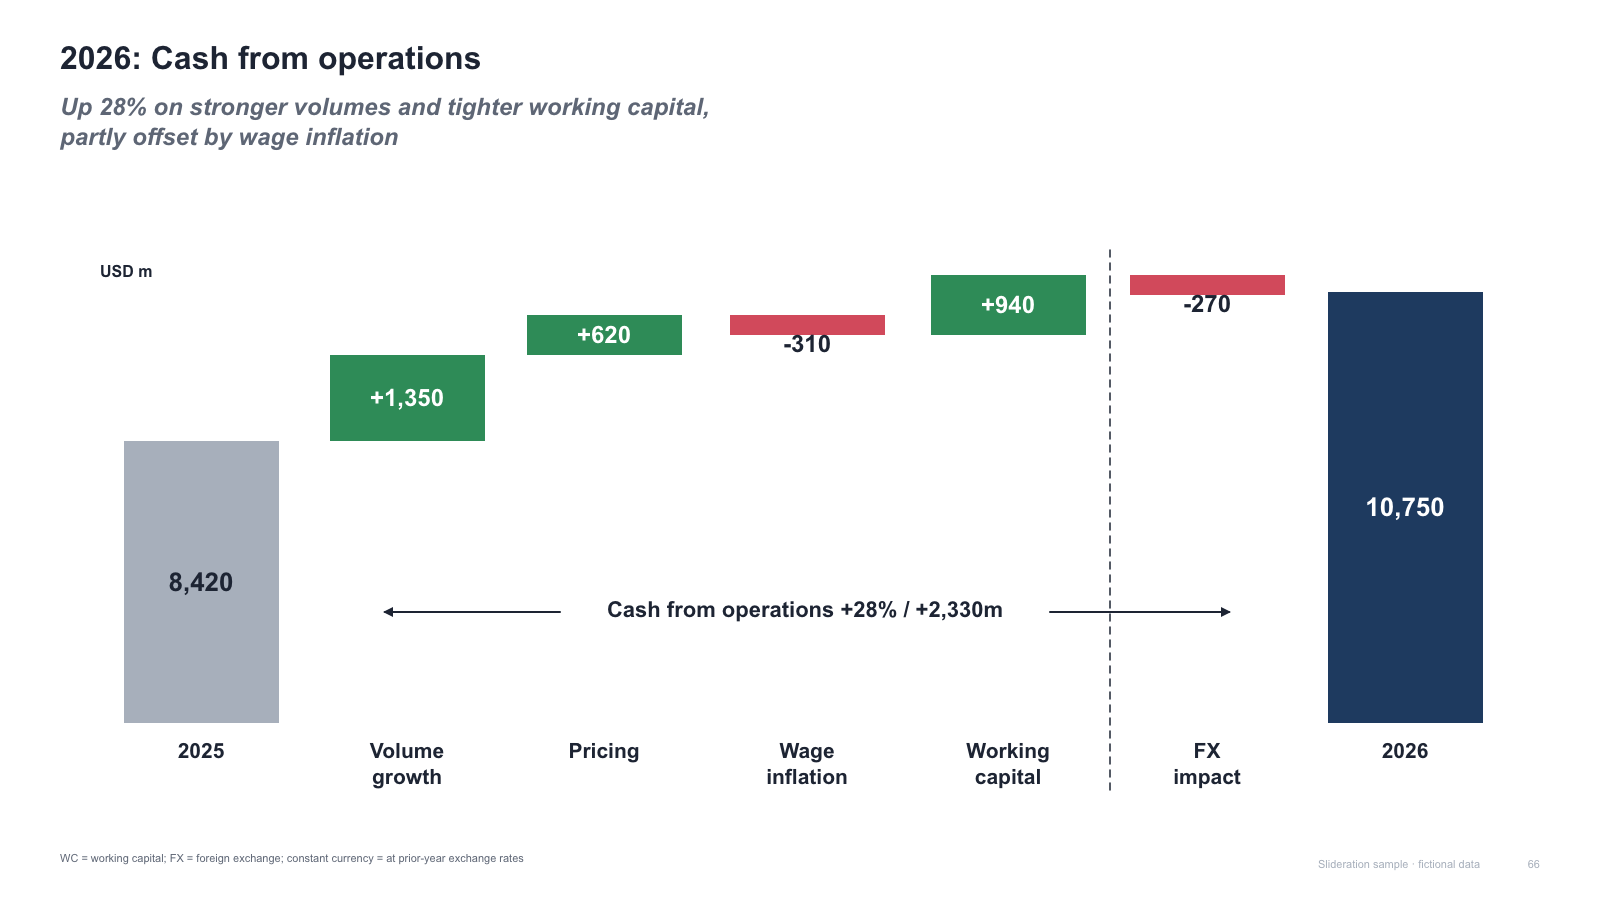
Waterfall chart bridge with divider and span arrow

Waterfall chart bridge with divider and span arrow

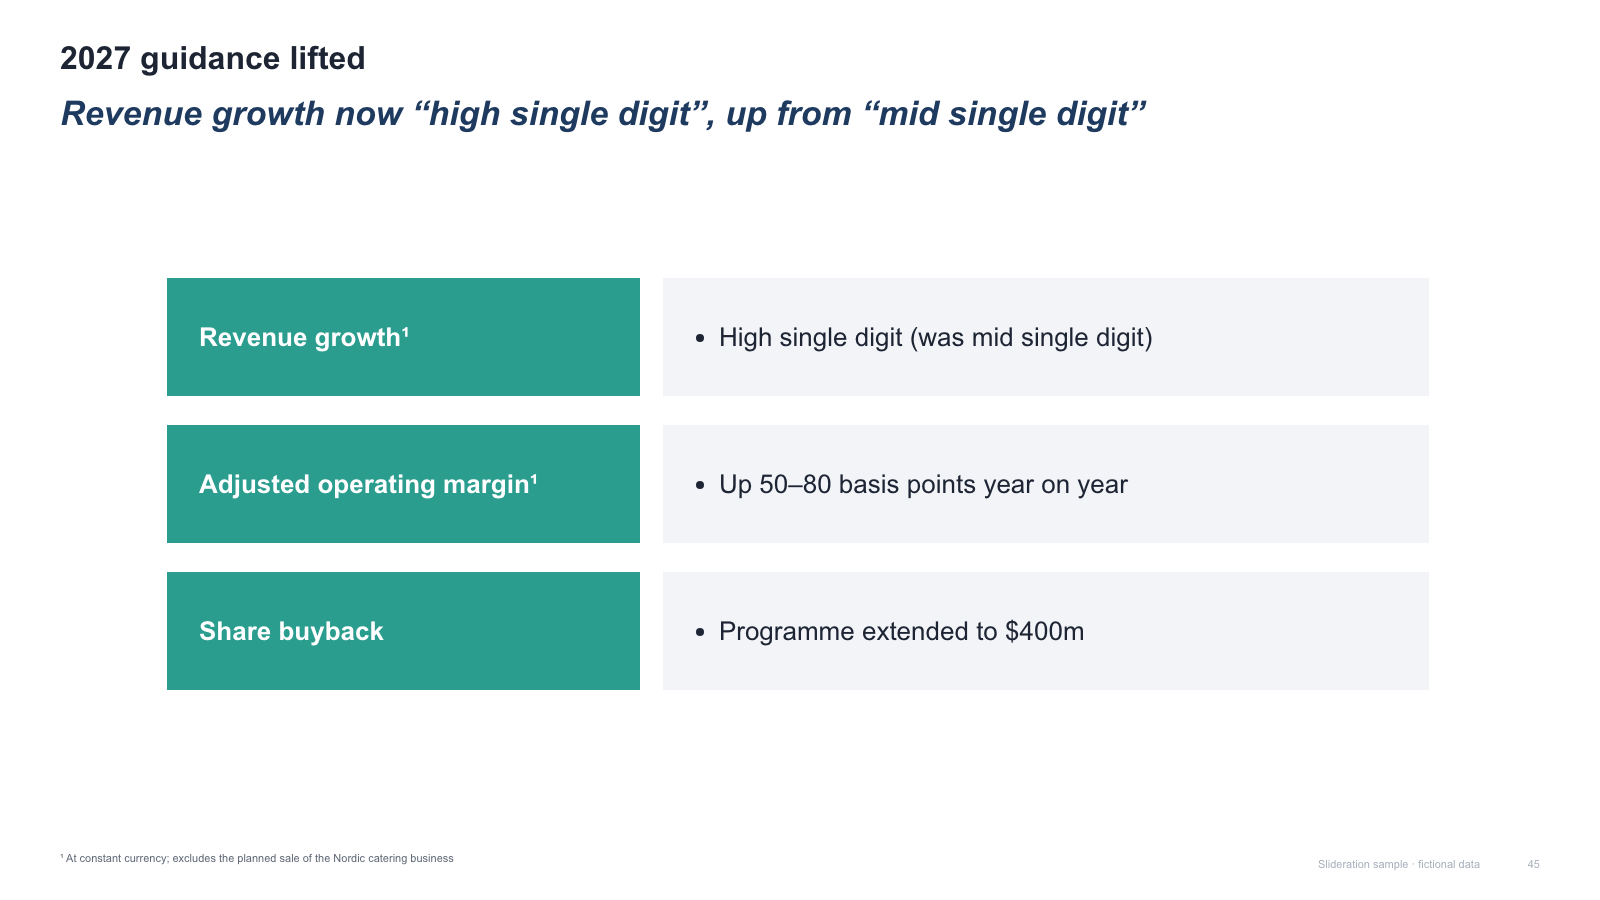
Three label/value rows (key guidance table)

Three label/value rows (key guidance table)

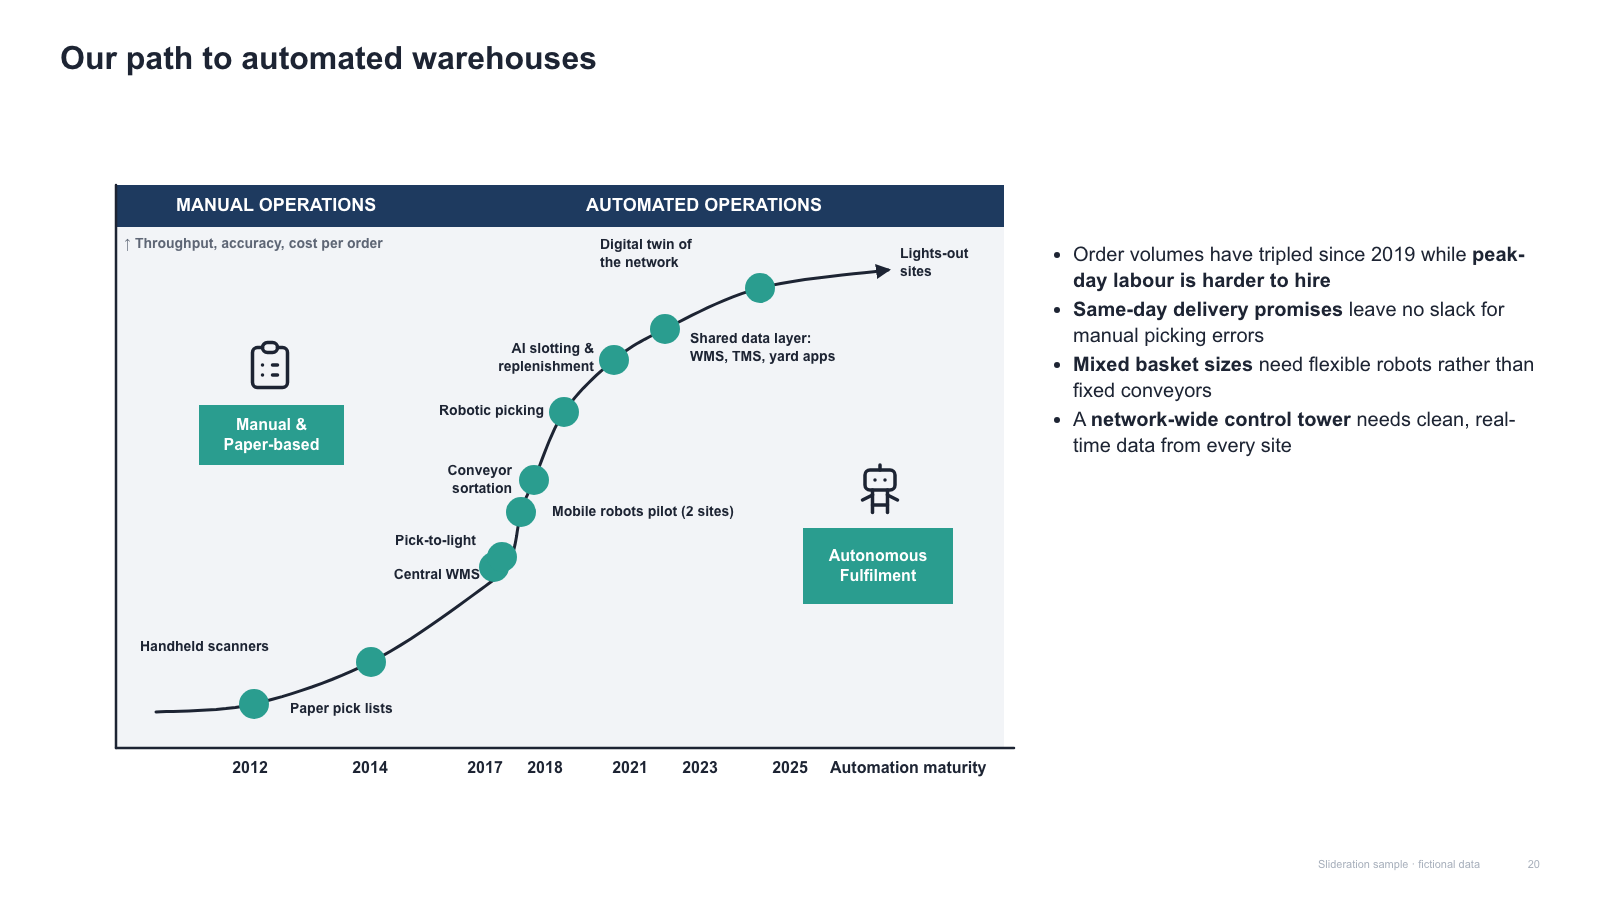
S-curve maturity journey with milestones + right-hand bullets

S-curve maturity journey with milestones + right-hand bullets

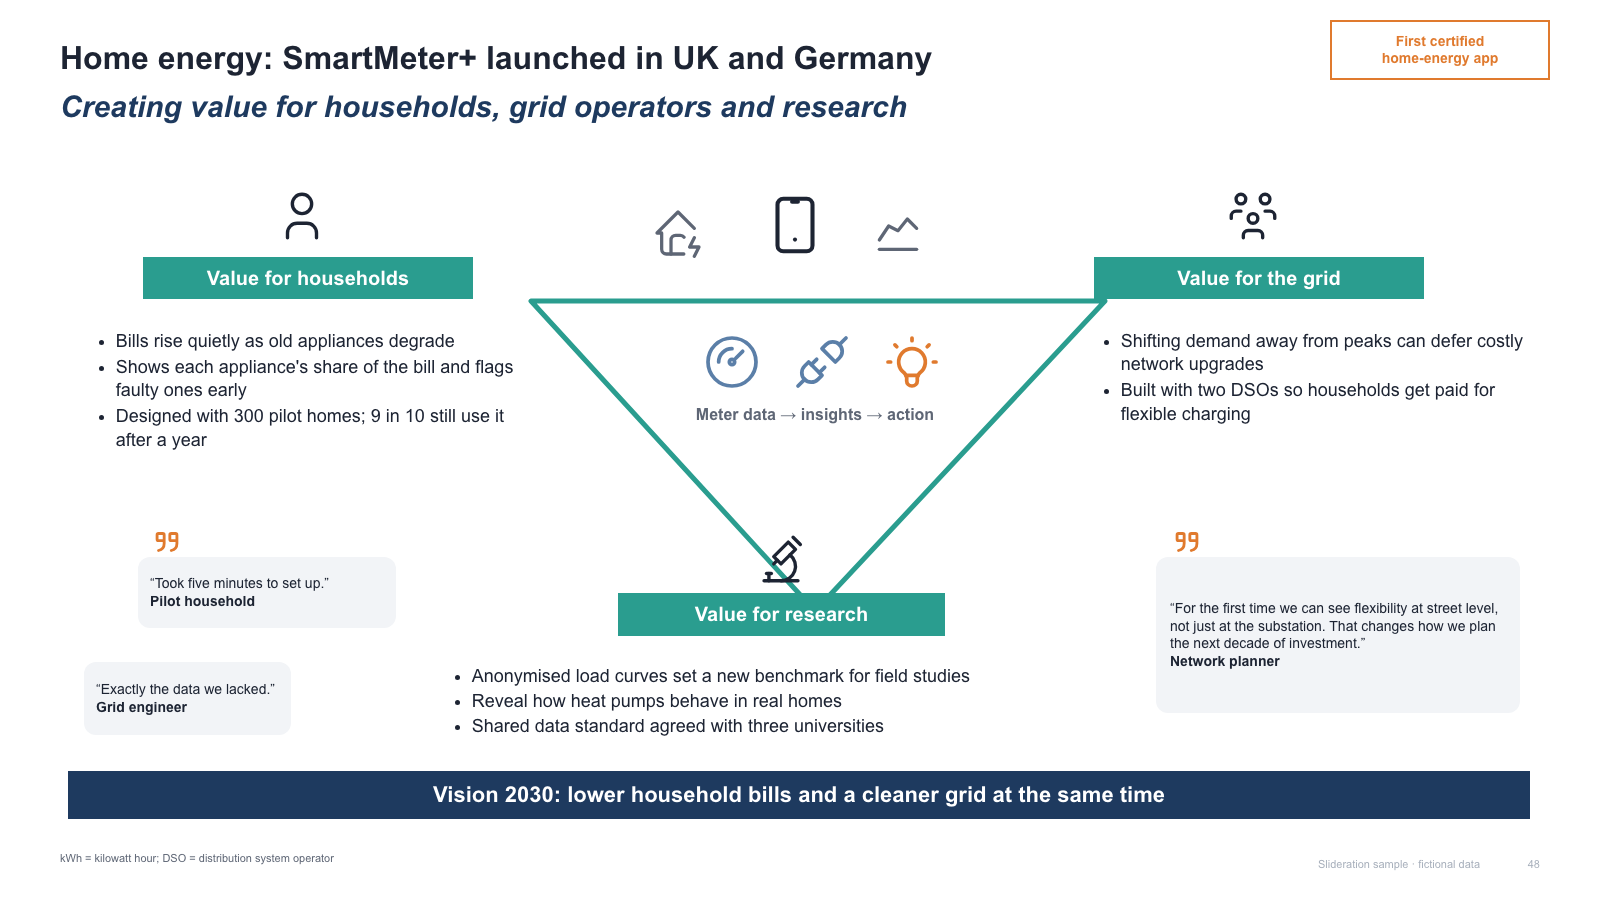
Inverted triangle with three value corners, bullets, quotes and banner

Inverted triangle with three value corners, bullets, quotes and banner

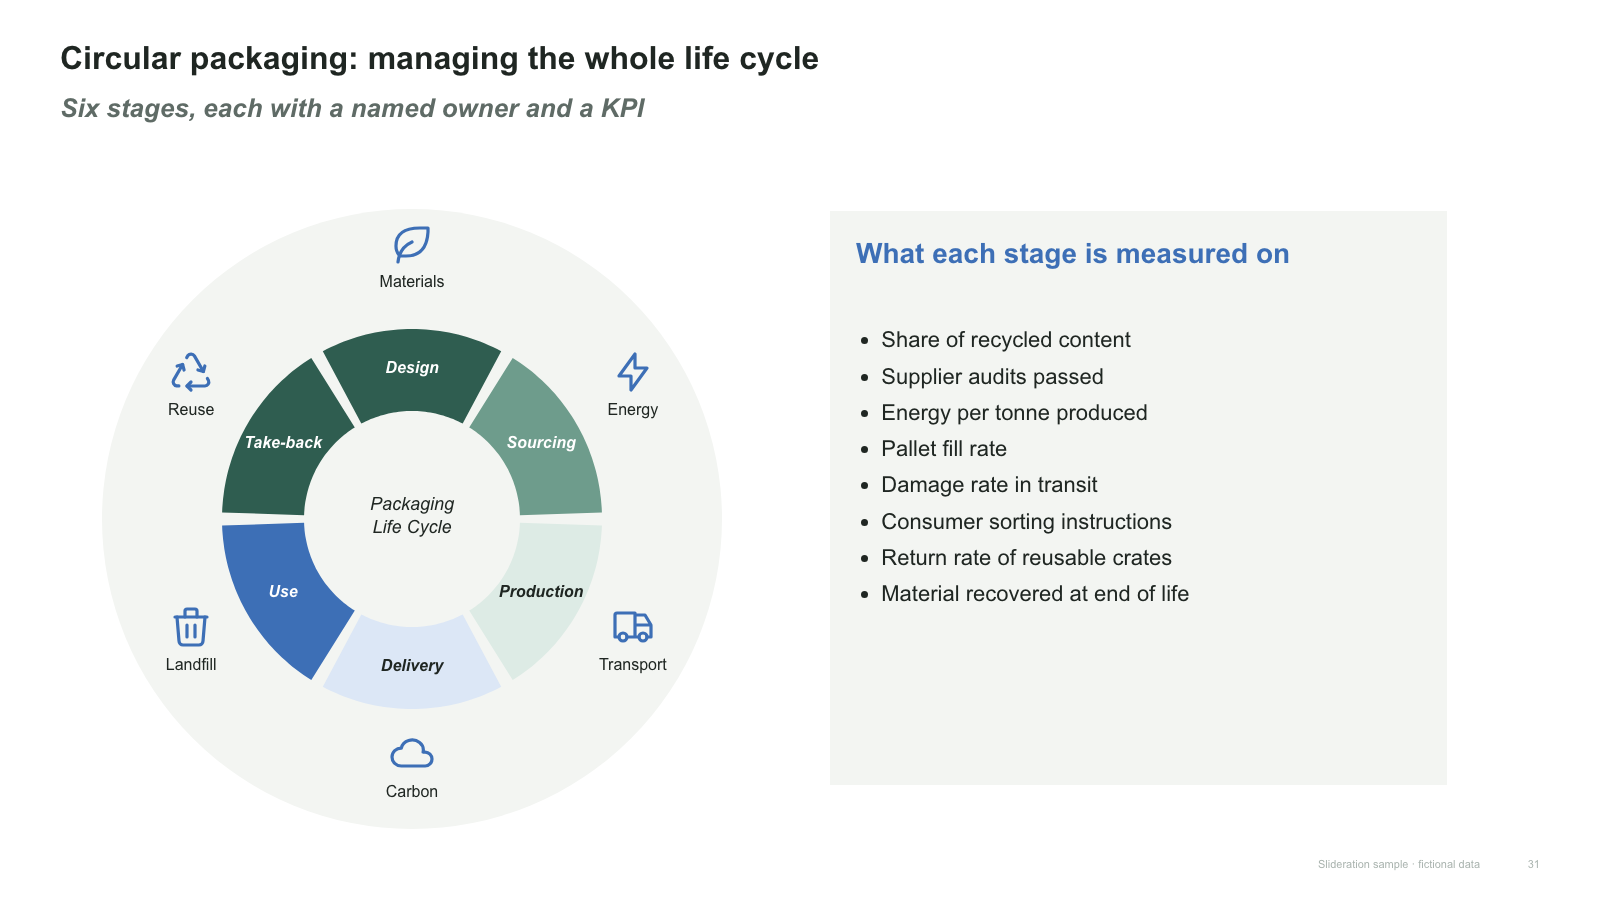
Six-segment life-cycle ring with outer icon labels + right panel list

Six-segment life-cycle ring with outer icon labels + right panel list

Central hub circle with four connected text blocks + side navigation

Central hub circle with four connected text blocks + side navigation

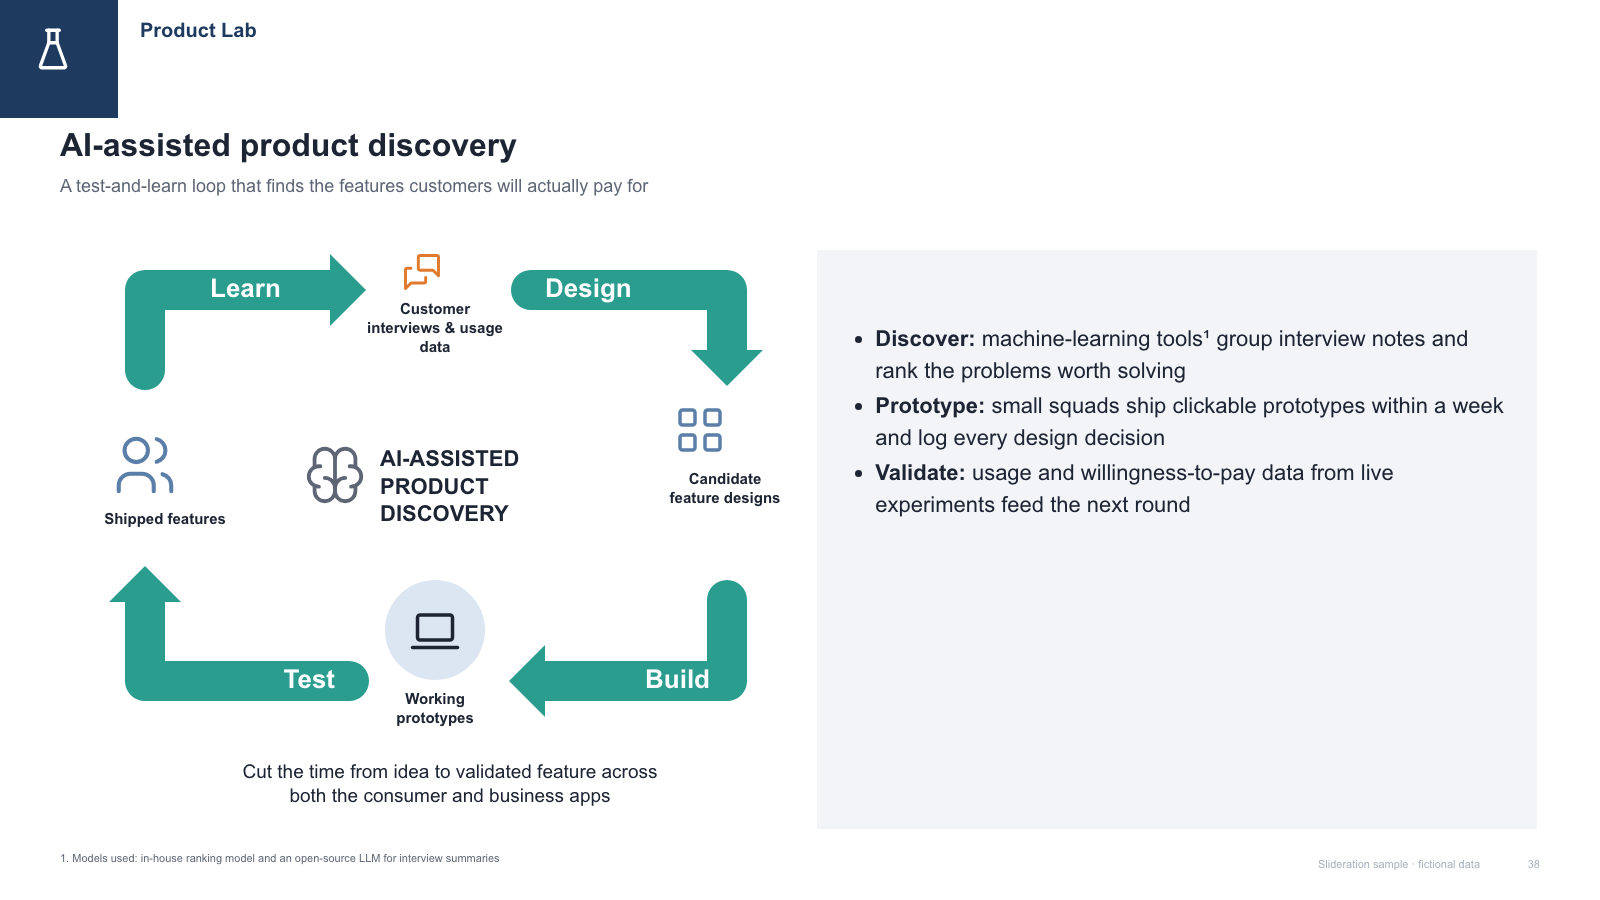
Four-arrow learn/design/build/test loop + right explanation panel

Four-arrow learn/design/build/test loop + right explanation panel

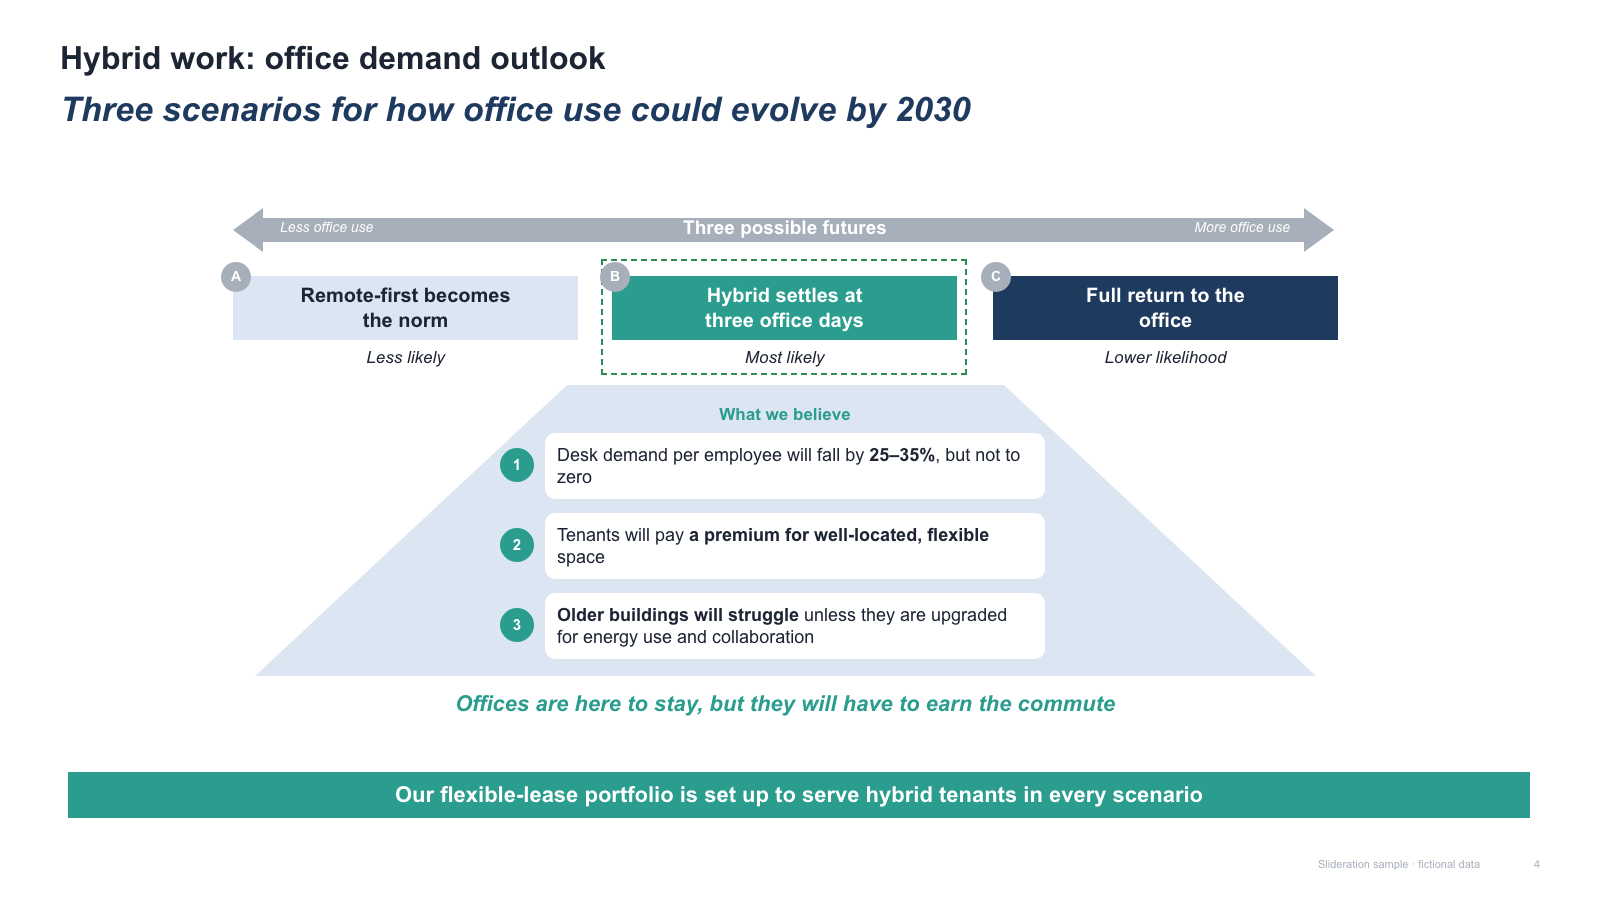
Scenario spectrum (A/B/C) + trapezoid of core beliefs + banner

Scenario spectrum (A/B/C) + trapezoid of core beliefs + banner

Driver-tree equation with callouts

Driver-tree equation with callouts

Actions vs results — two opposing arrow panels with icon rows

Actions vs results — two opposing arrow panels with icon rows

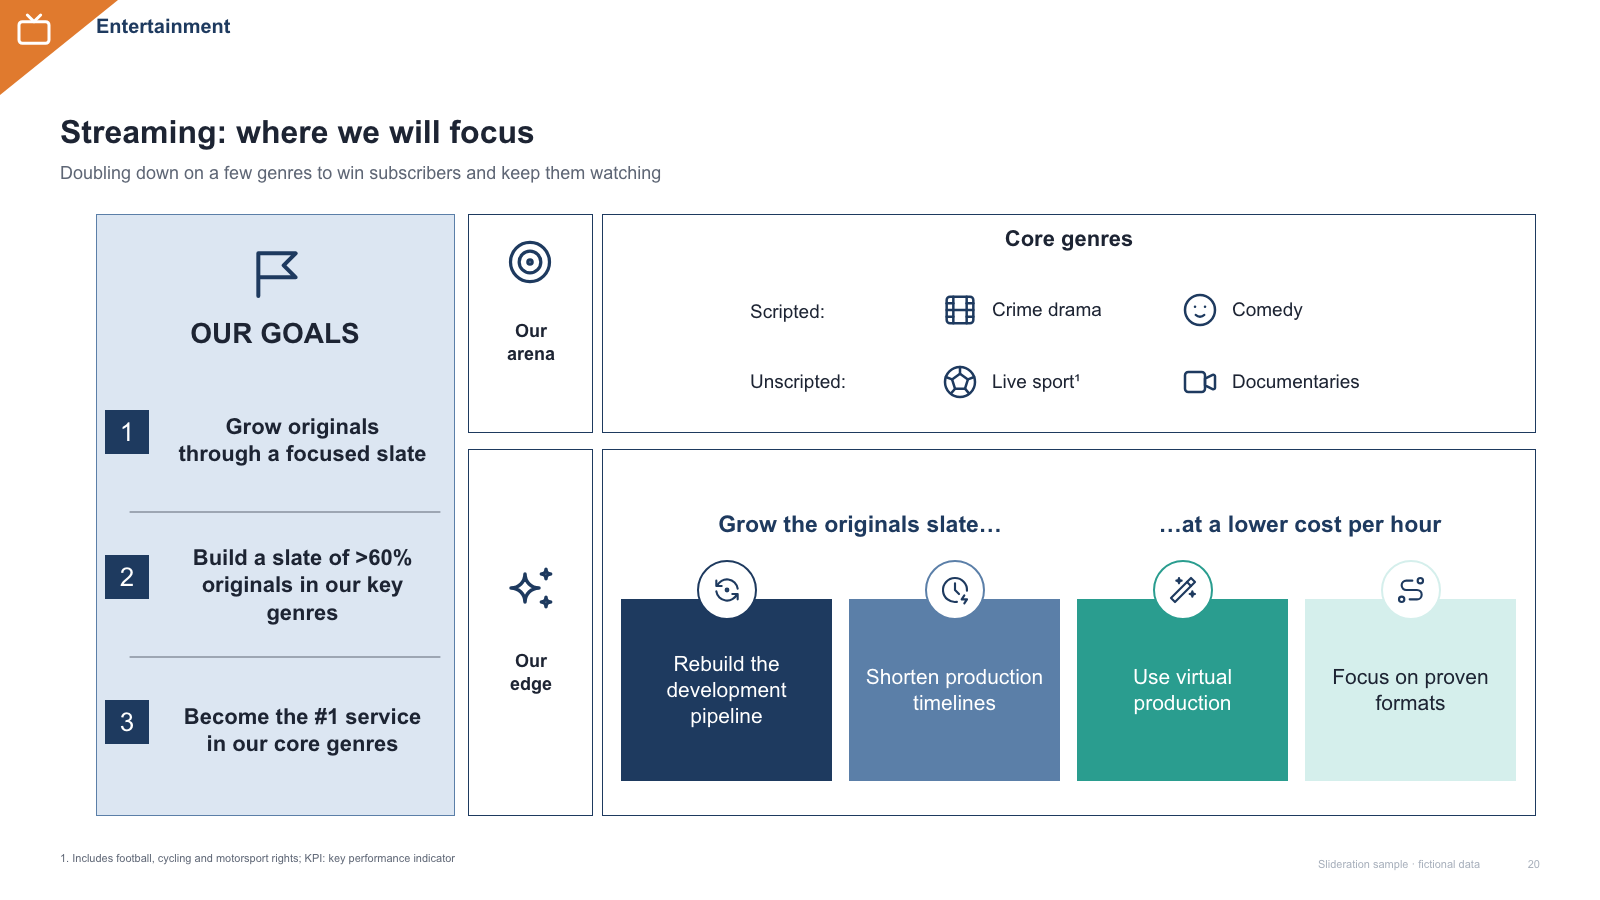
Ambition column + where-we-play / how-we-win matrix with 4 tiles

Ambition column + where-we-play / how-we-win matrix with 4 tiles

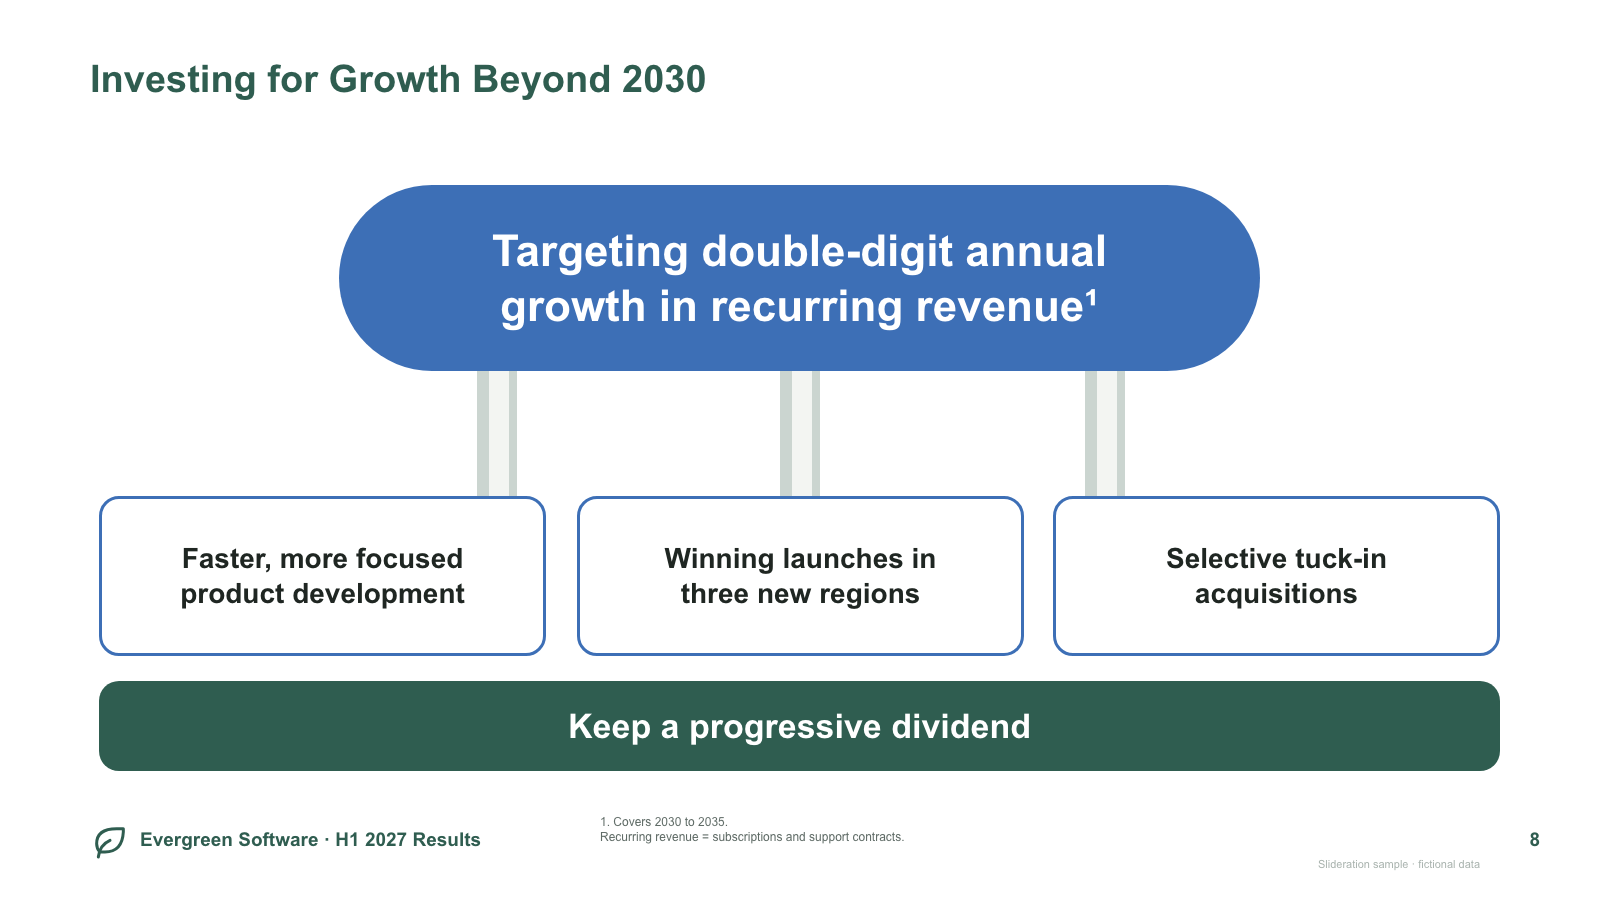
Strategy house — goal pill on columns, three pillars, foundation bar

Strategy house — goal pill on columns, three pillars, foundation bar

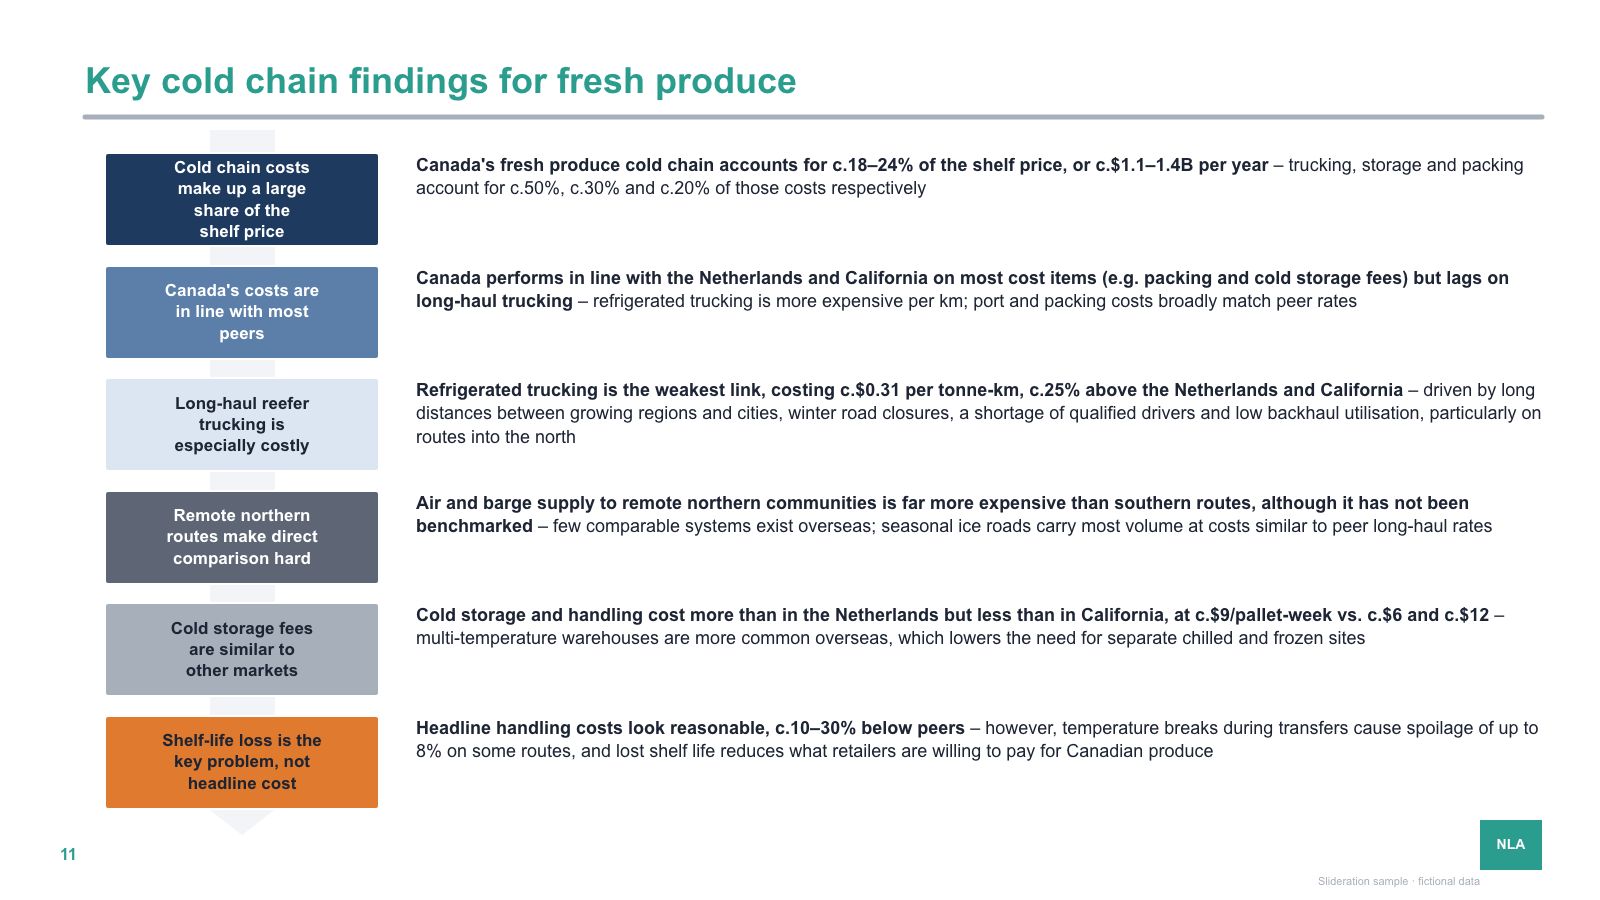
Six stacked finding labels on a down arrow + finding text rows

Six stacked finding labels on a down arrow + finding text rows

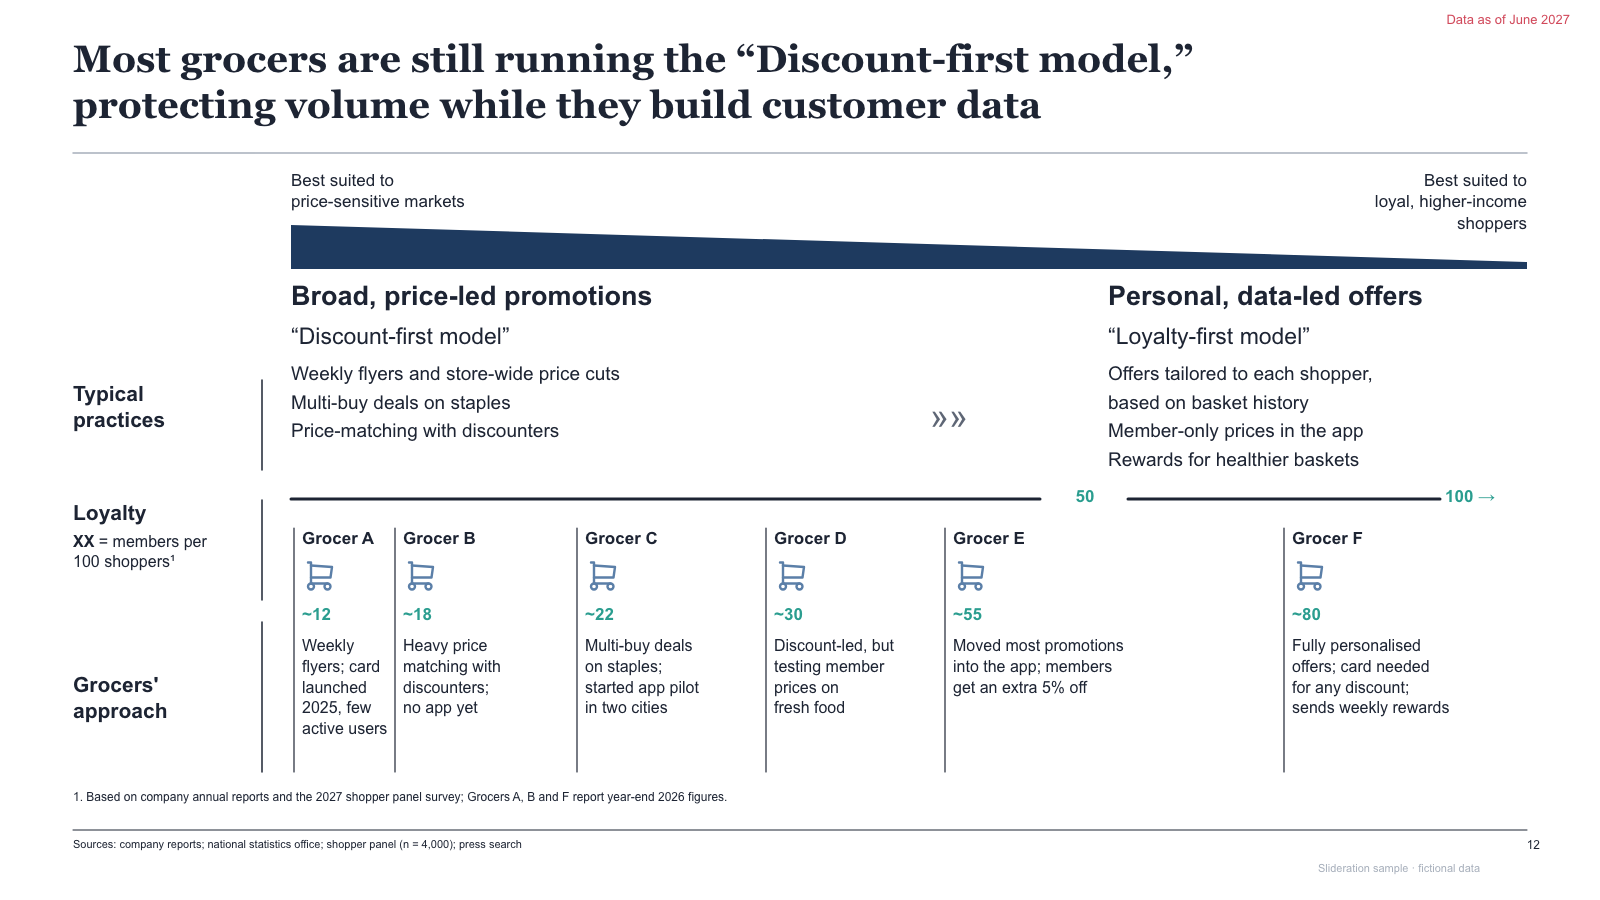
Two-model spectrum wedge + comparison columns with scale axis

Two-model spectrum wedge + comparison columns with scale axis

Dark two-column case table with round icons per row

Dark two-column case table with round icons per row

Pricing

Searching is free. 1 credit = 1 editable PPTX slide, and downloading the same slide again is free. New accounts get 2 free credits. Credits never expire.
One-time payments, no subscription. Prices in USD; taxes may apply at checkout. Payments are processed securely by our reseller and Merchant of Record, Creem. See the refund policy.
Questions about slide layouts

A slide layout is the structure of a slide — how the boxes, arrows, columns and labels are arranged — separate from its colours, fonts and wording. Consulting firms reuse a small set of these structures because each one answers a different kind of question.

How do I know which slide layout to use?

Start from the question the slide answers, not from the look. If the slide says when things land, use a timeline. If it says how one thing advances, use a process flow. If the blocks can swap places without changing the meaning, they are parallel — use pillars or cards. If one point supports another, use a pyramid. Slideration works backwards from this: it reads the structure of your draft and shows you finished layouts built on the same structure.

How does Slideration match layouts to my slide?

It compares structure, not appearance. The search reads where the blocks, columns and connectors sit on your screenshot and finds library slides with the same arrangement, so a rough grey sketch still matches a finished, fully coloured layout. You can also drag a box over one part of your slide and search only that region.

Are these layouts copied from real McKinsey or BCG decks?

No. Every slide in the library is redrawn from scratch as an original file, and all of the text, numbers, company names and logos in them are fictional sample data. What is reused is the structure — the arrangement of shapes — which is not copyrightable. You are downloading an original file, not a copy of someone else’s slide.

Is the download a real PowerPoint file or just an image?

A real PowerPoint file. Every layout comes as a native .pptx built from actual shapes and text boxes, so you can edit the wording, recolour it to your brand, resize elements and delete what you do not need. There is no image to trace over and no font to install.

What does Slideration cost?

Searching the library is free and needs no account. Three sample PPTX templates are also free to download without signing in. Other editable PPTX downloads cost 1 credit per slide, and downloading the same slide again is free. New accounts get 2 free credits. Credits are bought once and never expire — there is no subscription.

What can I upload, and do you keep my slide?

Any screenshot in PNG, JPG, WebP, GIF or BMP, up to 15 MB. Uploaded images are used to run the search and are not stored; see the privacy policy for details.

Compare

Your slide ORIGINAL
Your slide
Library layout REFERENCE