Editable worksheets for clinical studies, diagnostics, laboratory operations, environmental metrics and financial reporting. Each file includes a fictional example and a fill-in slide. Downloads require sign-in and 1 credit per complete template file.
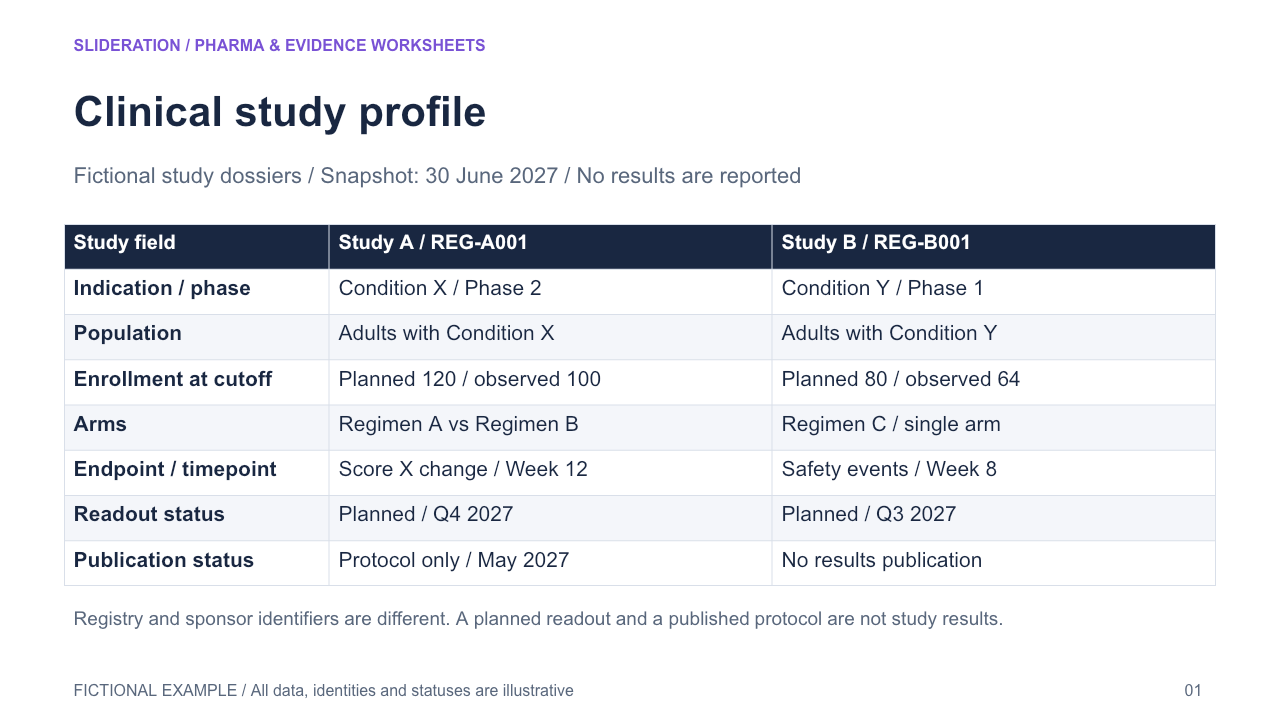
Clinical study profile
Stable study identity connects planned versus observed enrollment, indication, population, arms, endpoint timing and separate readout/publication status. Two aligned field cards replace a design timeline without implying outcomes.
Editable PPTX · 2 slides · 1 credit
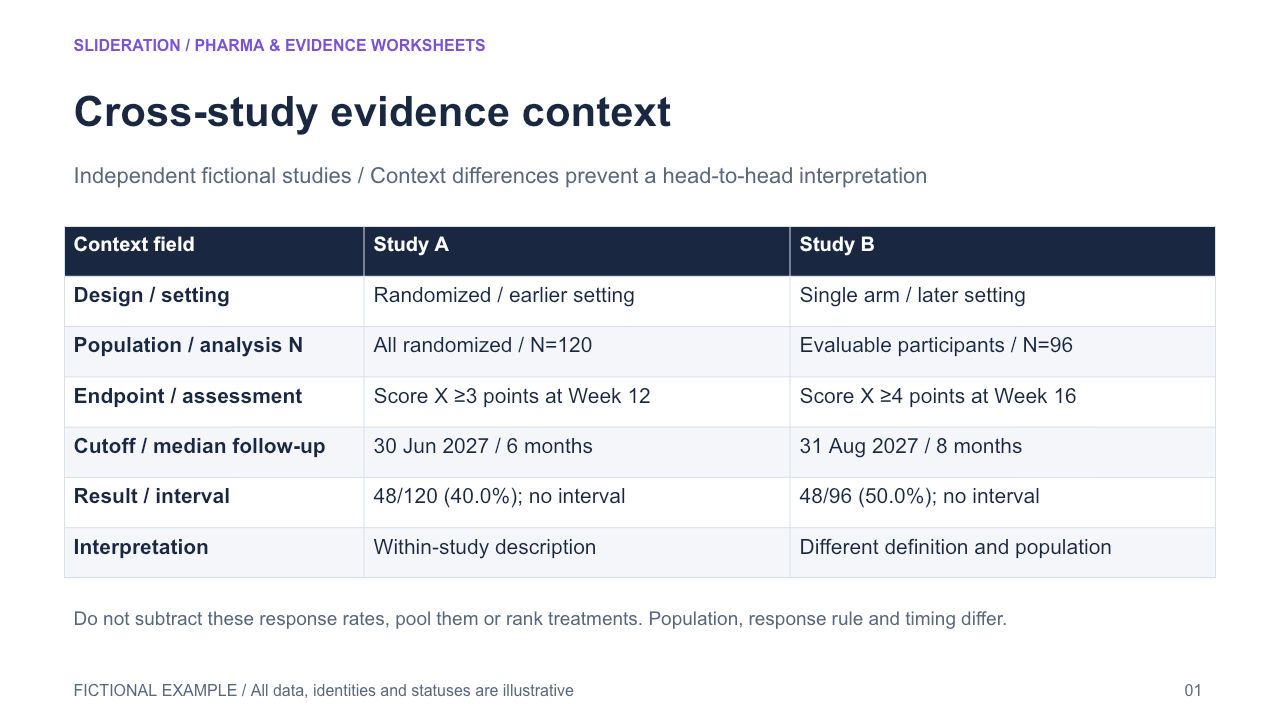
Cross-study evidence context
Distinct studies retain separate population, outcome definition, denominator, follow-up, analysis set and evidence limitations. Context differences remain visible beside descriptive results; no head-to-head ranking.
Editable PPTX · 2 slides · 1 credit
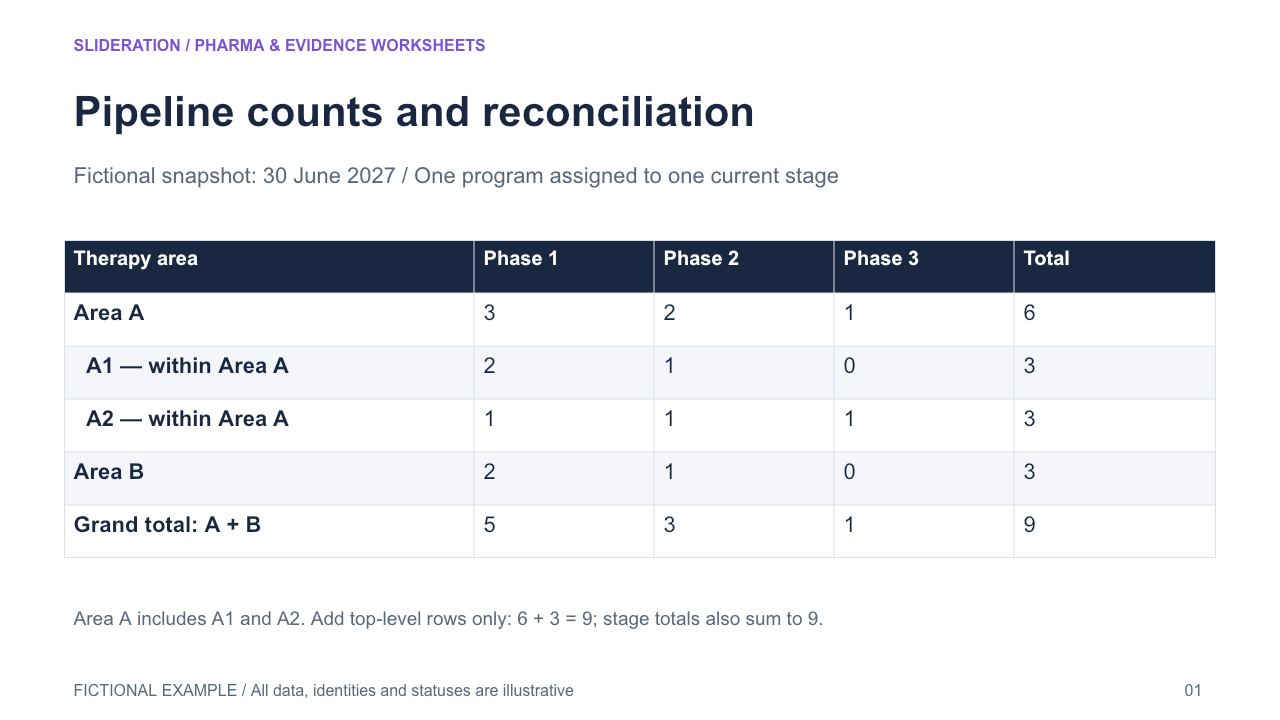
Pipeline counts and reconciliation
Therapy-area-by-stage counts have declared counting unit, indented child categories, row and column totals and an explicit reconciliation check. A subtotal is not added a second time.
Editable PPTX · 2 slides · 1 credit
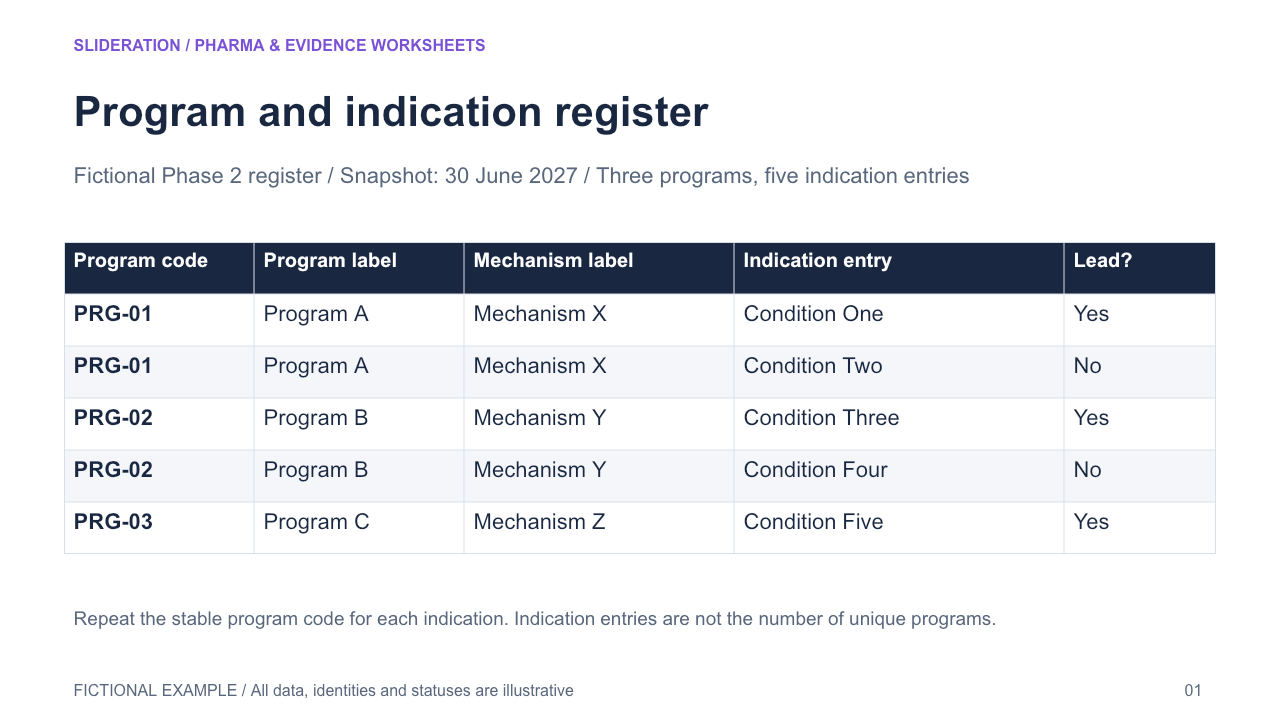
Program and indication register
Persistent fictional program code links mechanism to one or more indication rows within a declared stage snapshot. Distinguish unique program count from indication-entry count; leading indication is separately marked.
Editable PPTX · 2 slides · 1 credit
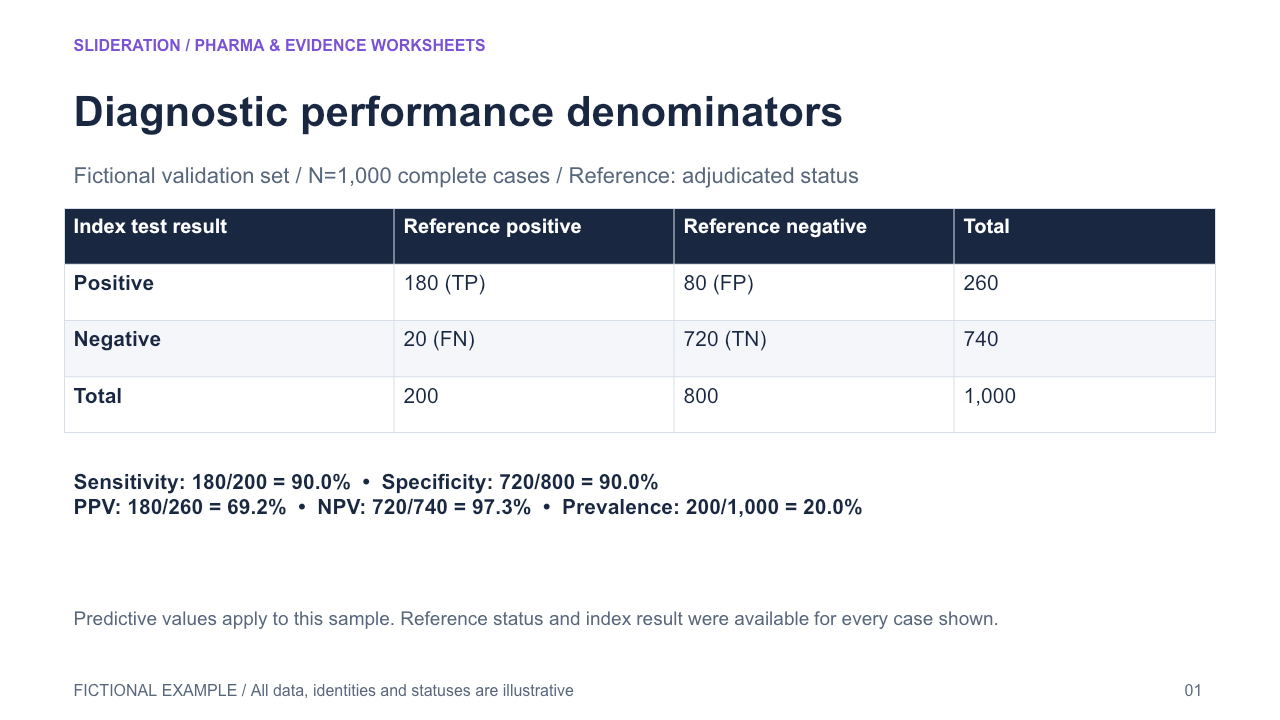
Diagnostic performance denominators
A reference-standard 2x2 count matrix links test result and condition status to sensitivity, specificity, predictive values and prevalence, with each denominator visible.
Editable PPTX · 2 slides · 1 credit
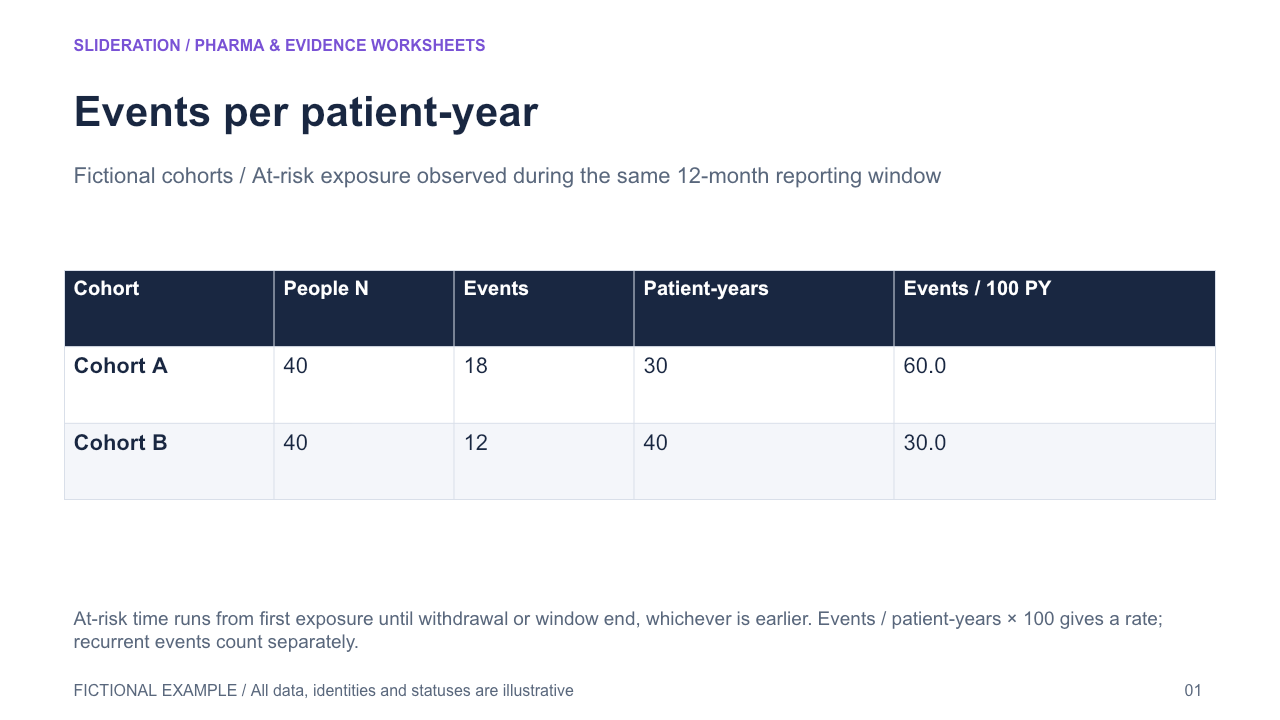
Events per patient-year
Cohort N, recurrent event count, total observed patient-years, observation window and events per 100 patient-years remain linked. Rate is not a proportion of unique people.
Editable PPTX · 2 slides · 1 credit
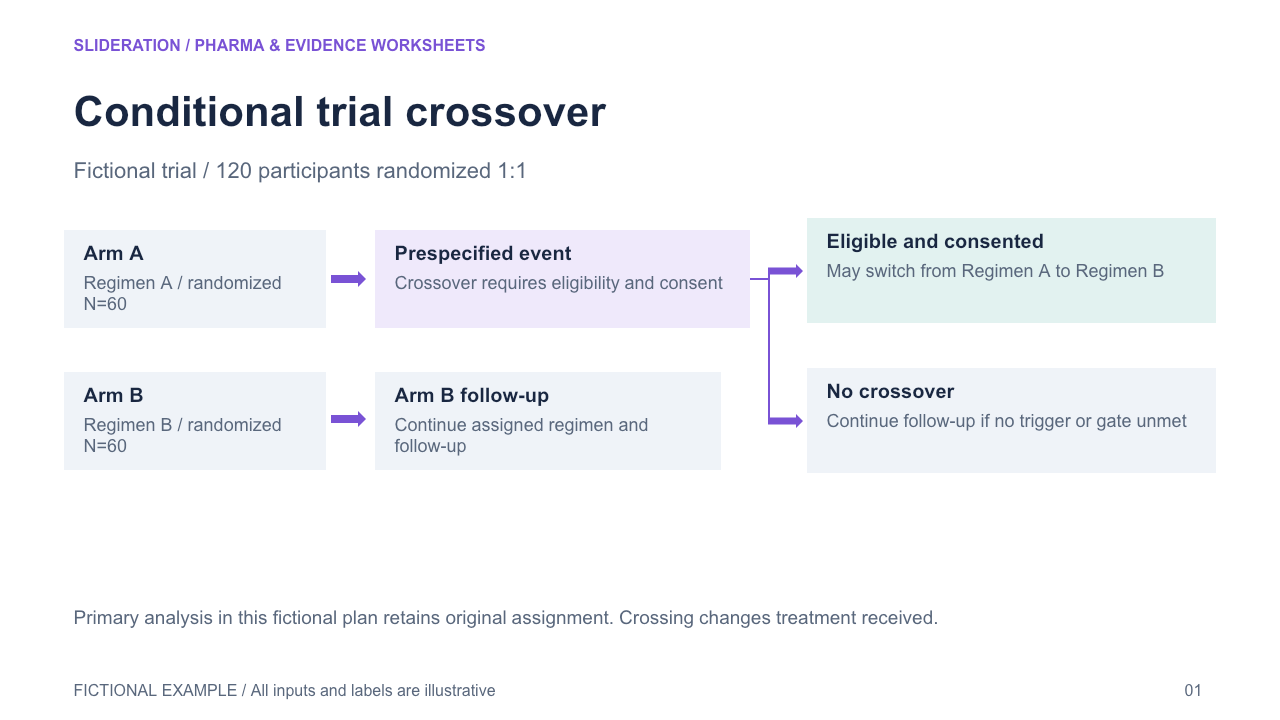
Conditional trial crossover
Randomized-arm lanes connect to a post-event eligibility gate, with optional crossover and no-crossover exits distinguished. Original assignment remains visible after treatment switches.
Editable PPTX · 2 slides · 1 credit
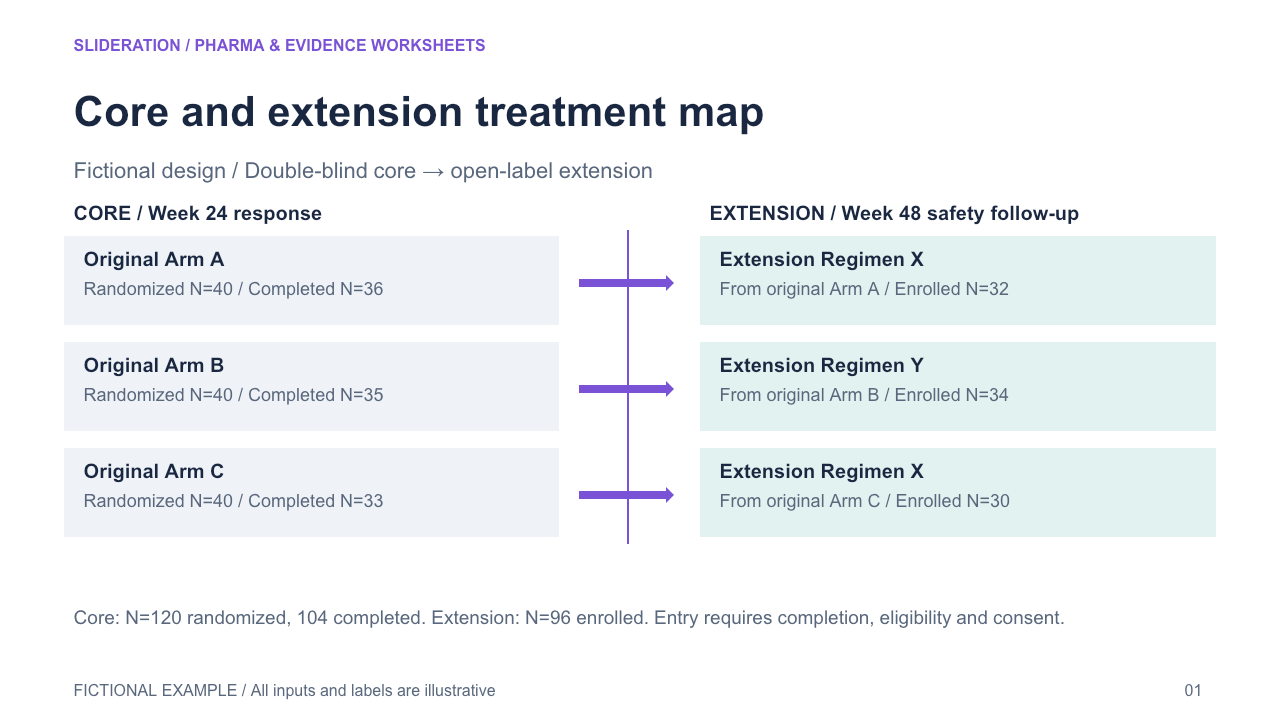
Core and extension treatment map
Each original core-trial arm maps to a separately labeled extension regimen across a core endpoint, eligibility/consent transition, extension window and safety follow-up. Core, completed and extension populations are distinct.
Editable PPTX · 2 slides · 1 credit
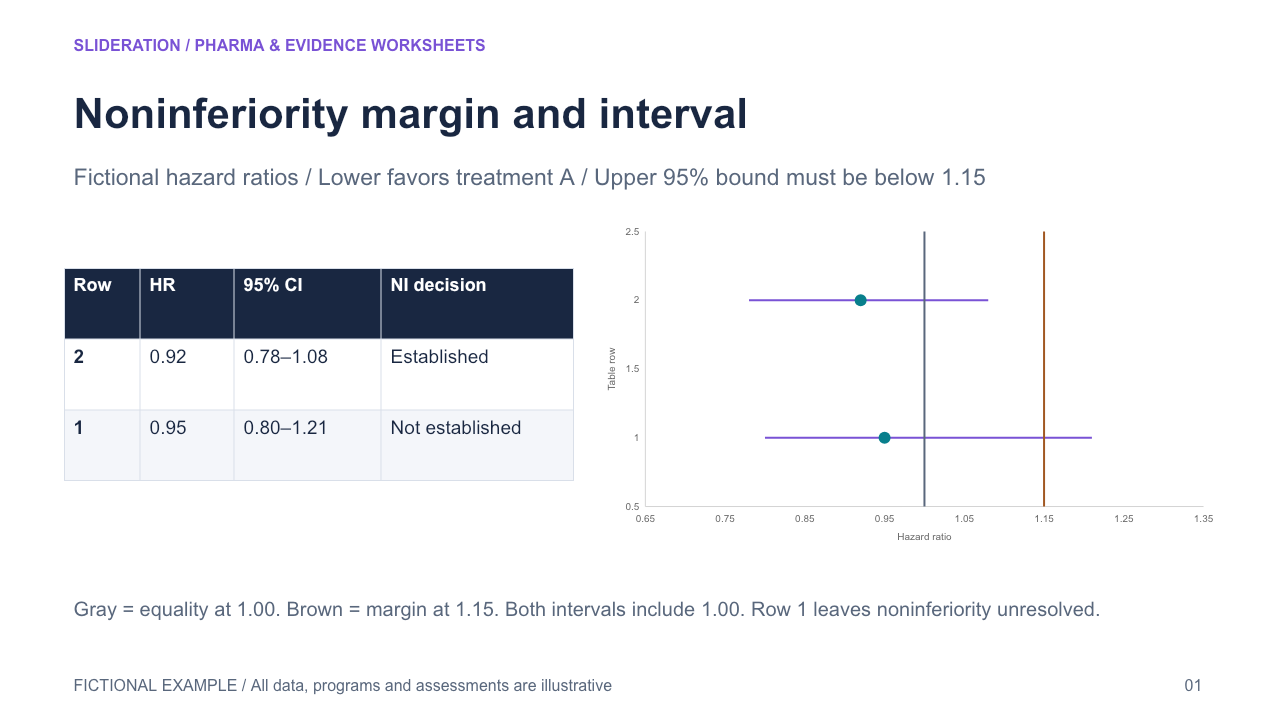
Noninferiority margin and interval
A prespecified effect-scale margin and no-effect reference sit beside the estimate and interval, with endpoint direction, analysis population and decision rule explicit. Noninferiority and superiority remain separate questions.
Editable PPTX · 2 slides · 1 credit
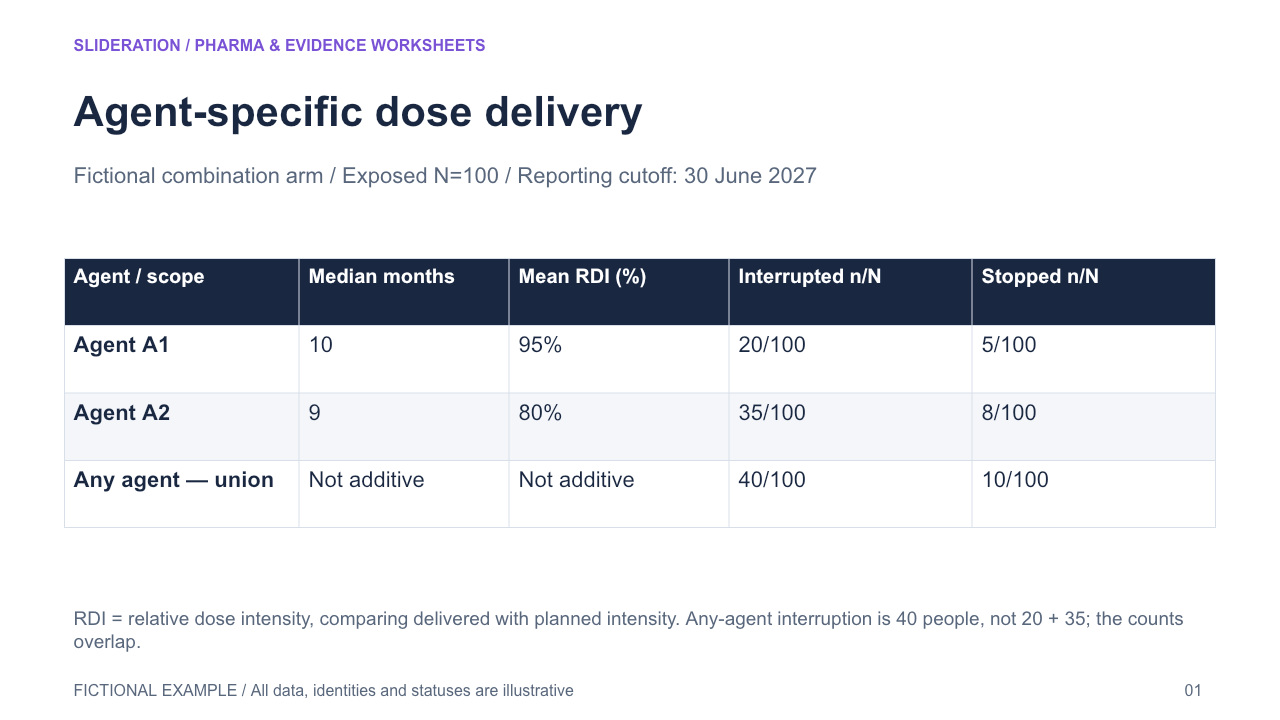
Agent-specific dose delivery
An arm contains multiple agents; duration, relative dose intensity and interruption/discontinuation retain agent identity, while arm-level any-agent counts are separately reported.
Editable PPTX · 2 slides · 1 credit
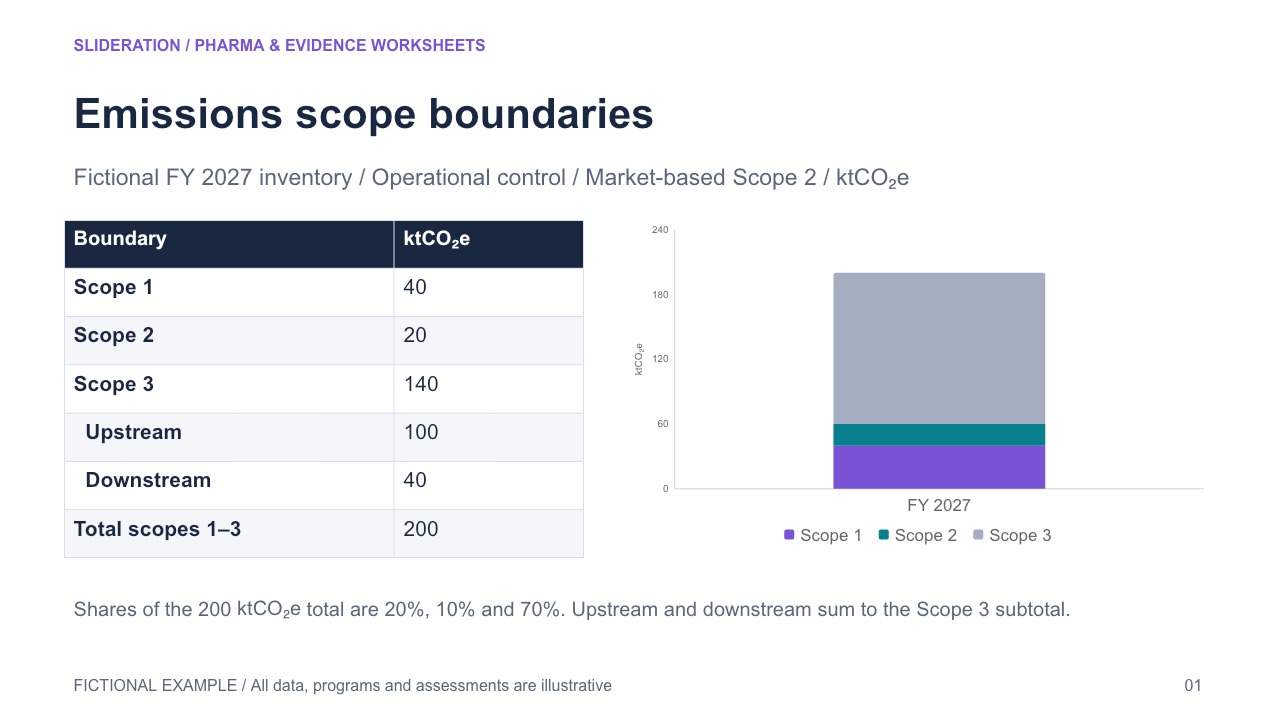
Emissions scope boundaries
Declared reporting boundary links Scope1/2/3 inventory values to the share denominator and nested upstream/downstream components without double counting.
Editable PPTX · 2 slides · 1 credit
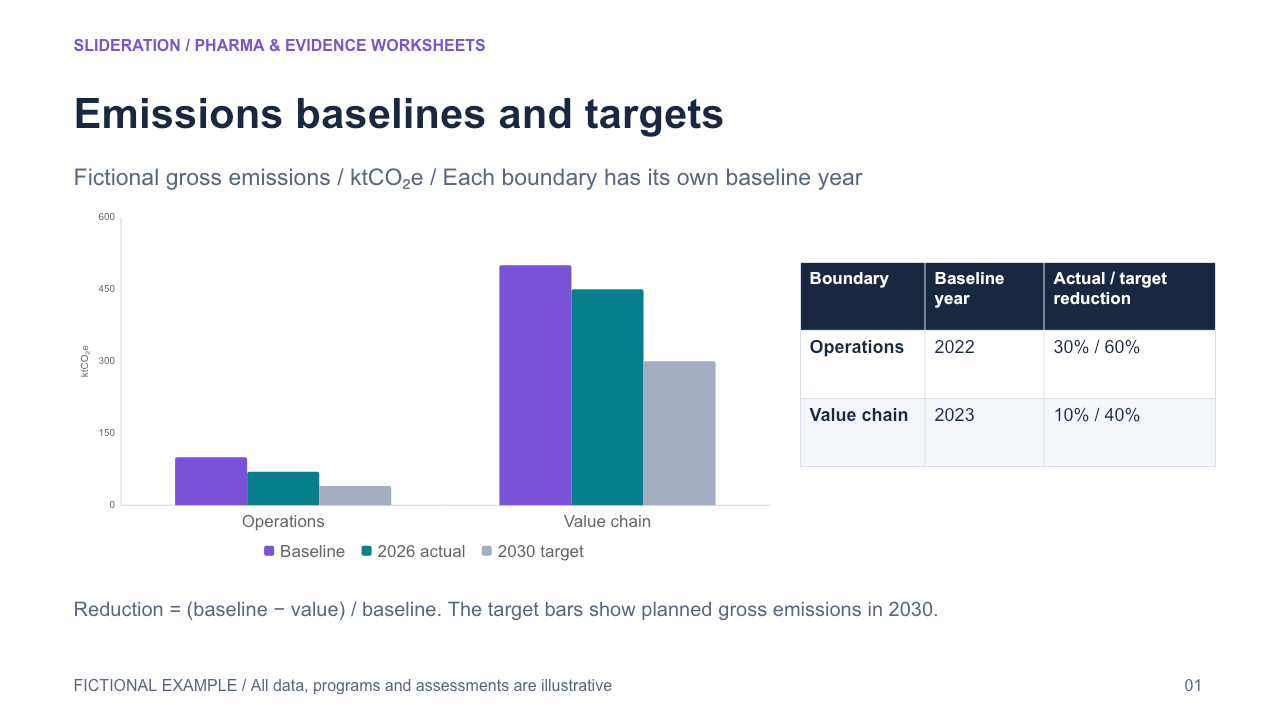
Emissions baselines and targets
Each emissions boundary retains its own baseline year/value, actual cutoff/value and target year/value, with within-boundary reduction arithmetic. Different baselines are not silently pooled.
Editable PPTX · 2 slides · 1 credit
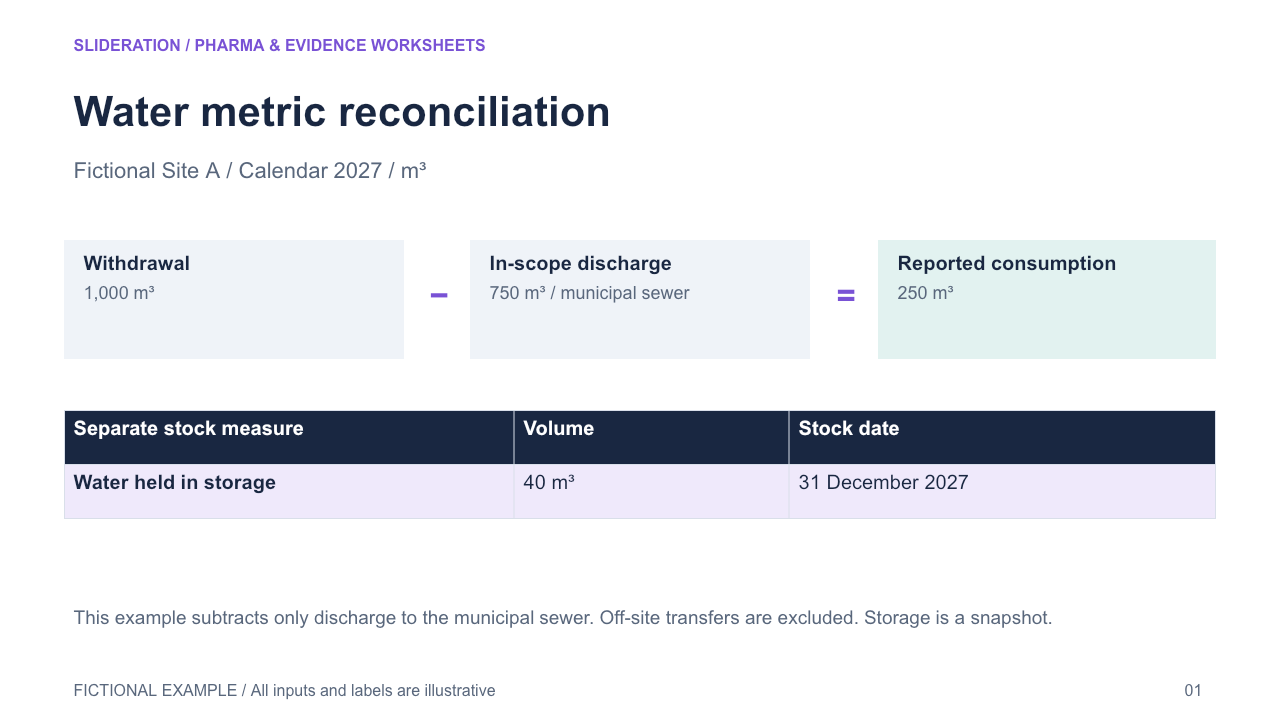
Water metric reconciliation
Period withdrawal and discharge reconcile to reported consumption under an explicit illustrative definition; end-period storage is separated as a stock. Site/boundary and units remain attached.
Editable PPTX · 2 slides · 1 credit
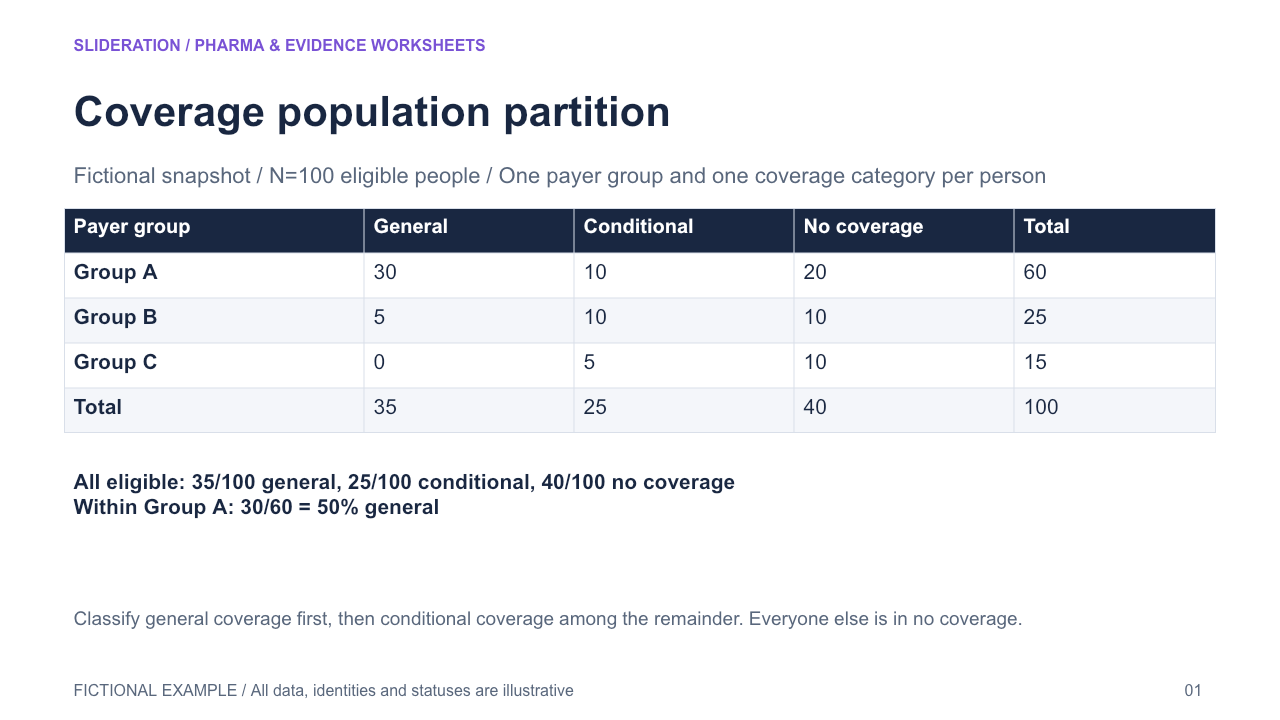
Coverage population partition
A joint payer-by-coverage table preserves the total-population denominator, disjoint coverage rules and payer subtotals. Marginal payer and coverage summaries derive from the same cell counts.
Editable PPTX · 2 slides · 1 credit
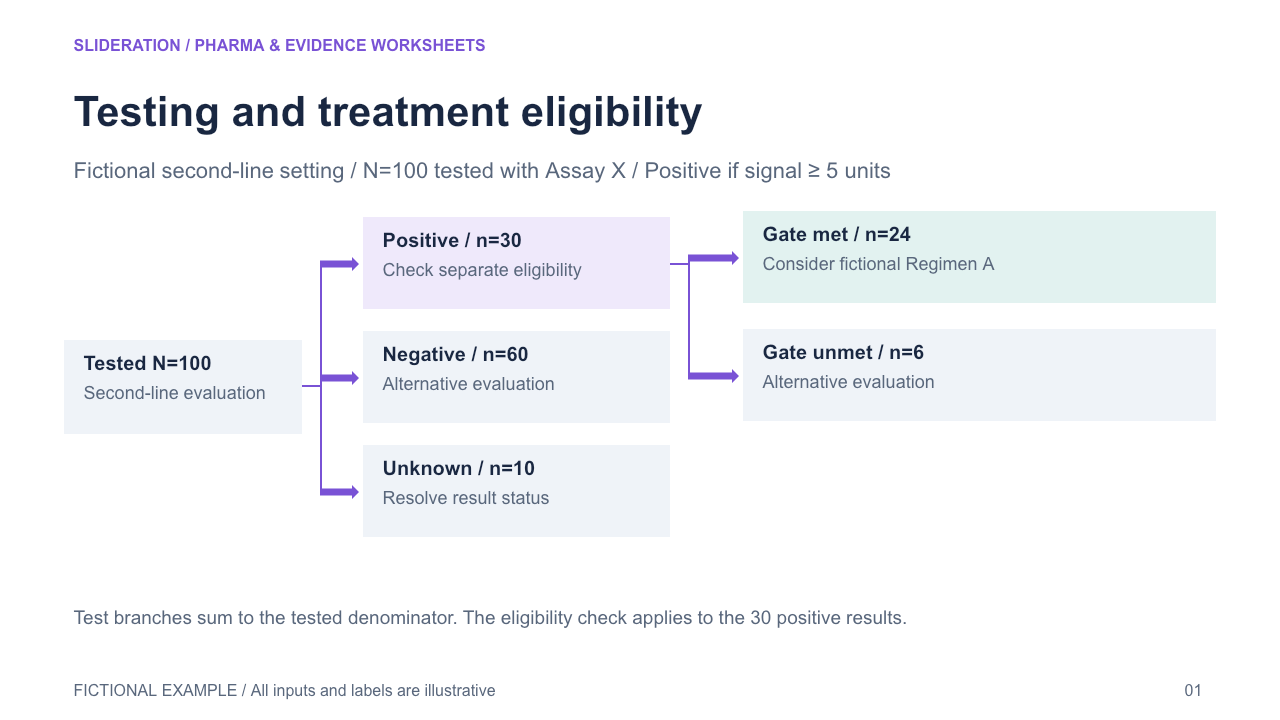
Testing and treatment eligibility
Prior research setting, a testing step, positive/negative/unknown results and additional eligibility review are separate gates before a fictional treatment-study consideration.
Editable PPTX · 2 slides · 1 credit
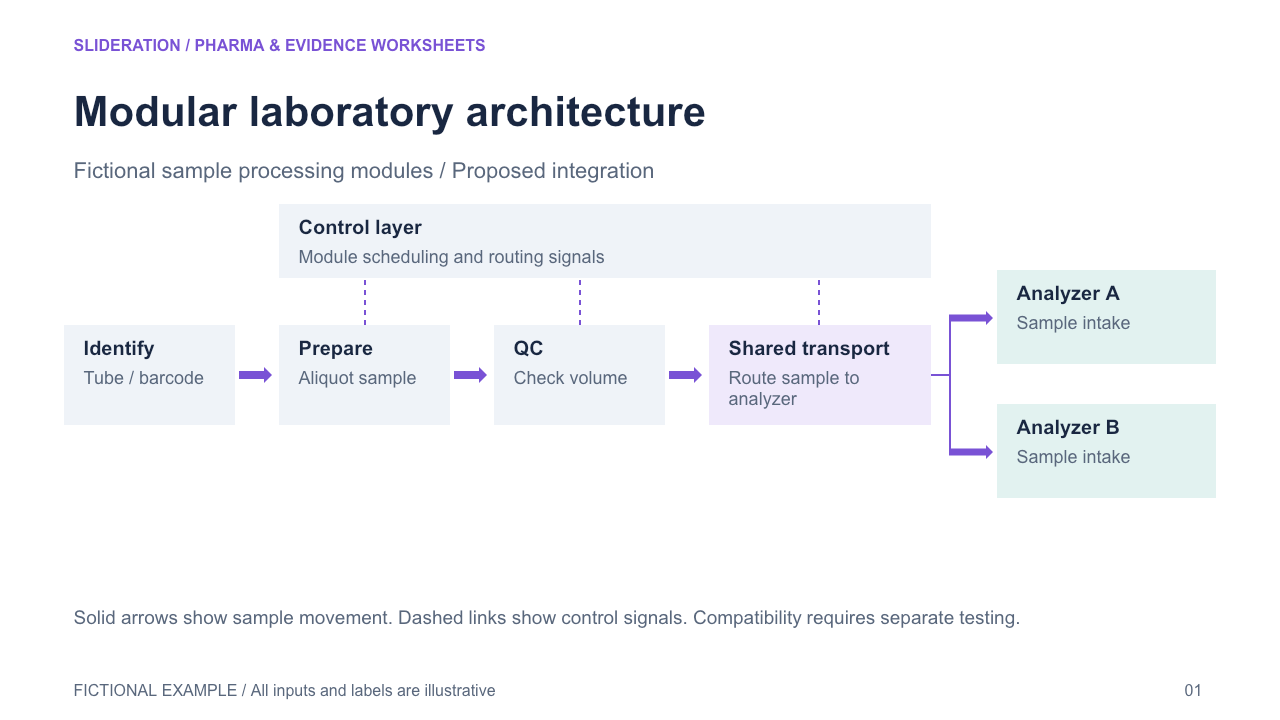
Modular laboratory architecture
Pre-analytic modules, a shared transport backbone and analytic destinations retain their physical sample-flow connections; a separate control/data layer is distinguished from material transfer.
Editable PPTX · 2 slides · 1 credit
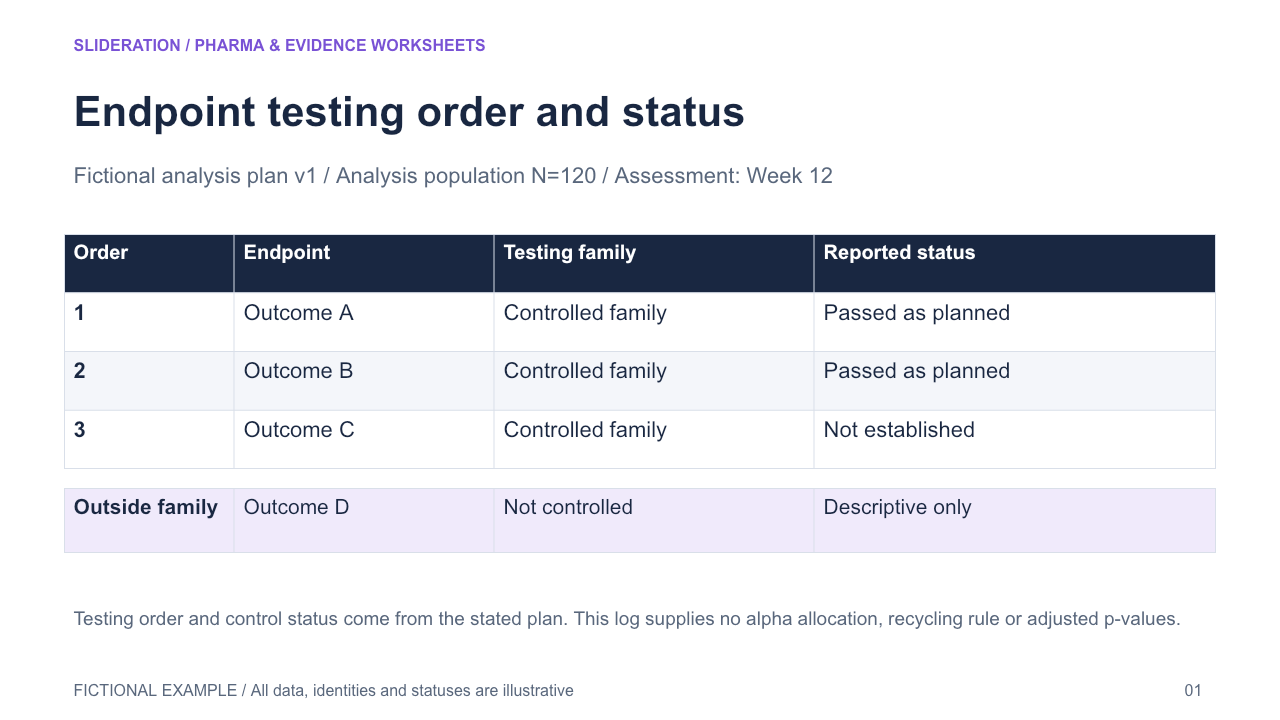
Endpoint testing order and status
Prespecified ordered endpoint rows retain multiplicity-control status, analysis population/timepoint and claim status; additional nominal analyses are visibly outside the ordered family.
Editable PPTX · 2 slides · 1 credit
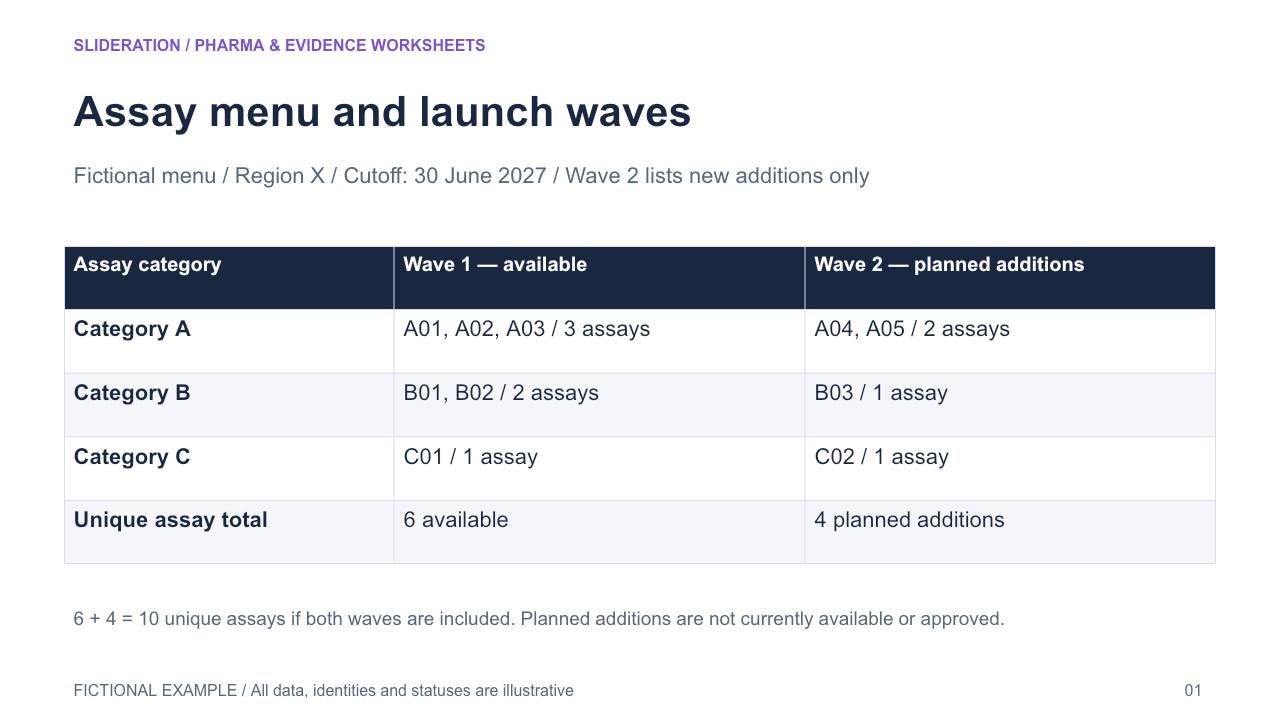
Assay menu and launch waves
Assay identity and category link to first versus later launch wave and availability state, with mutually exclusive assignment and distinct planned/available counts.
Editable PPTX · 2 slides · 1 credit
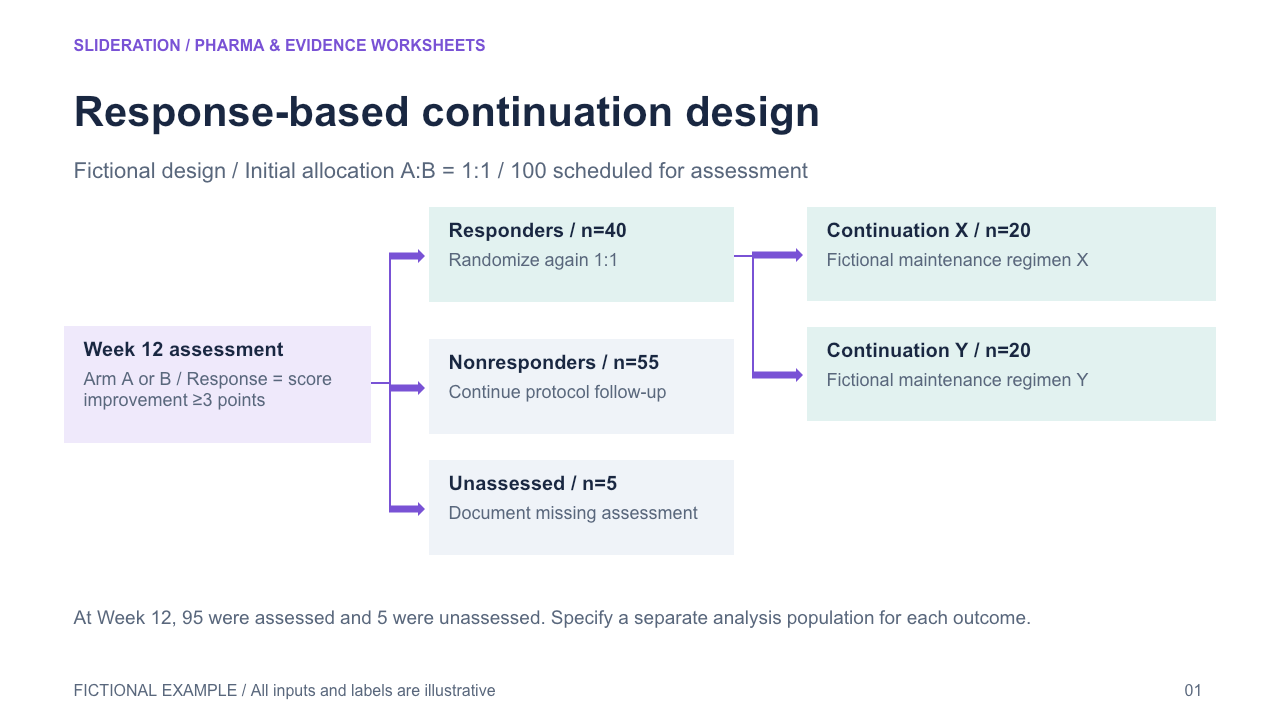
Response-based continuation design
An initial assignment leads to a timed response assessment; responders and nonresponders follow different continuation paths, and a second randomization is explicitly confined to the eligible response subgroup.
Editable PPTX · 2 slides · 1 credit
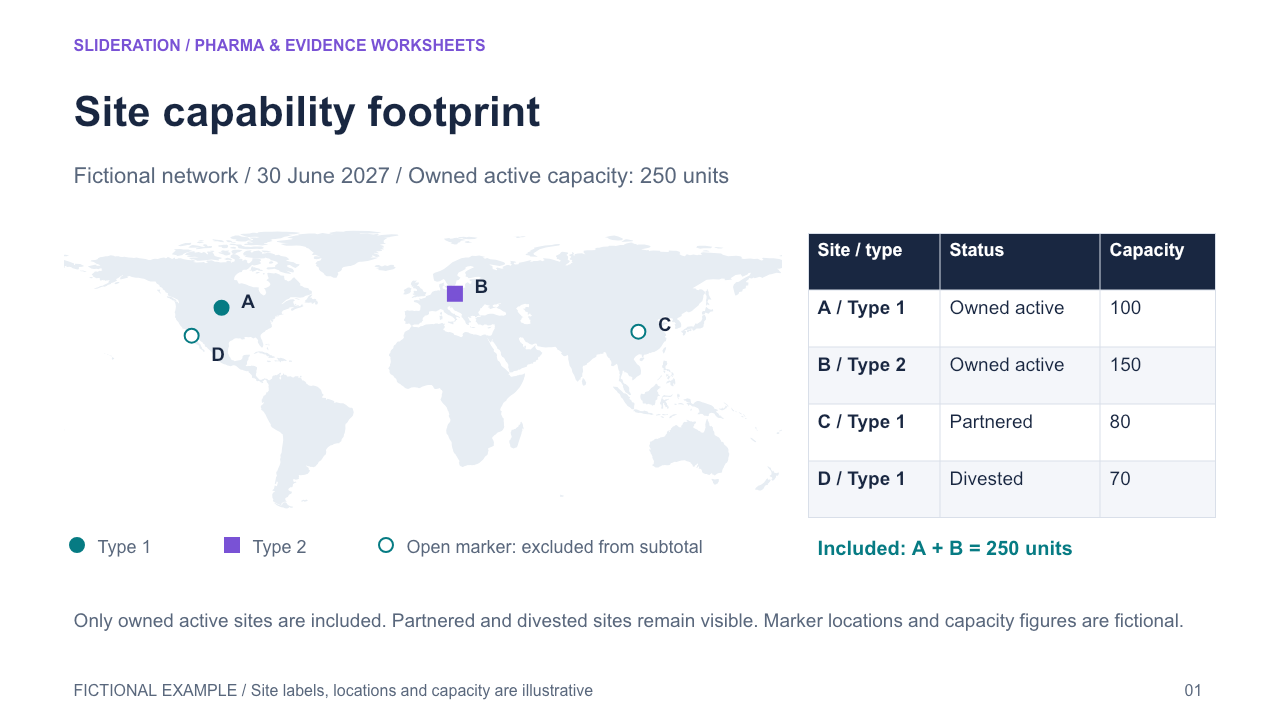
Site capability footprint
Geographically located sites retain capability category, operational status and inclusion in a declared capacity subtotal. A divested/partnered site is marked separately from owned active capacity.
Editable PPTX · 2 slides · 1 credit
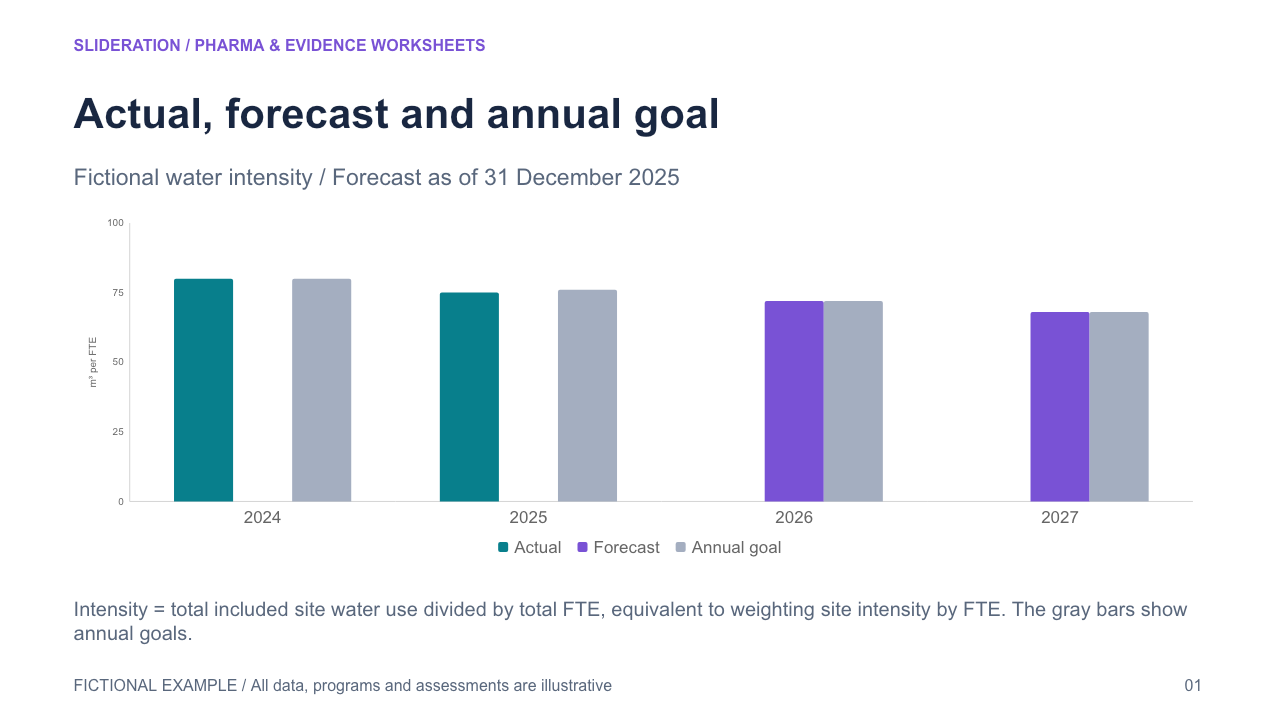
Actual, forecast and annual goal
A time-series performance measure separates observed values from forecast values and an independently defined annual goal, retaining the intensity denominator and forecast-as-of date.
Editable PPTX · 2 slides · 1 credit
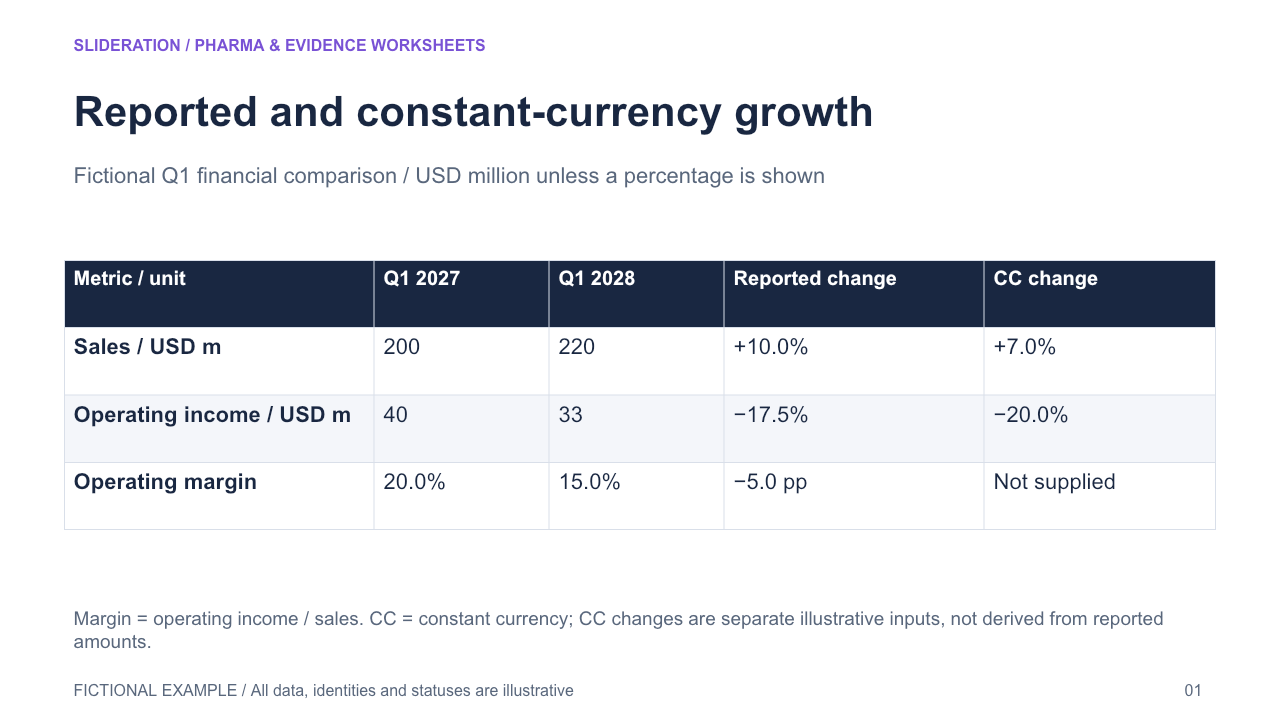
Reported and constant-currency growth
A same-period financial scorecard retains prior/current reported amounts, reported versus constant-currency growth, and typed margin changes in percentage points. Missing CC entries remain unavailable.
Editable PPTX · 2 slides · 1 credit
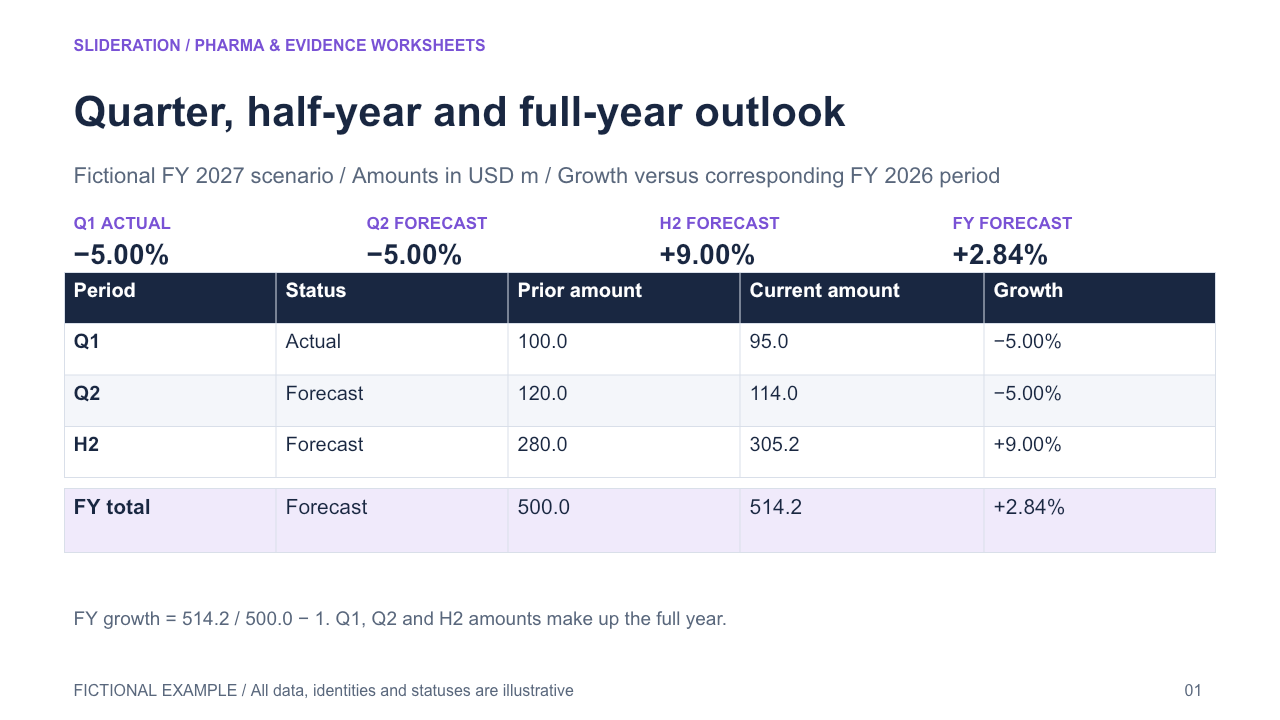
Quarter, half-year and full-year outlook
Quarter, half-year and full-year growth retain their different prior-period denominators, actual versus forecast status, and standalone versus cumulative scope. Full-year change is reconciled from amounts, not added growth rates.
Editable PPTX · 2 slides · 1 credit
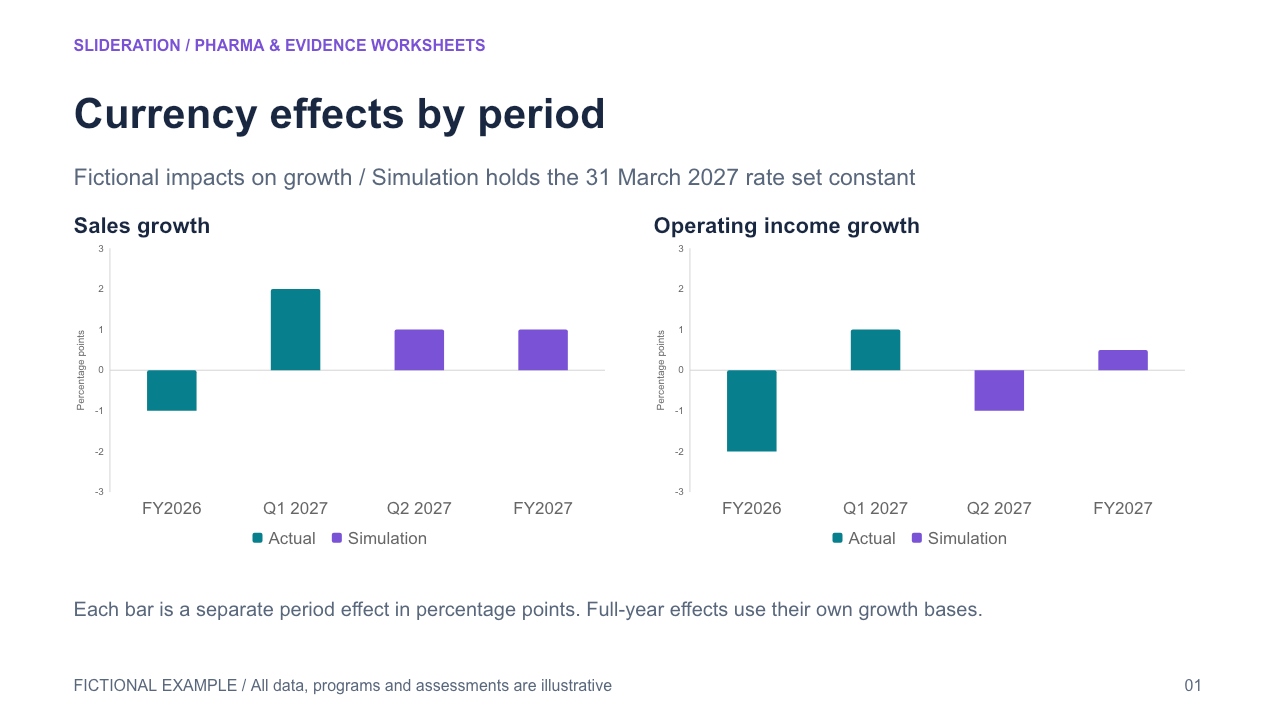
Currency effects by period
Two financial measures retain period-specific FX impact in percentage points, actual versus simulated status and a shared exchange-rate assumption. Full-year effects are separate estimates, not cumulative quarter bars.
Editable PPTX · 2 slides · 1 credit
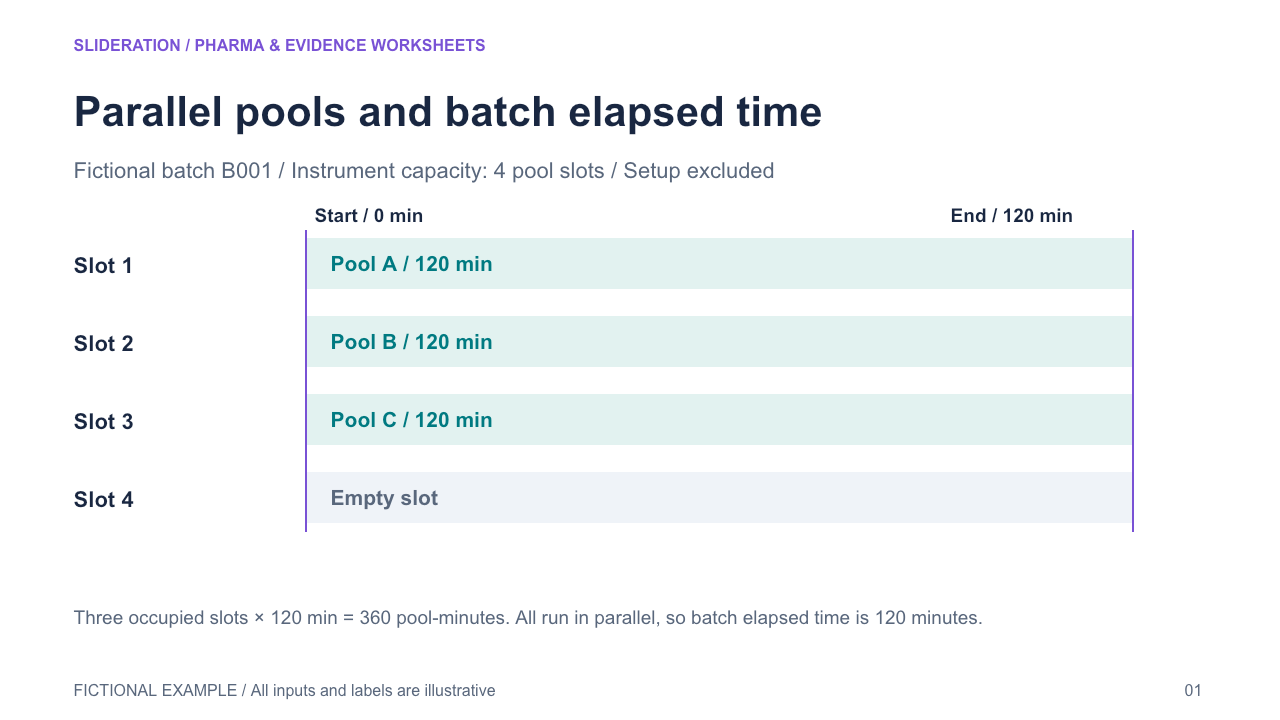
Parallel pools and batch elapsed time
One instrument batch contains independently identified pool slots running concurrently; batch elapsed time is separate from summed pool-minutes, with capacity and empty slots explicit.
Editable PPTX · 2 slides · 1 credit
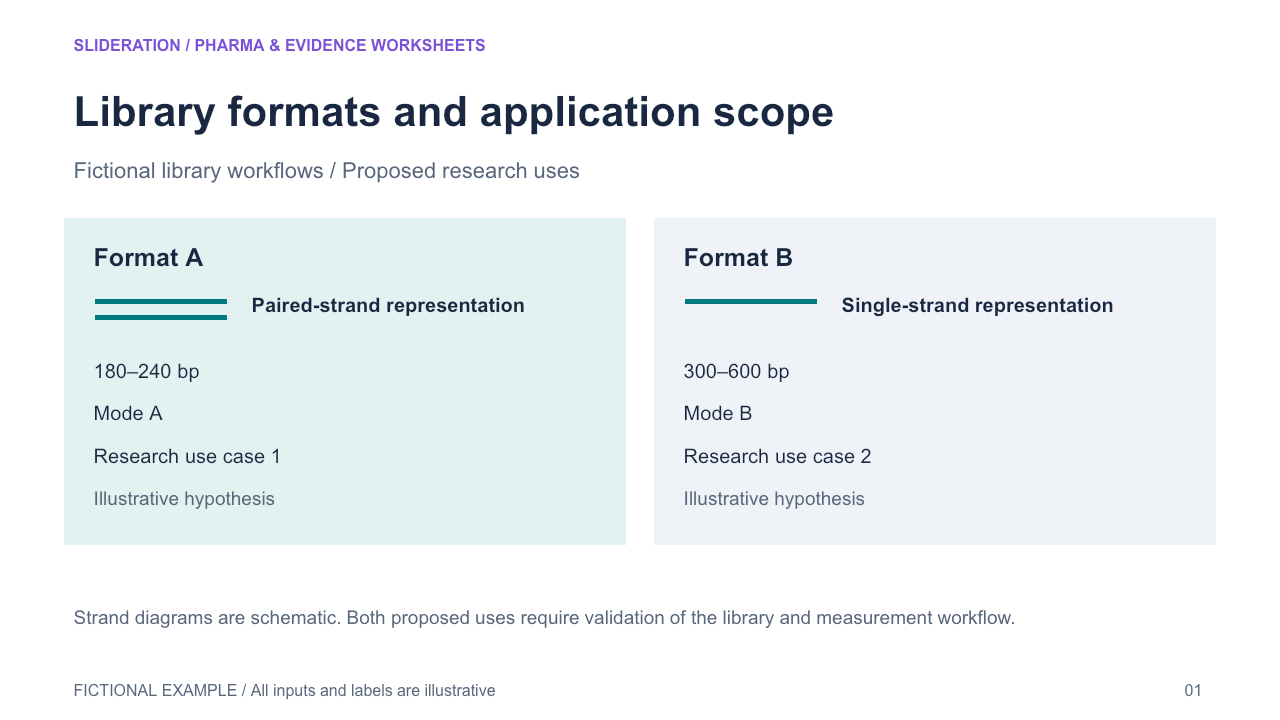
Library formats and application scope
Input-library format, read-length range, measurement mode and proposed application scope remain associated by workflow option, with demonstrated versus future-use evidence status explicit.
Editable PPTX · 2 slides · 1 credit
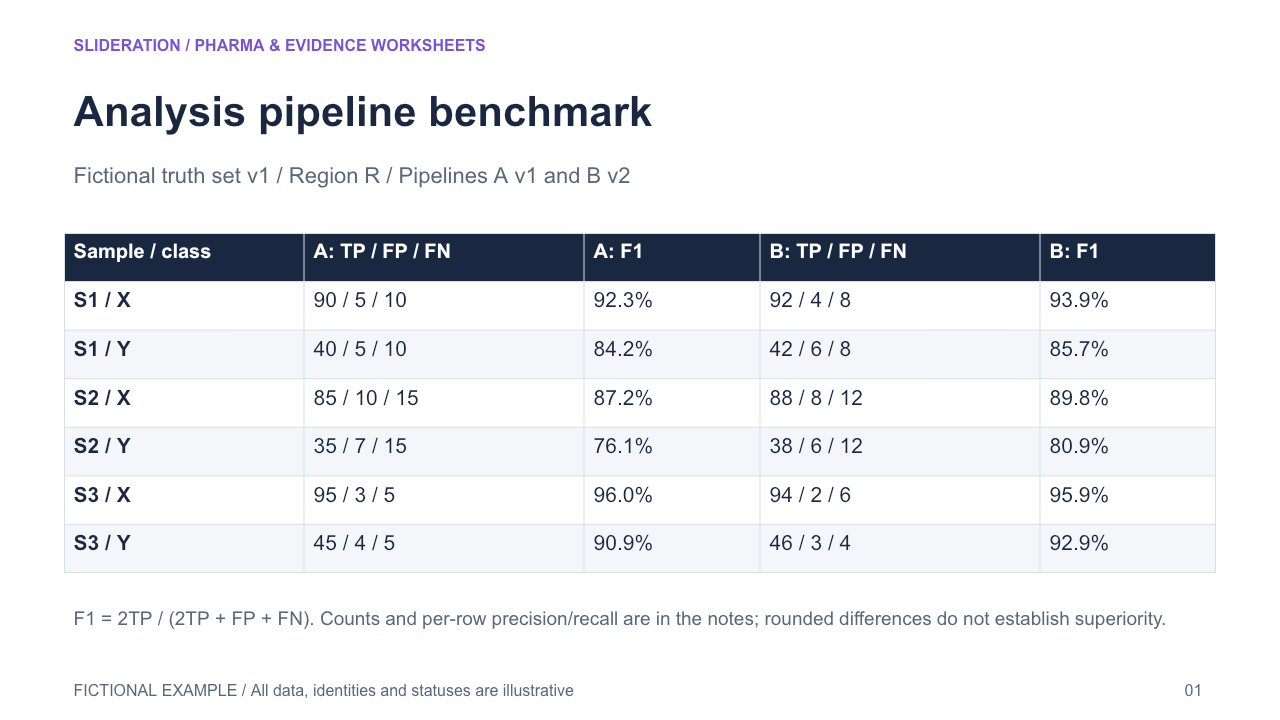
Analysis pipeline benchmark
Same reference samples and variant classes are evaluated by two pipelines; per-sample/class TP/FP/FN counts generate paired precision/recall/F1 with a declared reference-region/evaluation scope.
Editable PPTX · 2 slides · 1 credit
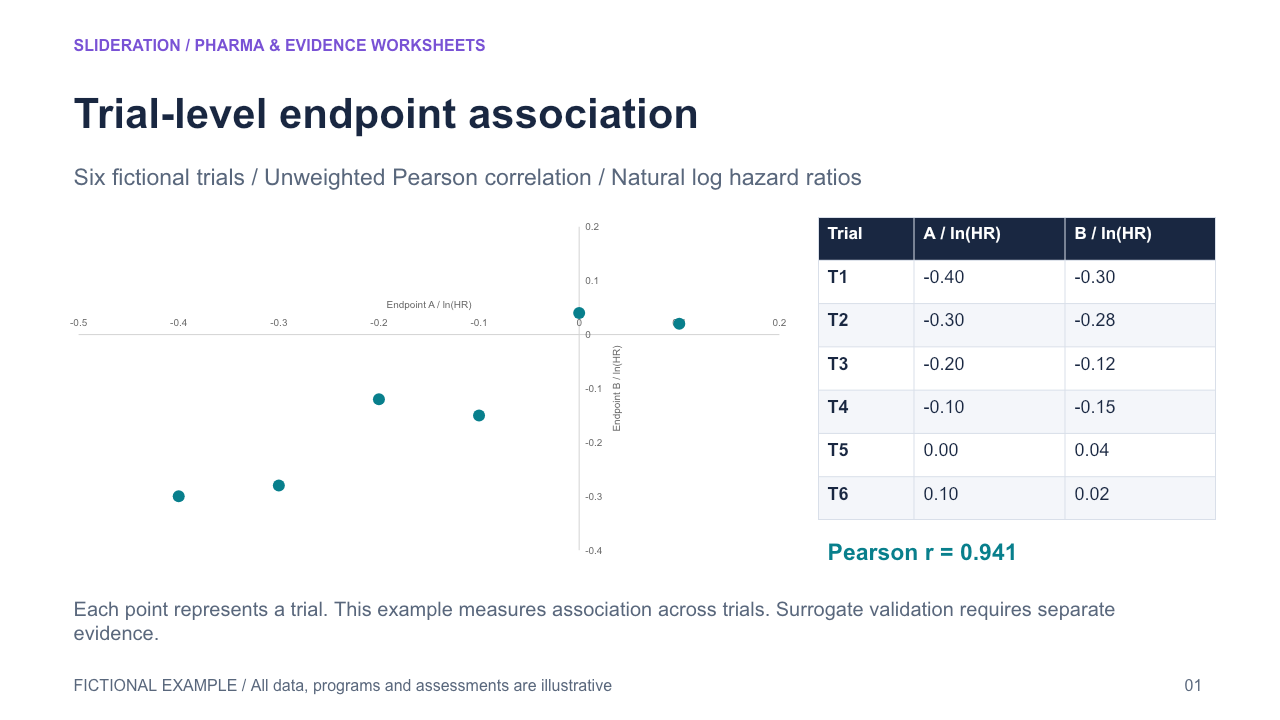
Trial-level endpoint association
Each plotted point is one trial with paired log-effect estimates for two endpoints; the trial count, effect scales and unweighted association statistic retain the aggregate unit of analysis.
Editable PPTX · 2 slides · 1 credit
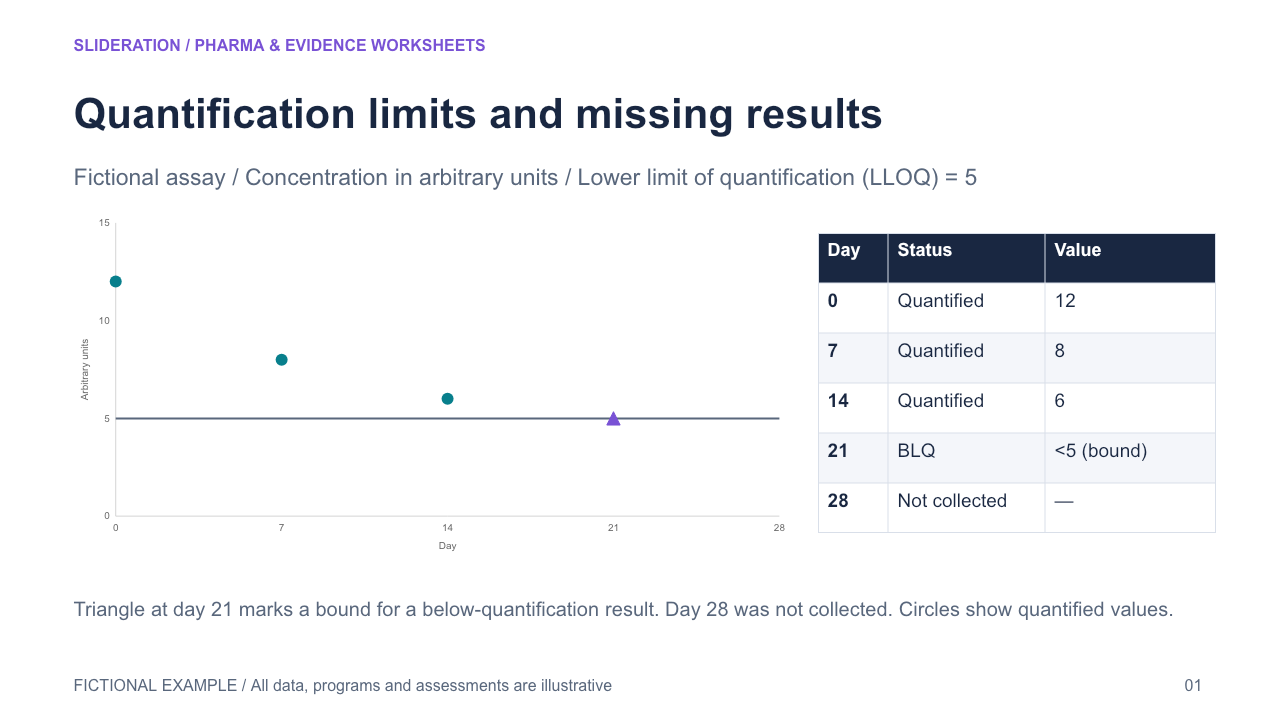
Quantification limits and missing results
Quantified observations, below-quantification-limit results and not-collected measurements have distinct states, units and plot treatment; a known assay limit is not a measured concentration.
Editable PPTX · 2 slides · 1 credit
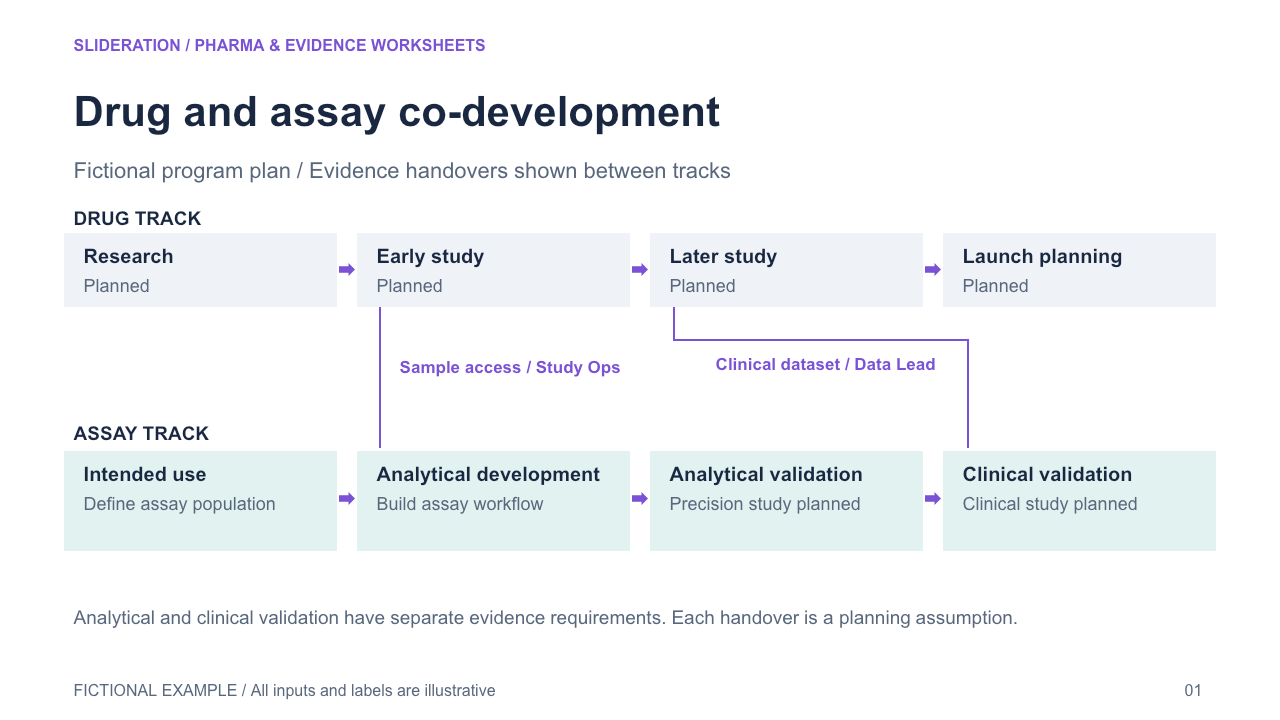
Drug and assay co-development
Drug-development and assay-development tracks have separate stage identities and planned evidence handovers; intended use, analytical validation and clinical validation are distinguished rather than collapsed into a generic launch date.
Editable PPTX · 2 slides · 1 credit
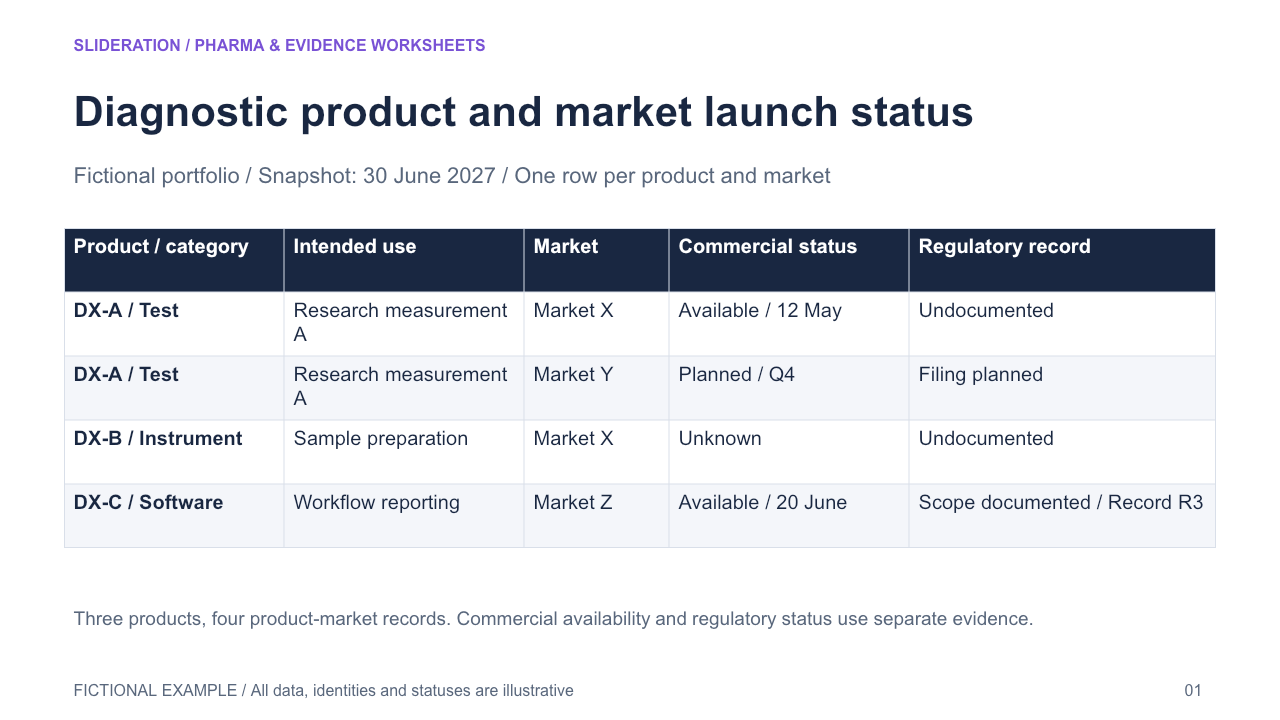
Diagnostic product and market launch status
Product identifier and category link the intended-use summary, market, dated commercial availability and separately evidenced regulatory status. One record per product-market pair makes staggered launches visible.
Editable PPTX · 2 slides · 1 credit
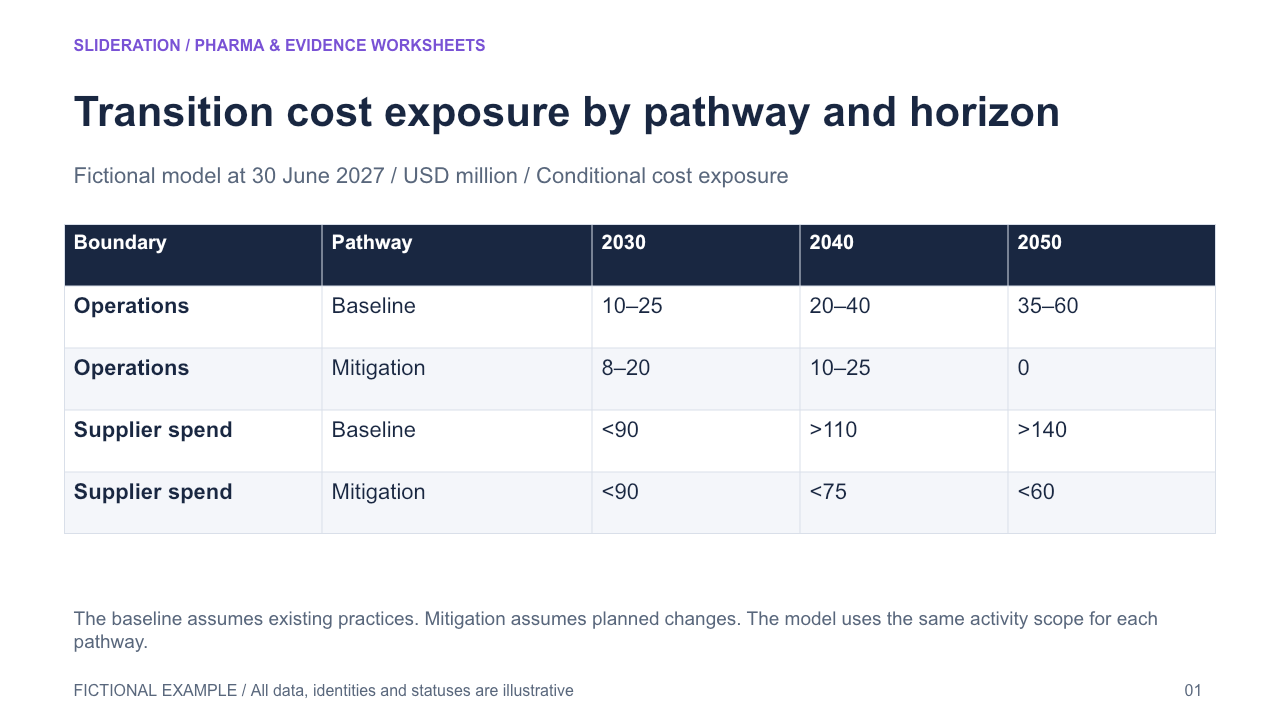
Transition cost exposure by pathway and horizon
Compare modeled cost exposure by operating boundary, baseline or mitigation pathway, and horizon while retaining point, interval and one-sided bounds as different data types.
Editable PPTX · 2 slides · 1 credit
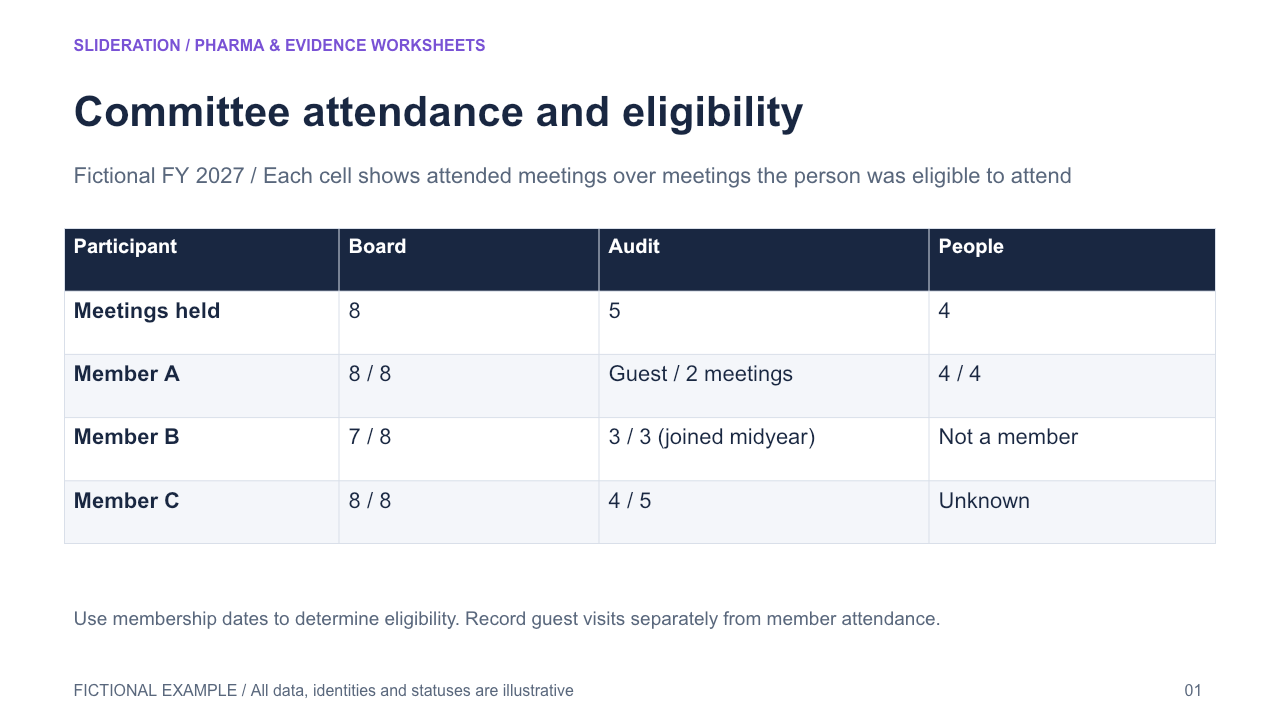
Committee attendance and eligibility
Link scheduled meetings to person-committee eligibility, actual attendance, guest participation and partial-period membership without using a universal denominator for each cell.
Editable PPTX · 2 slides · 1 credit
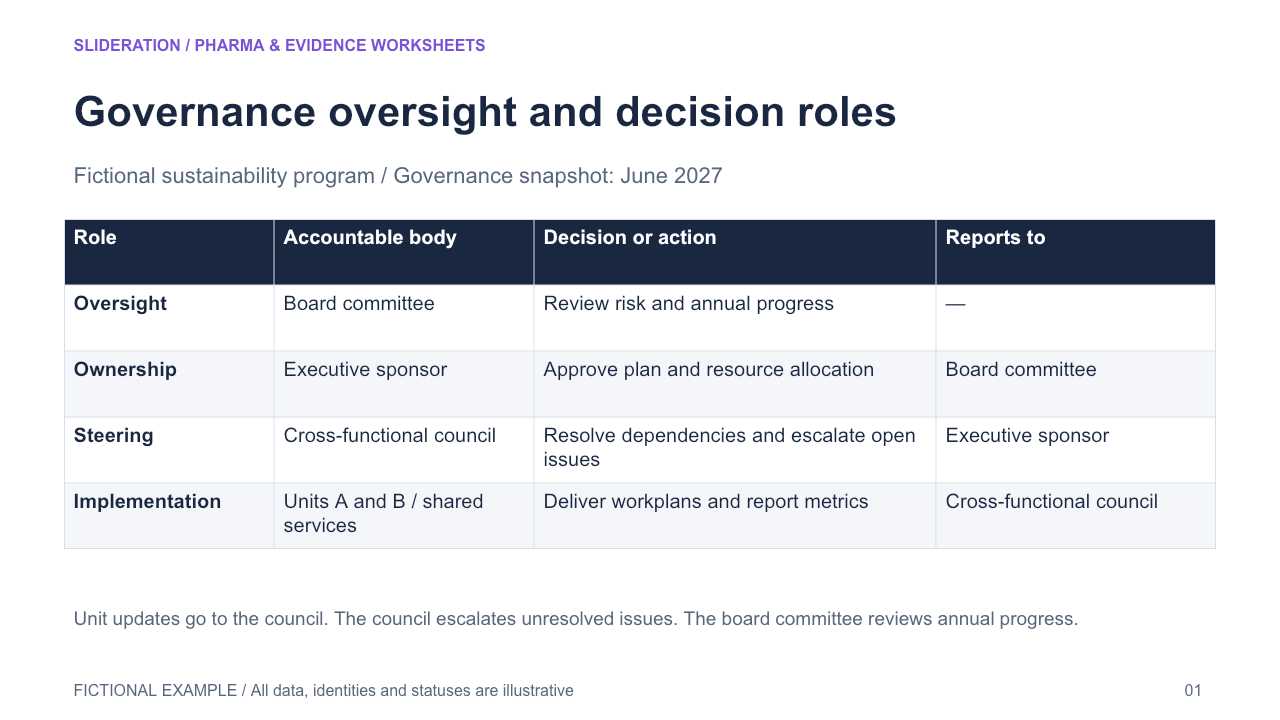
Governance oversight and decision roles
Map distinct governance duties to bodies, decisions or outputs, then show which business units implement them. Preserve oversight and operational accountability as separate roles.
Editable PPTX · 2 slides · 1 credit
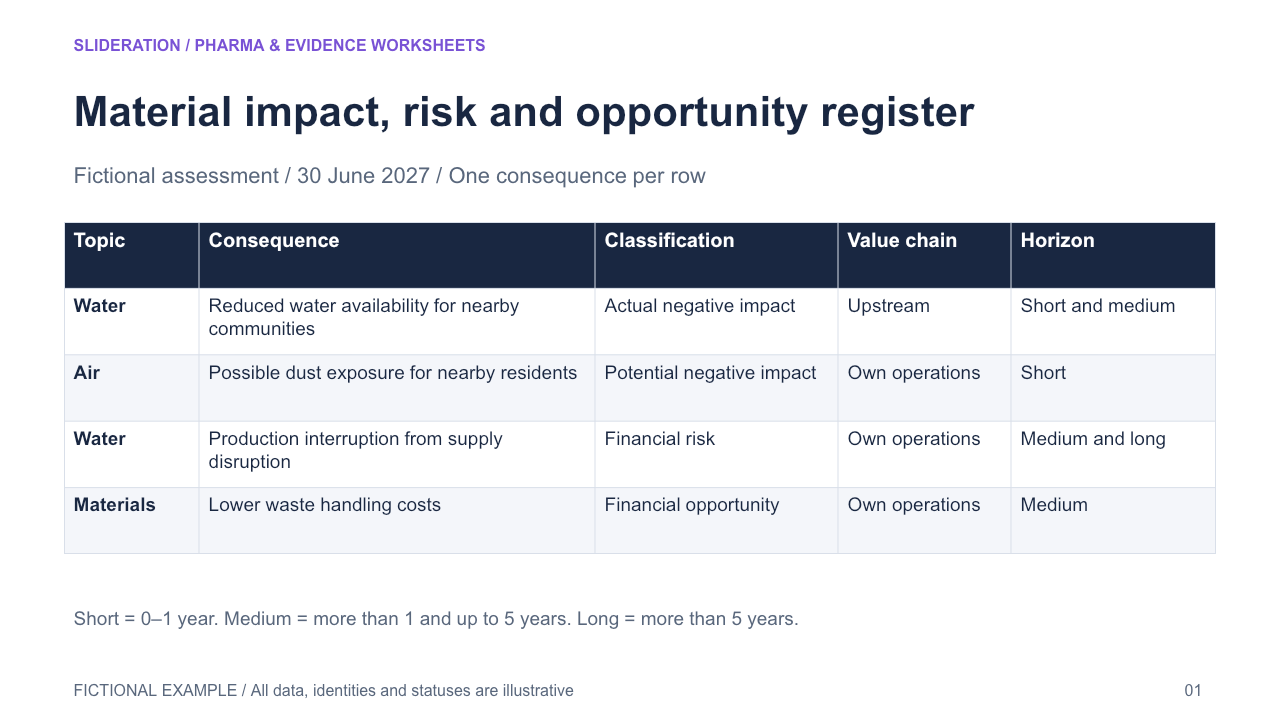
Material impact, risk and opportunity register
Record each material issue by consequence, classification, value-chain boundary and applicable time horizons, with separate environmental or social impacts and financial risks or opportunities.
Editable PPTX · 2 slides · 1 credit
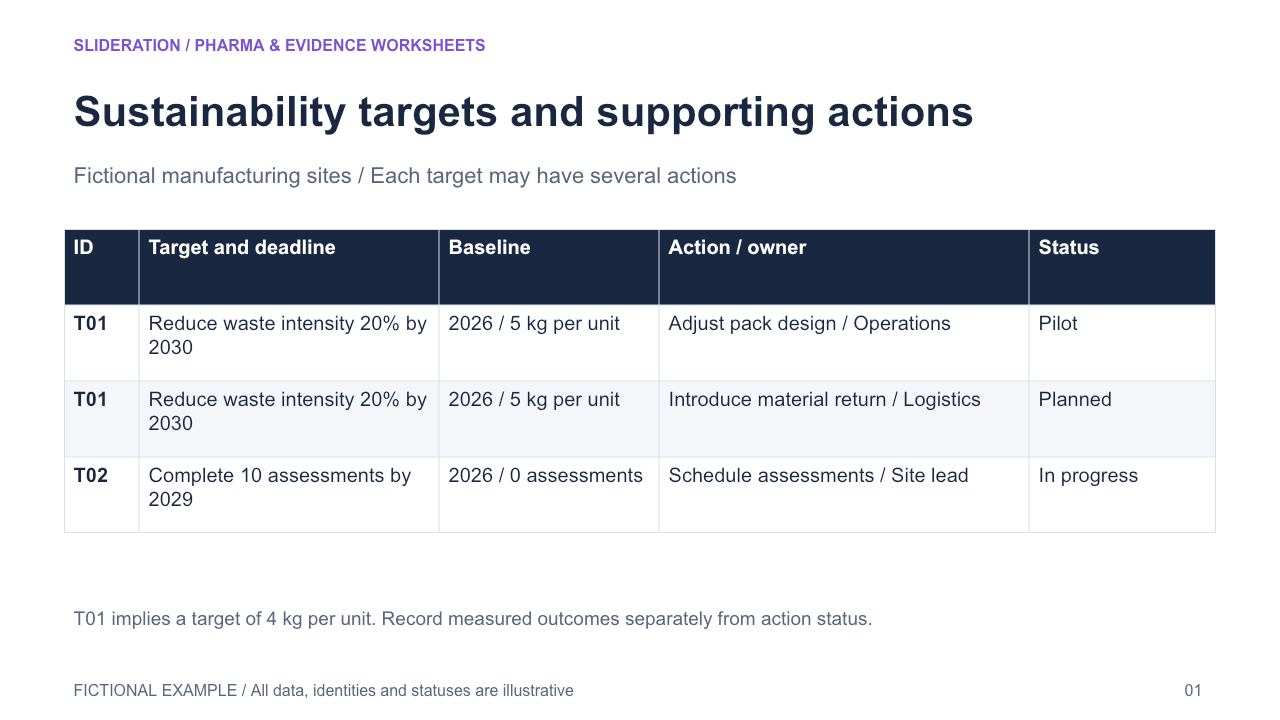
Sustainability targets and supporting actions
Map a dated target and its baseline or reference point to supporting actions. Preserve metric, boundary and target unit while keeping implementation status and observed outcomes separate.
Editable PPTX · 2 slides · 1 credit
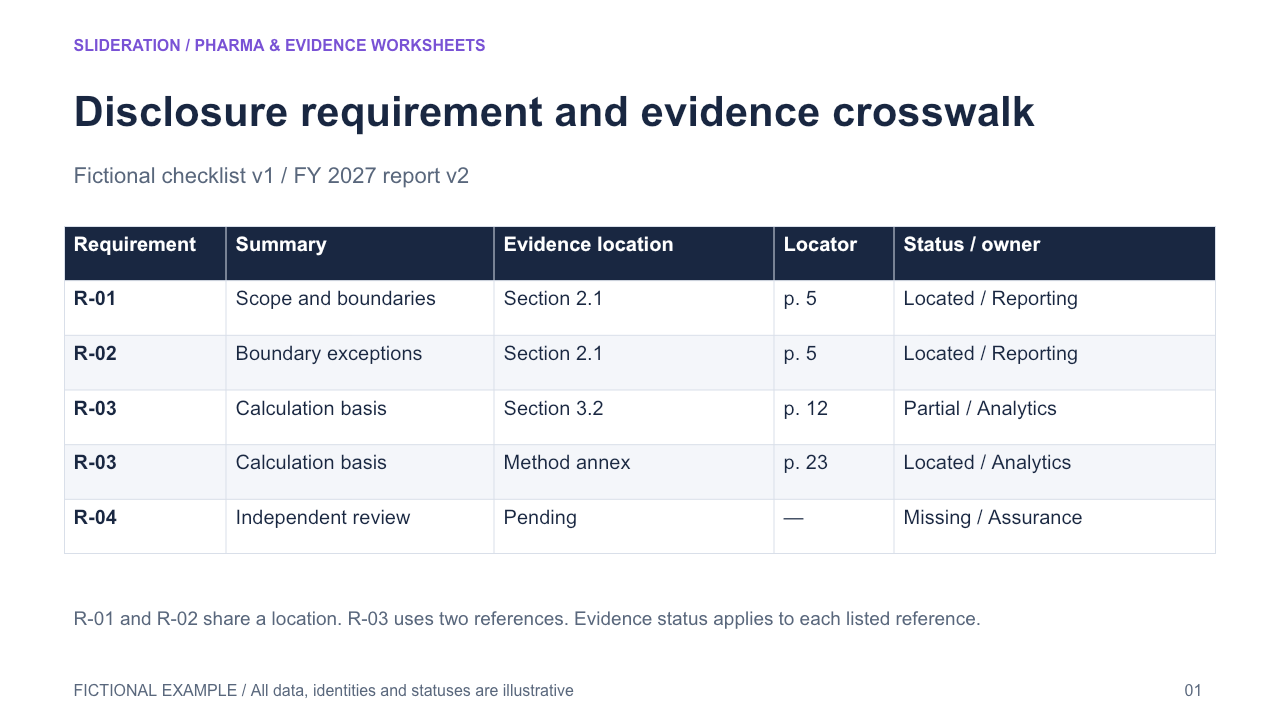
Disclosure requirement and evidence crosswalk
Trace each requirement identifier and scope to a report section, page and evidence status. Several requirements may share a location, while a single requirement may need multiple references.
Editable PPTX · 2 slides · 1 credit
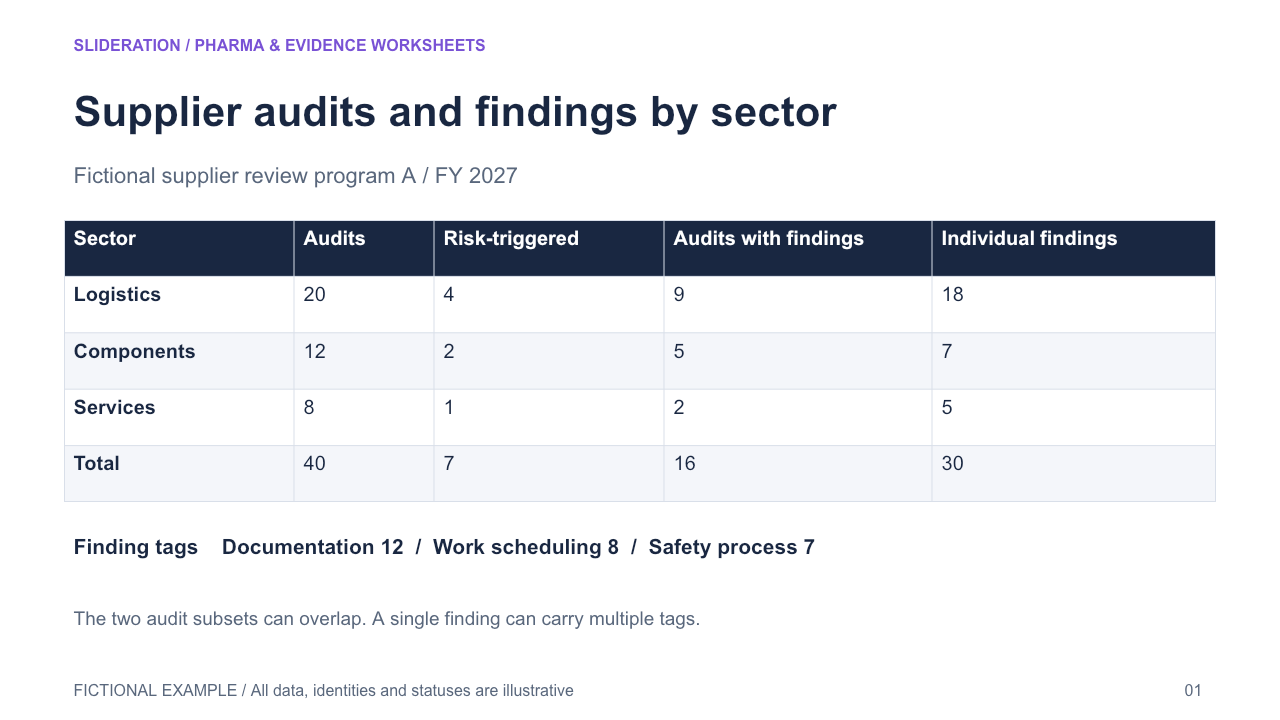
Supplier audits and findings by sector
Reconcile audit events and findings as separate populations by sector. Distinguish risk-triggered audits and audits with findings from individual findings and separately tagged issue types.
Editable PPTX · 2 slides · 1 credit
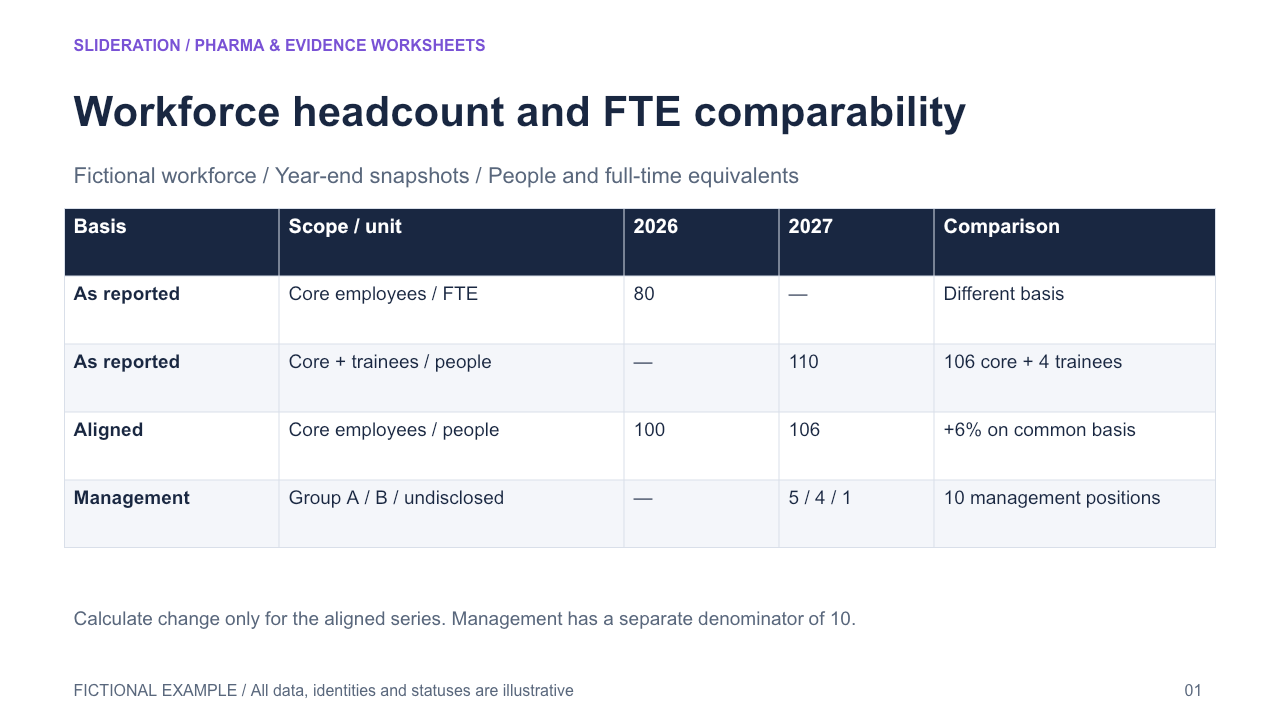
Workforce headcount and FTE comparability
Present reported workforce figures under changed units and population boundaries, with a separate aligned comparison only where both periods are available on the same basis. Reconcile composition panels within each stated denominator.
Editable PPTX · 2 slides · 1 credit
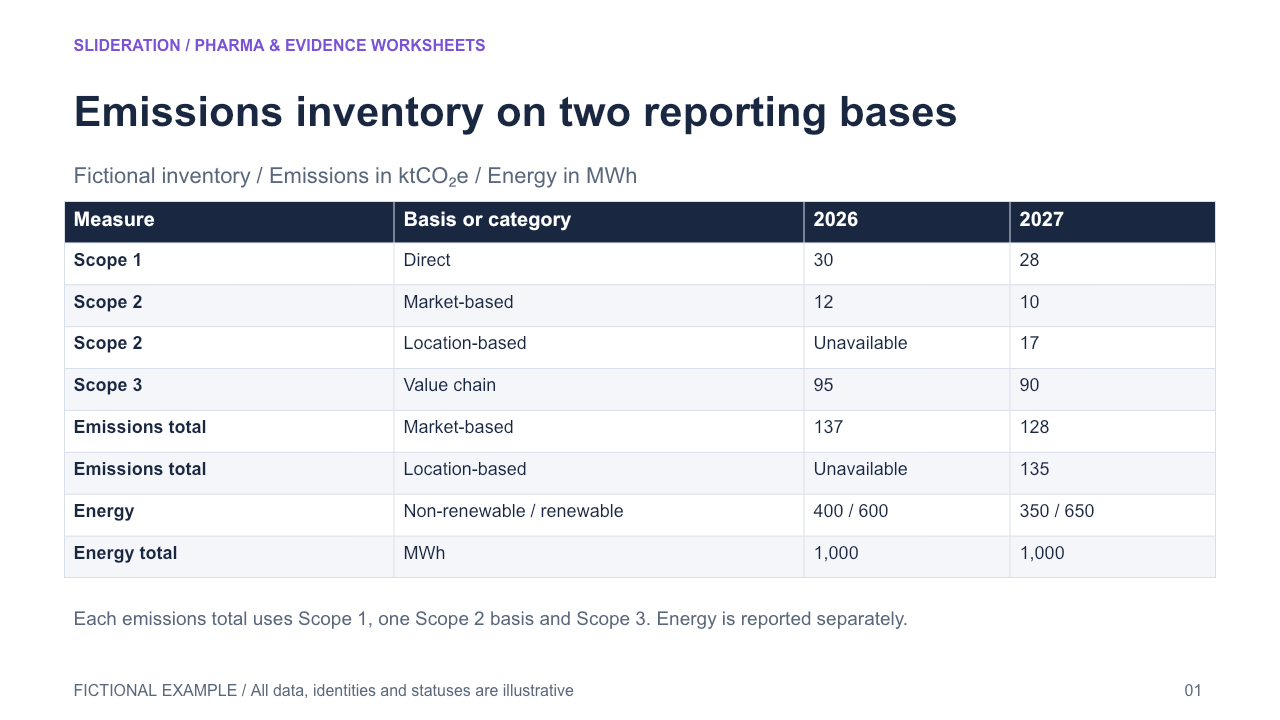
Emissions inventory on two reporting bases
Compare market-based and location-based Scope 2 alternatives by year, share the same Scope 1 and Scope 3 values, and show which annual totals can be calculated. Keep energy quantities in a separate context panel.
Editable PPTX · 2 slides · 1 credit
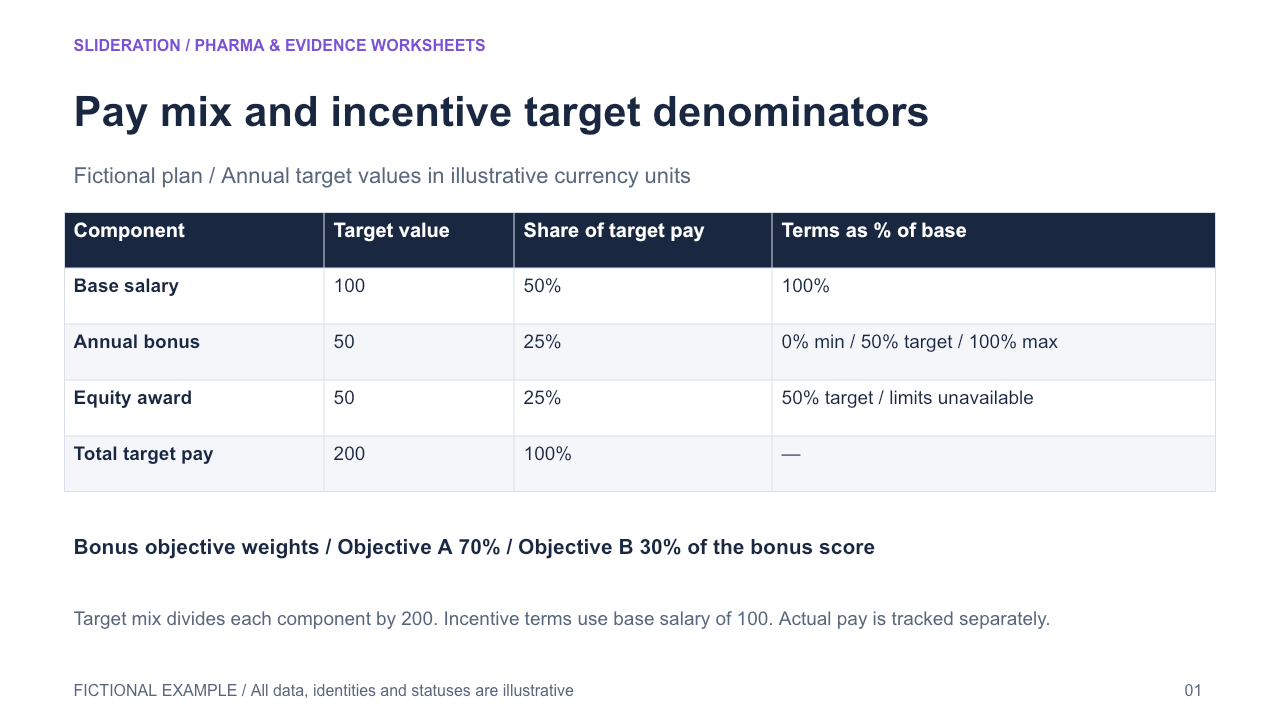
Pay mix and incentive target denominators
Reconcile component share of target total pay separately from component value as a percentage of fixed base pay. Show distinct component minimums, targets and maximums and separate objective weights.
Editable PPTX · 2 slides · 1 credit
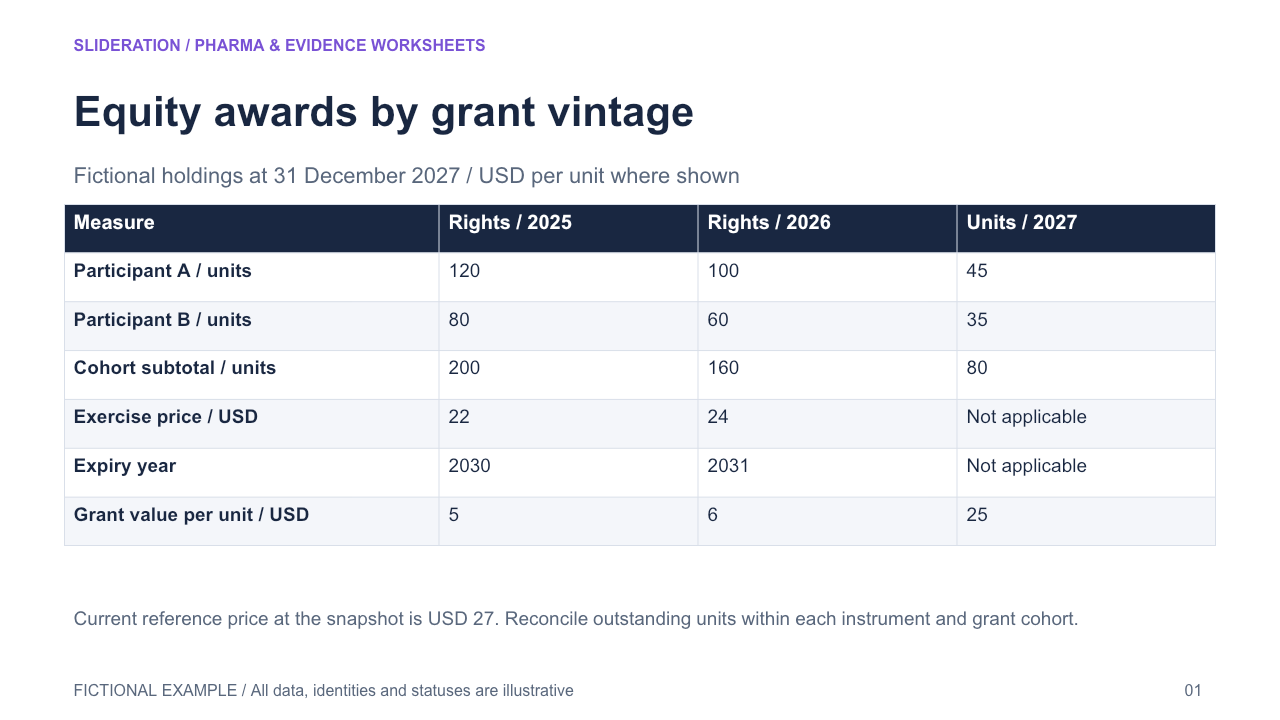
Equity awards by grant vintage
Tie outstanding units per participant to instrument and grant cohort at one observation cutoff, with matching per-unit grant terms and independent current reference price.
Editable PPTX · 2 slides · 1 credit
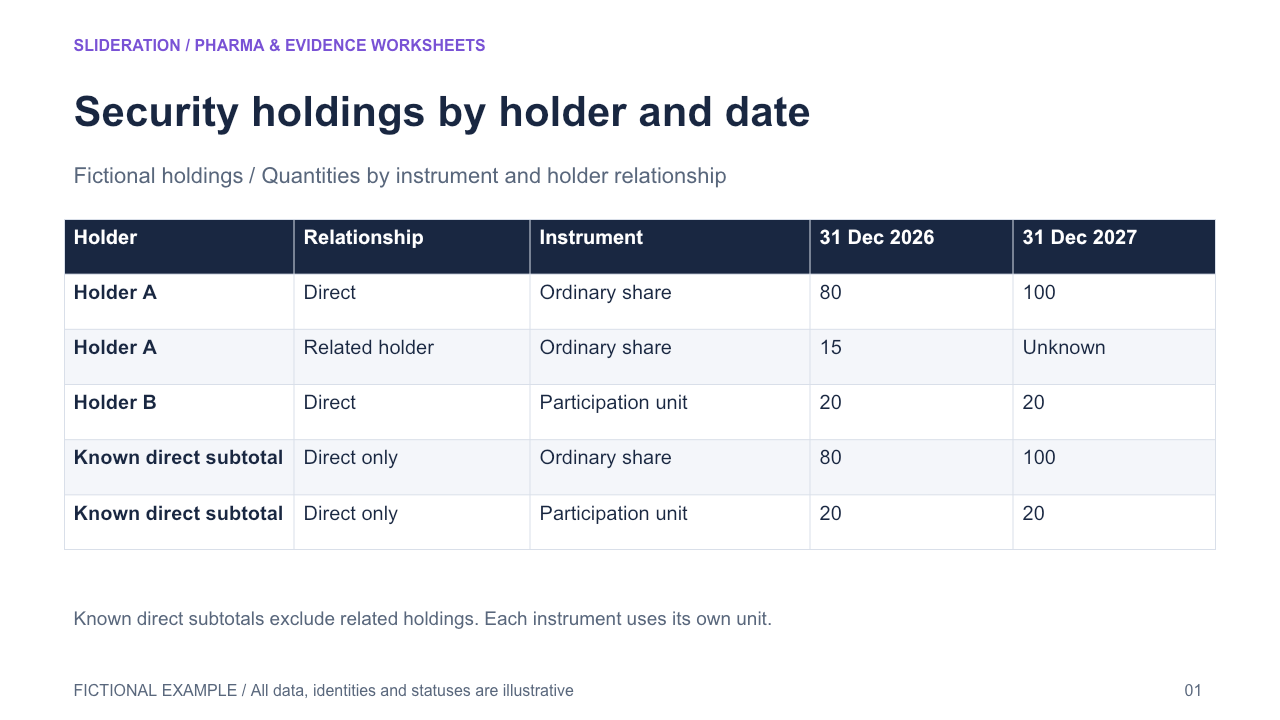
Security holdings by holder and date
Compare security holdings at two observation dates by instrument and holder relationship. Reconcile like units within each snapshot, and keep unknown or undisclosed holdings explicit.
Editable PPTX · 2 slides · 1 credit
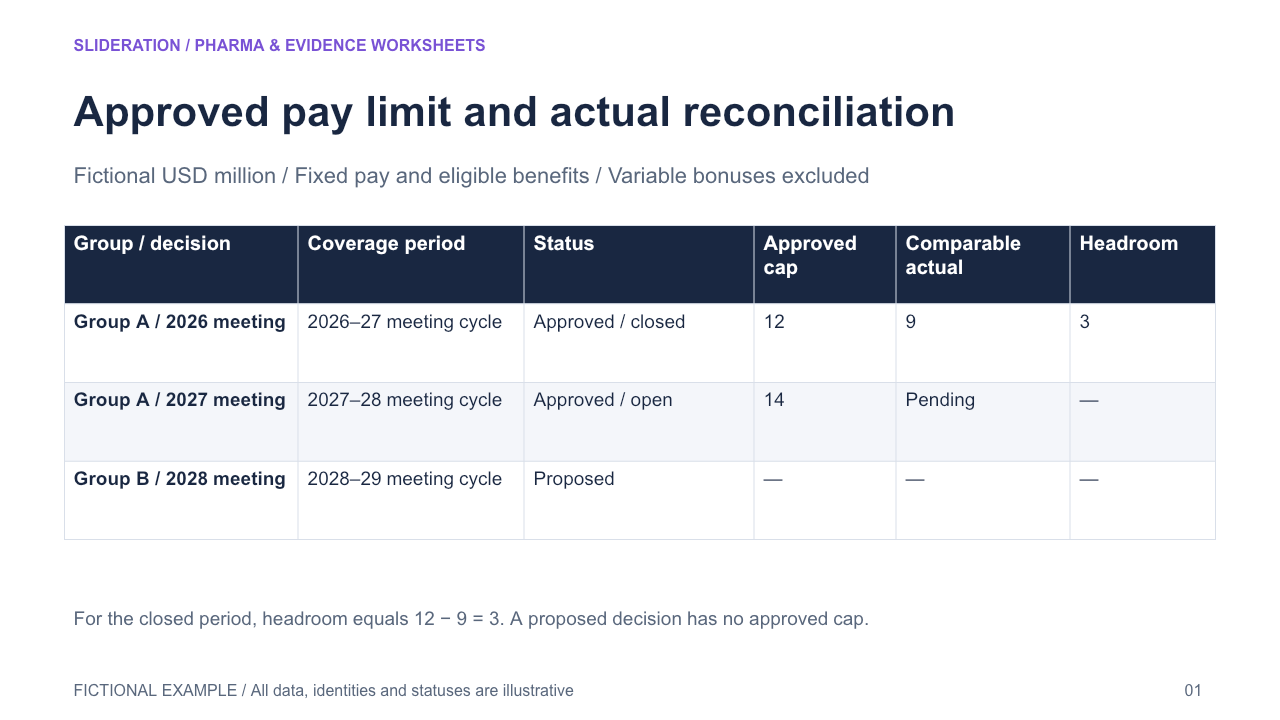
Approved pay limit and actual reconciliation
Match each approval decision to its covered period and included components, compare actual amounts on that same basis, and leave headroom blank for proposals or periods still open.
Editable PPTX · 2 slides · 1 credit
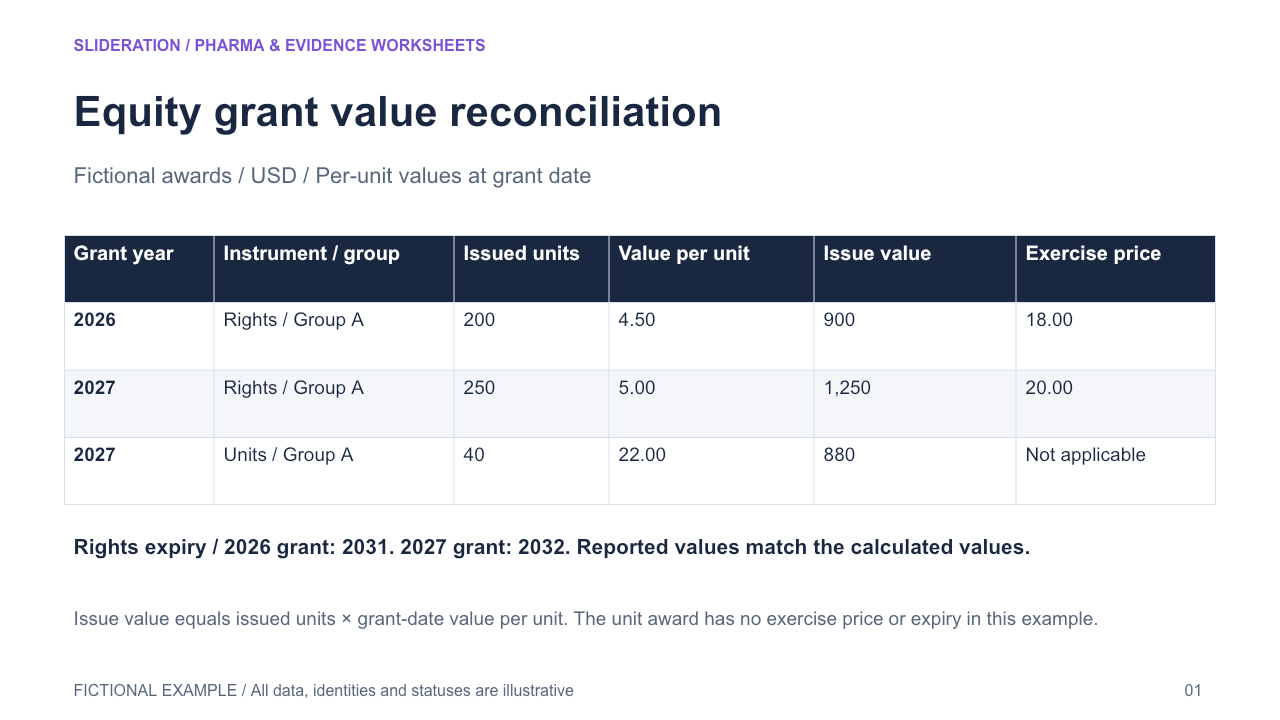
Equity grant value reconciliation
Compare issued award quantities by grant period and instrument, connecting each to grant-date unit value and issue value. Keep exercise price, expiry and disclosed rounding adjustments separate.
Editable PPTX · 2 slides · 1 credit
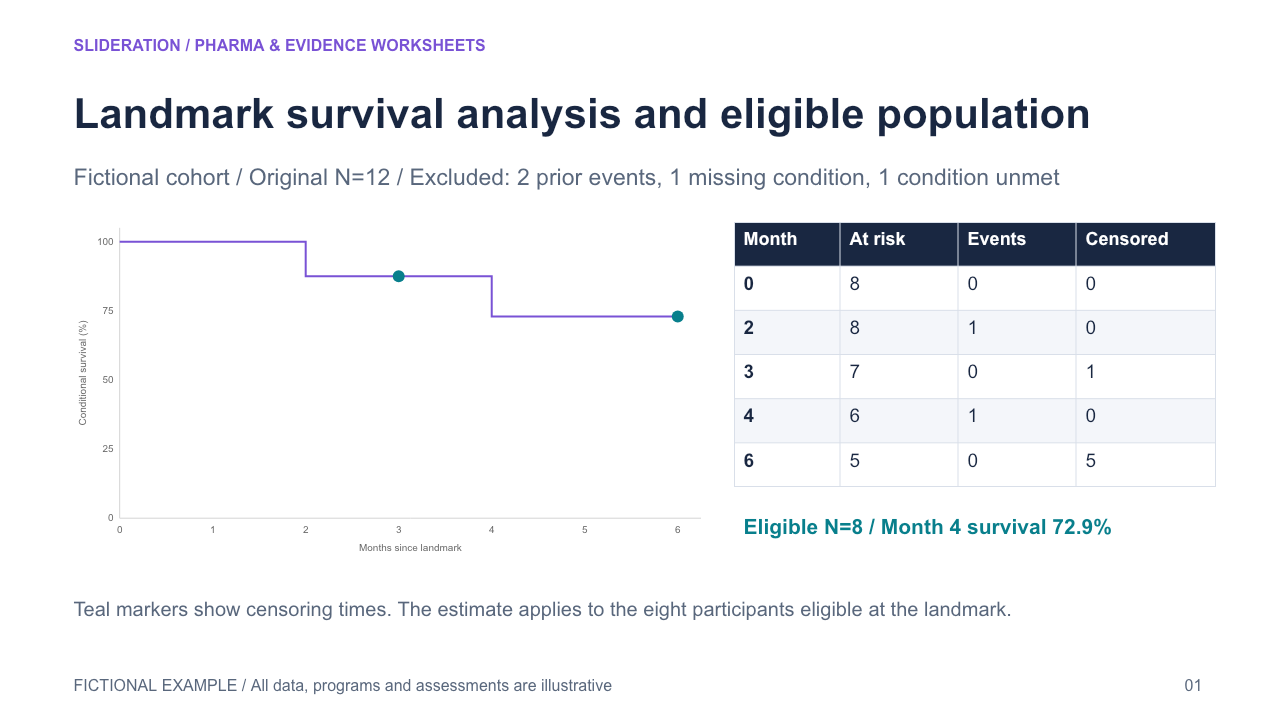
Landmark survival analysis and eligible population
Reconcile the initial cohort with landmark eligibility and condition, then restart the event-time axis at the landmark for the eligible subset. Keep original and conditional populations visible.
Editable PPTX · 2 slides · 1 credit
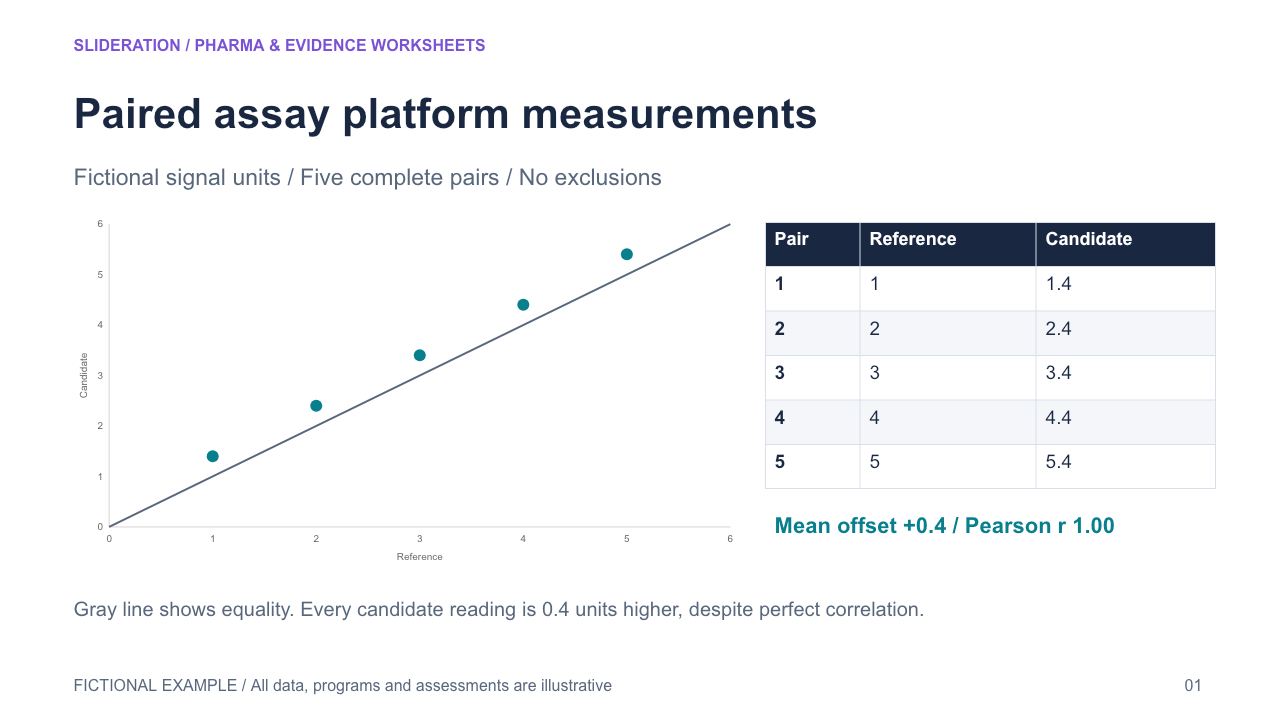
Paired assay platform measurements
Place matched measurements from a reference and candidate platform on the same declared scale, with pair counts, transform, identity guide and per-assay scope. Keep association distinct from agreement.
Editable PPTX · 2 slides · 1 credit
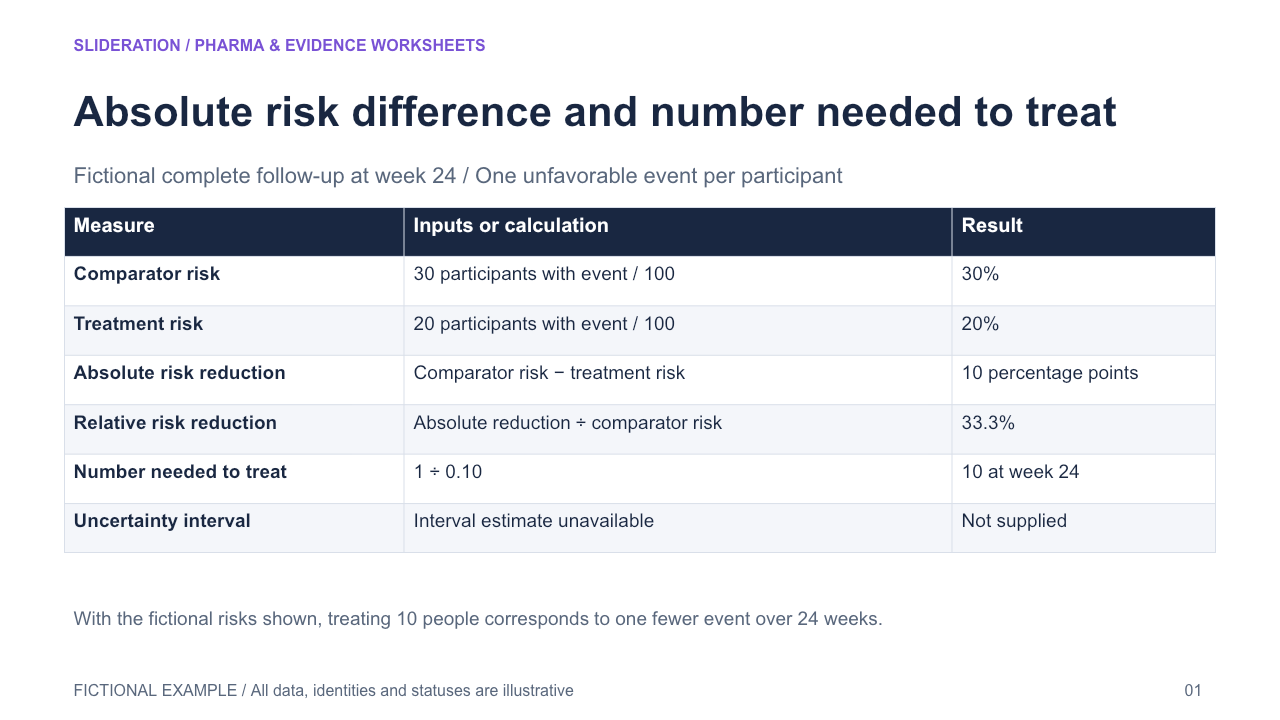
Absolute risk difference and number needed to treat
Tie absolute and relative effect summaries to two fixed-horizon arm risks and show the reciprocal of the absolute risk reduction. Display the endpoint, comparator and uncertainty alongside the calculated values.
Editable PPTX · 2 slides · 1 credit
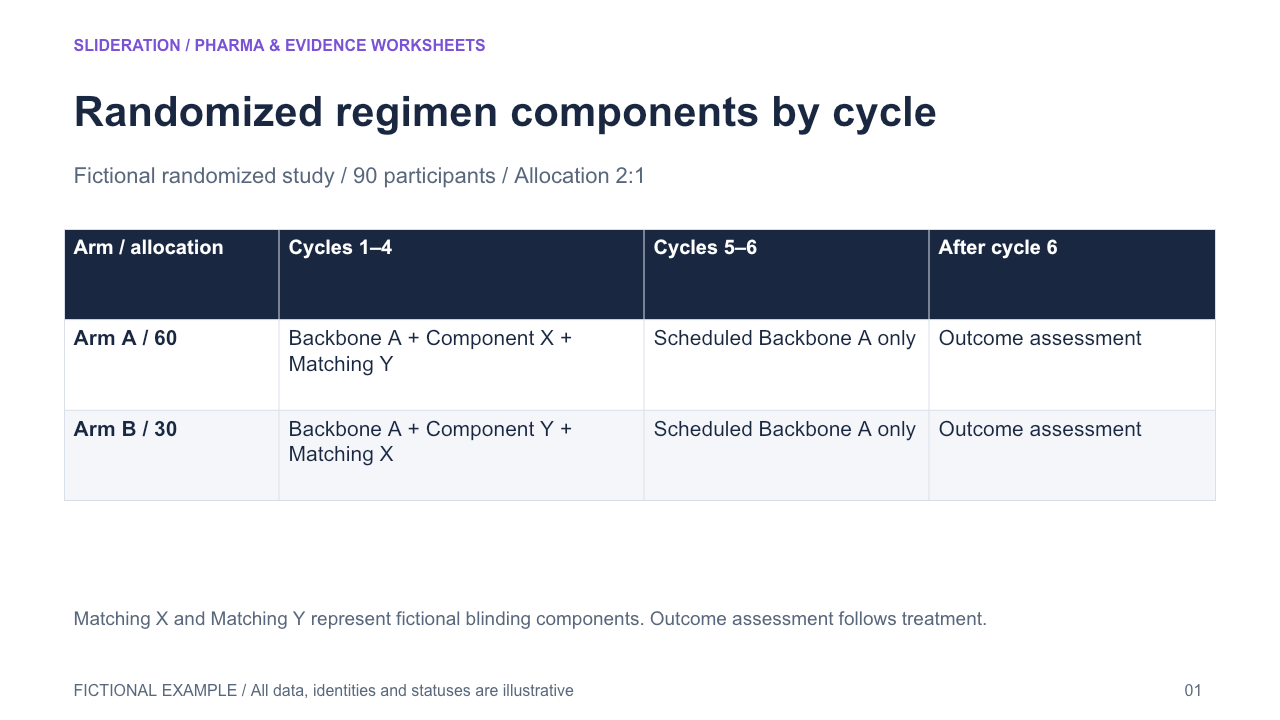
Randomized regimen components by cycle
Map randomized arms to the active, matching and shared components in each treatment-cycle window, then show whether the arms converge on a shared component or have different scheduled endings.
Editable PPTX · 2 slides · 1 credit
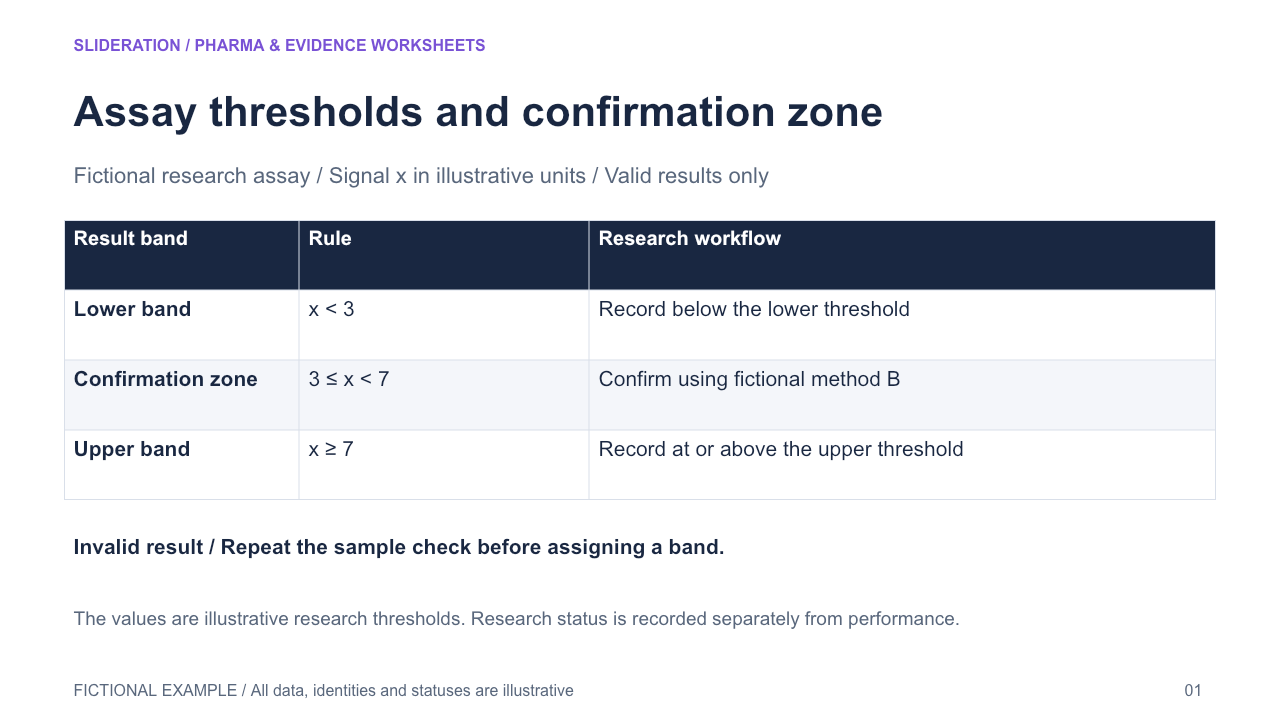
Assay thresholds and confirmation zone
Map one continuous result scale to three mutually exclusive interpretation zones, including an intermediate confirmation band and explicit boundary rules.
Editable PPTX · 2 slides · 1 credit
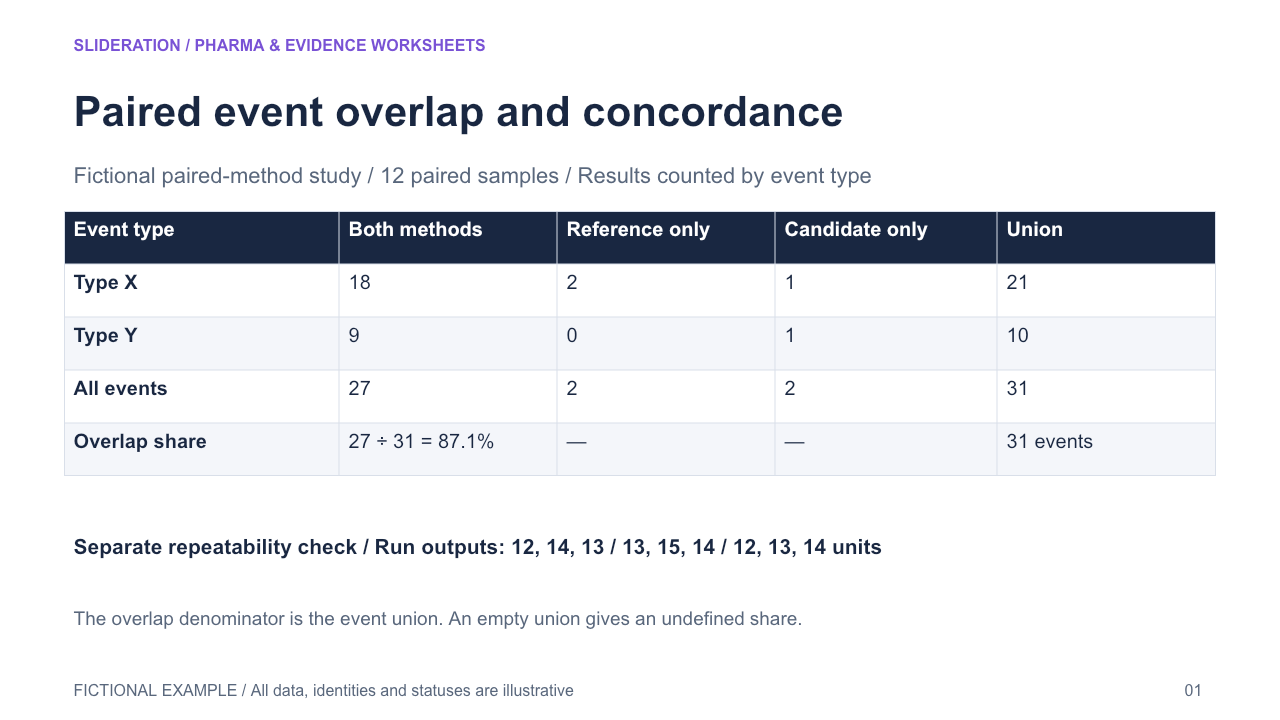
Paired event overlap and concordance
Reconcile shared and method-exclusive detections across event classes under one matching rule, then summarize overlap against the union. Display run repeatability as a distinct panel when relevant.
Editable PPTX · 2 slides · 1 credit
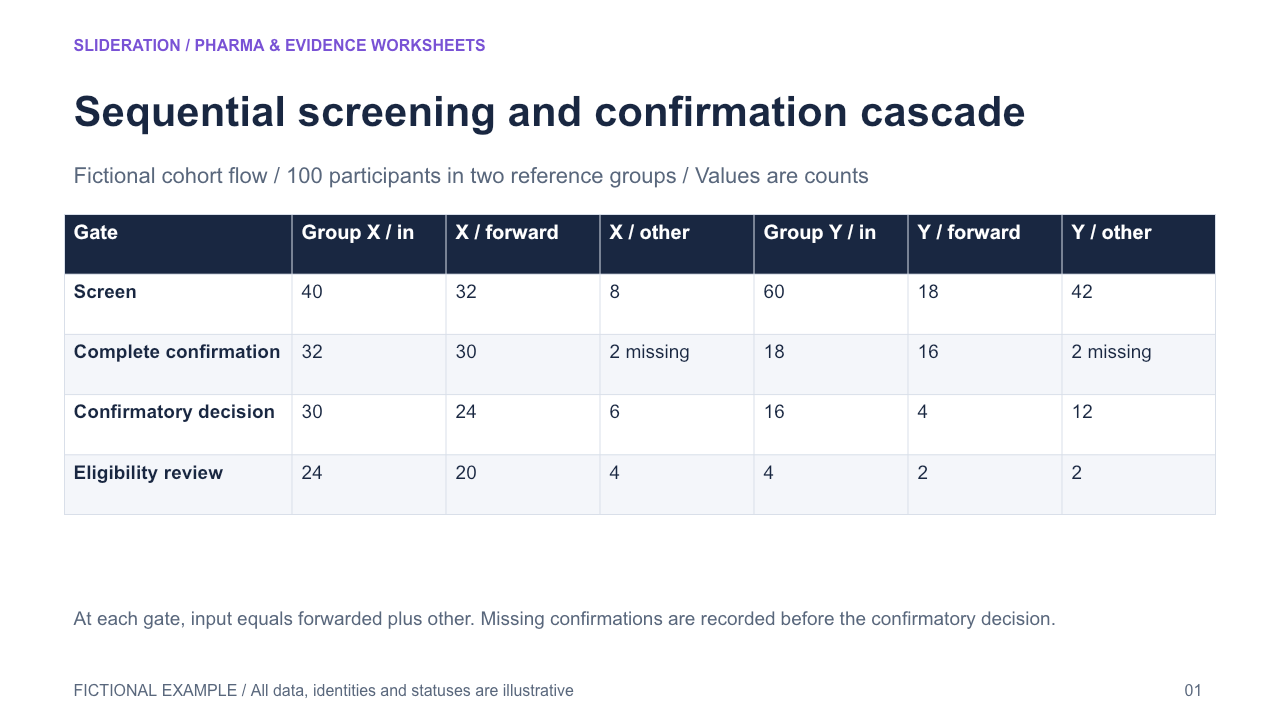
Sequential screening and confirmation cascade
Carry two reference-status cohorts through screening and confirmation, preserving the conditional denominator and non-forwarded groups at each gate before independent eligibility review.
Editable PPTX · 2 slides · 1 credit
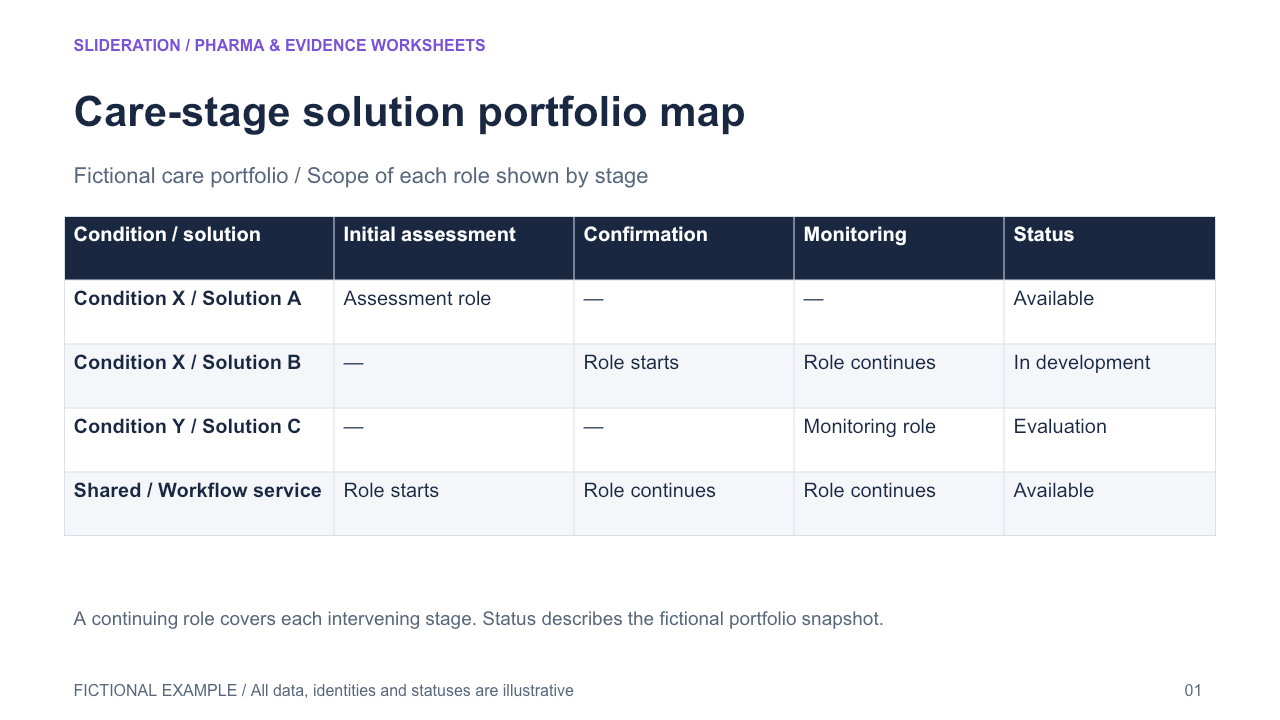
Care-stage solution portfolio map
Map solution items across condition rows and care-stage columns, distinguishing development status and cross-stage capabilities. An item may span adjacent stages while retaining one identity.
Editable PPTX · 2 slides · 1 credit
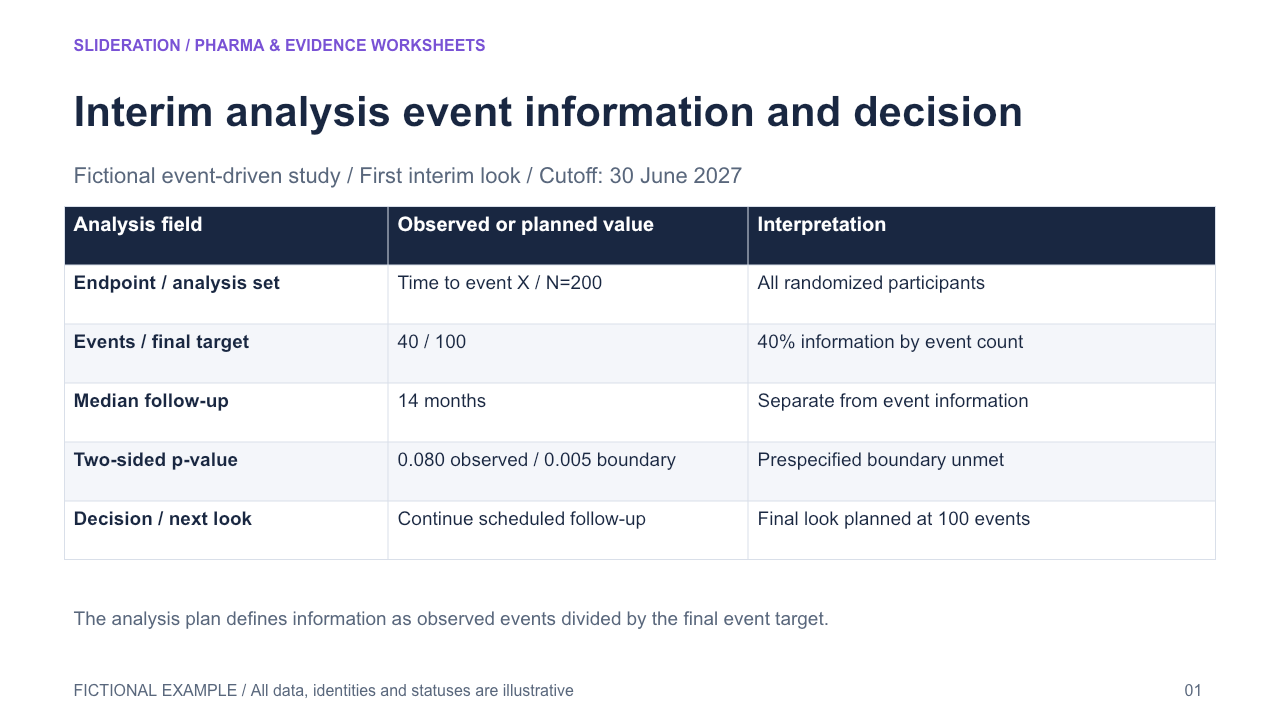
Interim analysis event information and decision
Show a single interim look with observed events versus planned final events, the actual testing boundary and decision, separately from median follow-up and the count at risk.
Editable PPTX · 2 slides · 1 credit
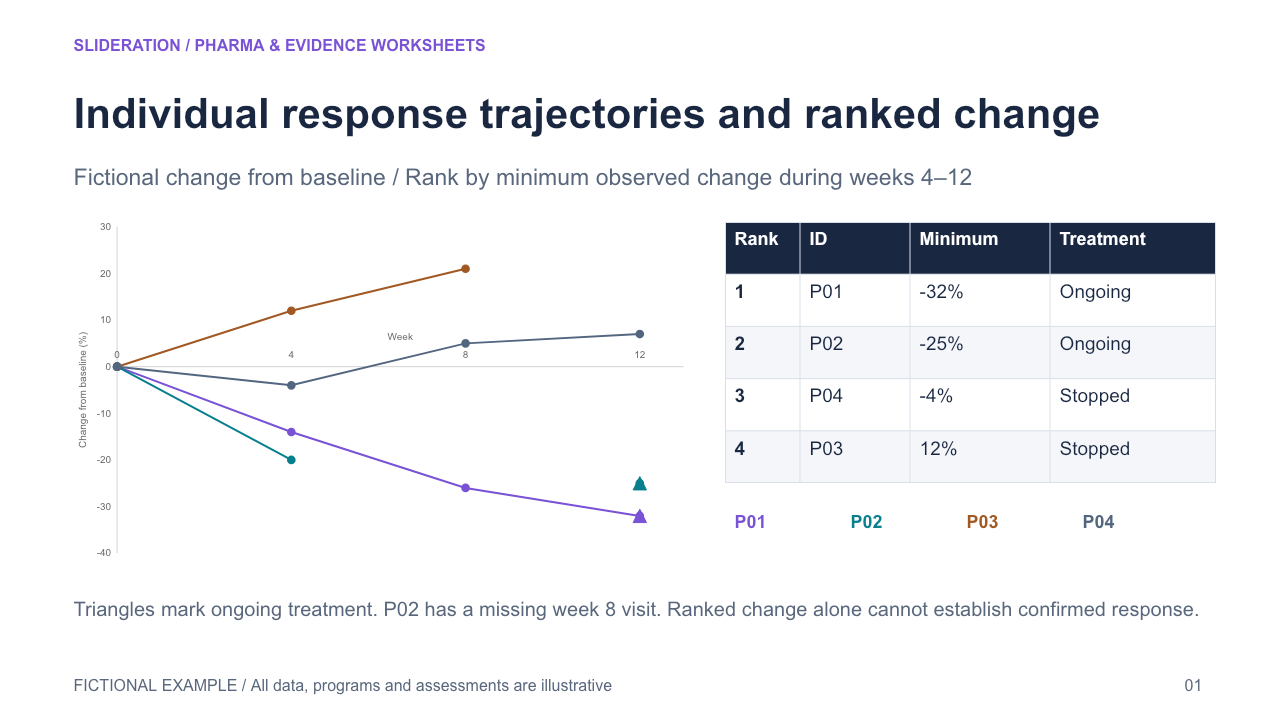
Individual response trajectories and ranked change
Link a ranked per-person change summary and longitudinal observations by the same participant identifiers. Retain timing and treatment status separately from response classification.
Editable PPTX · 2 slides · 1 credit
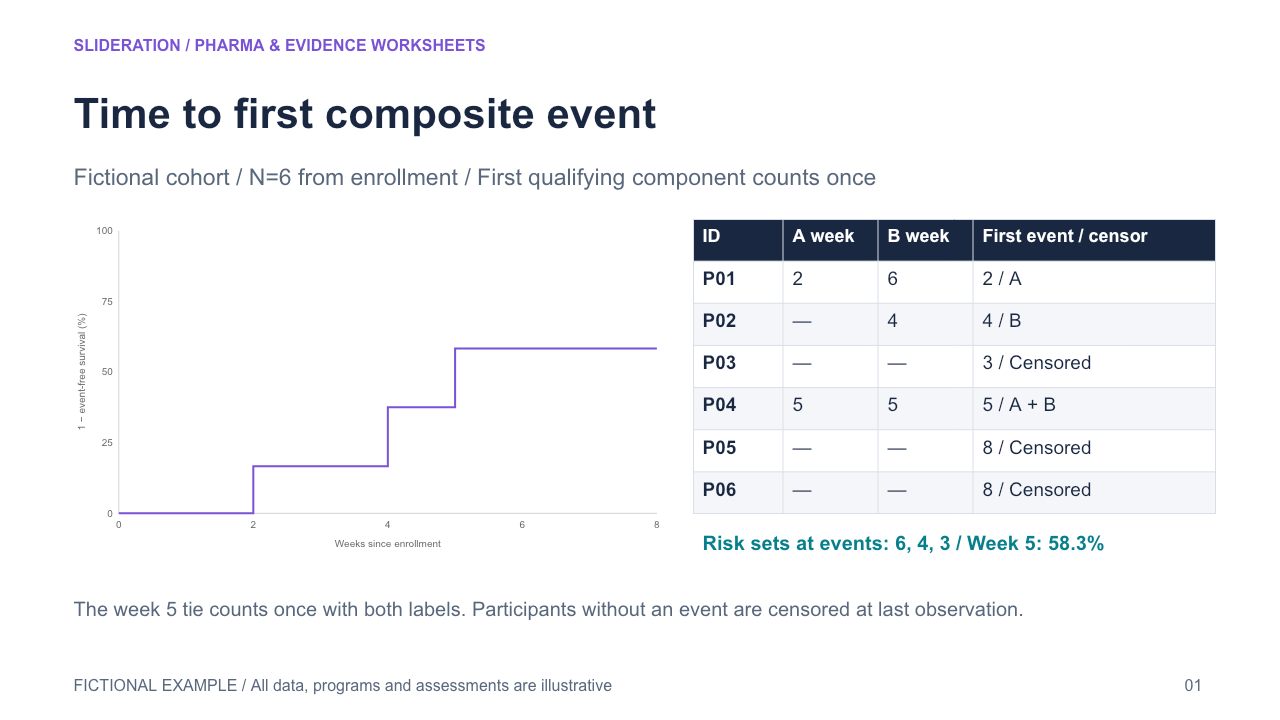
Time to first composite event
Identify the first qualifying event across multiple components for each participant, retain its type, and derive the event curve and risk set from those first-event and censoring times.
Editable PPTX · 2 slides · 1 credit
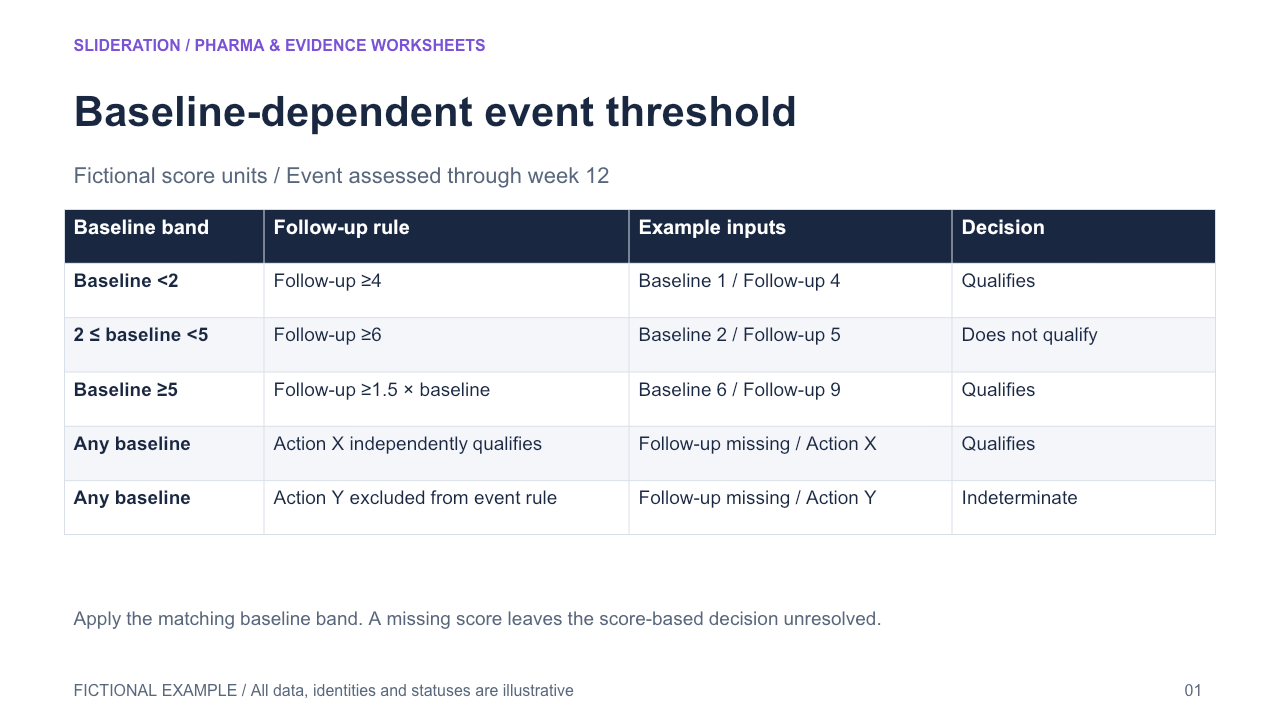
Baseline-dependent event threshold
Select a baseline band, apply its specific absolute or relative follow-up threshold, then evaluate any independently defined qualifying pathways and exceptions.
Editable PPTX · 2 slides · 1 credit
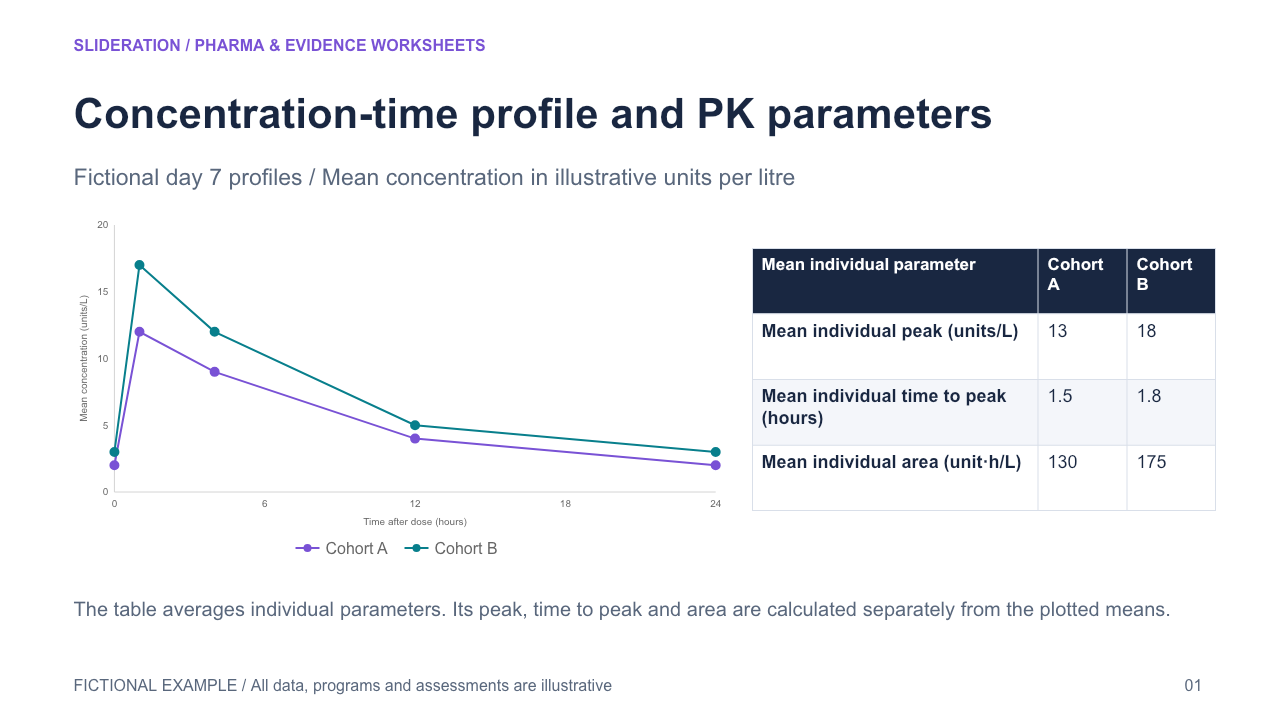
Concentration-time profile and PK parameters
Align a cohort concentration-time profile with separately summarized participant-level exposure parameters. Declare summary method, clock origin, sampling population and each parameter unit.
Editable PPTX · 2 slides · 1 credit
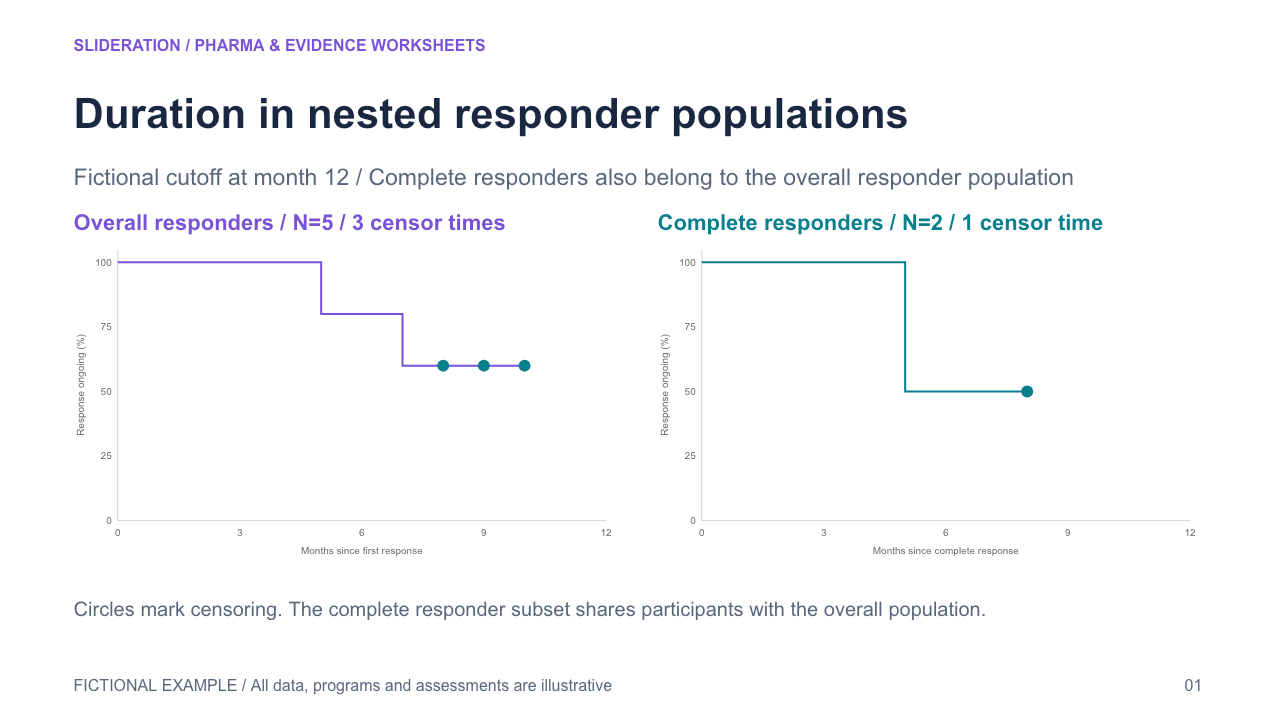
Duration in nested responder populations
Compare duration summaries for an overall responder set and a nested complete-response subset with distinct onset clocks, censoring rules and risk counts.
Editable PPTX · 2 slides · 1 credit
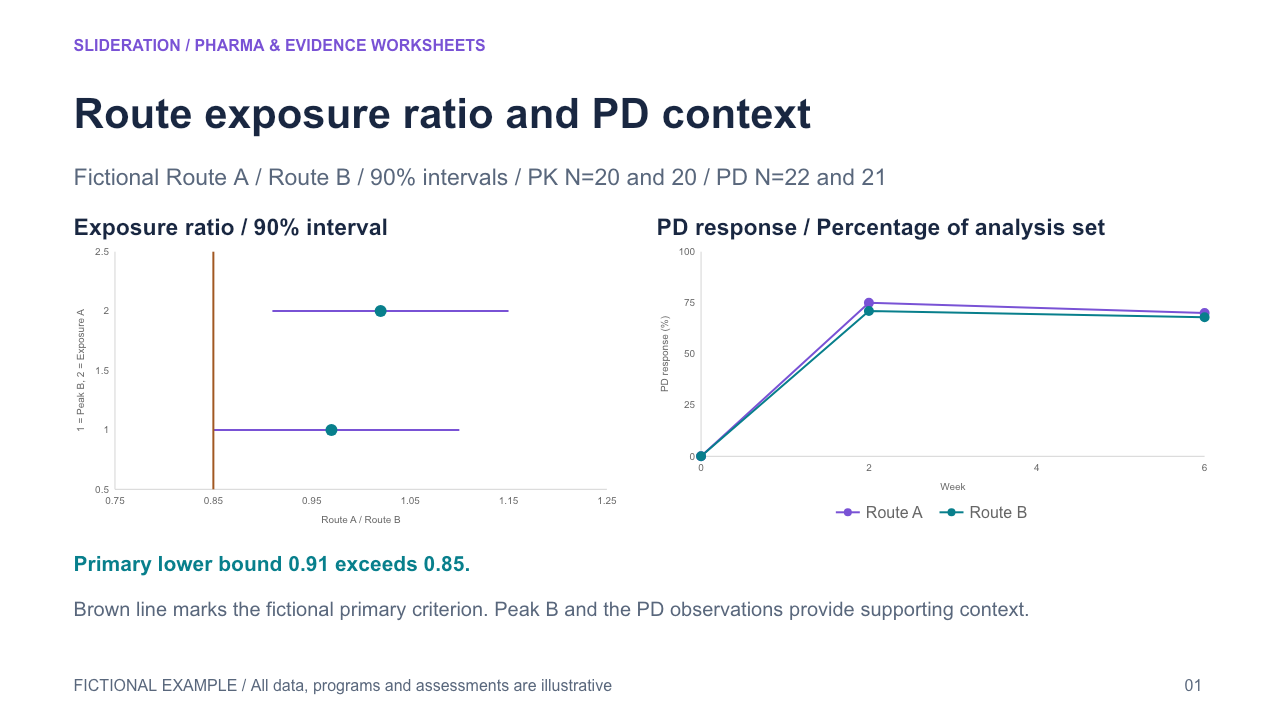
Route exposure ratio and PD context
Compare route-specific exposure metrics and a supplied test/reference ratio interval against its declared criterion, while displaying pharmacodynamic observations with a separate population and interpretation.
Editable PPTX · 2 slides · 1 credit