Site capability footprint PowerPoint Template
Editable site capability footprint worksheet with a fictional worked example and a fill-in slide. Preview both pages; download the 2-slide PPTX for 1 credit.
View in library · PPTX · 1 credit
Sign in to download. One credit unlocks the complete 2-slide file; repeat downloads are free.
When to use this template
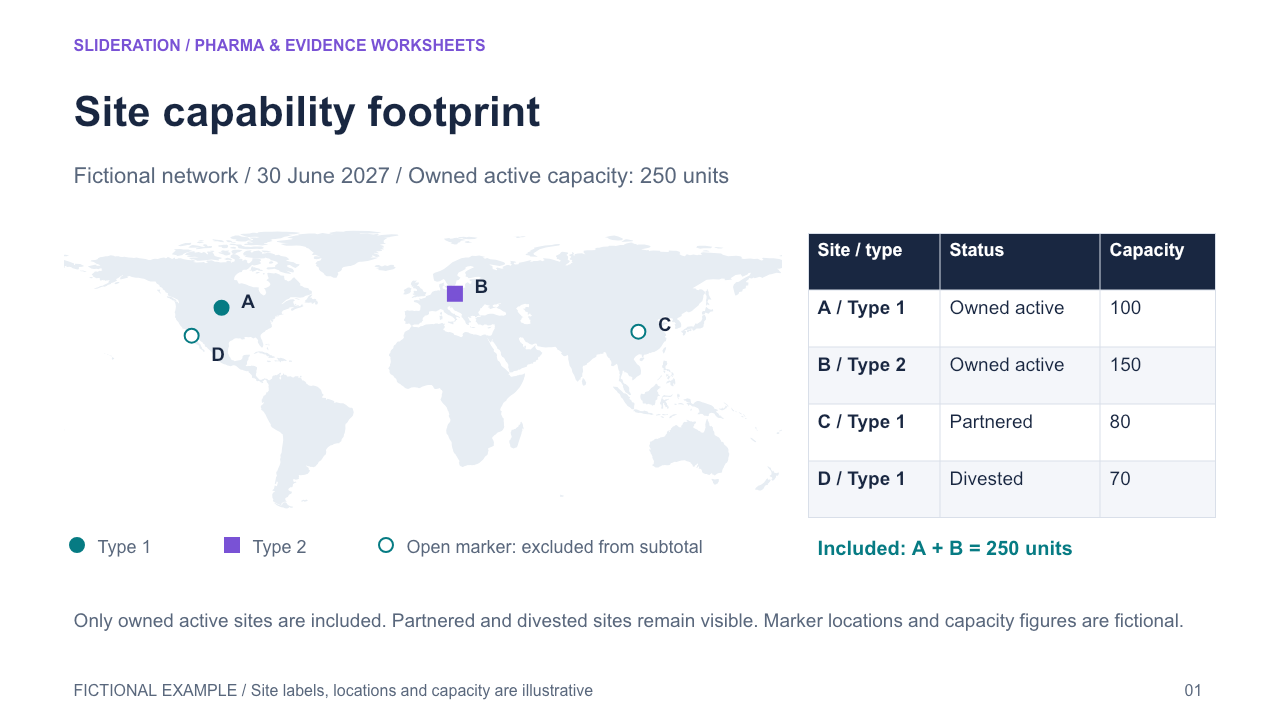
Geographically located sites retain capability category, operational status and inclusion in a declared capacity subtotal. A divested/partnered site is marked separately from owned active capacity.
What you can edit
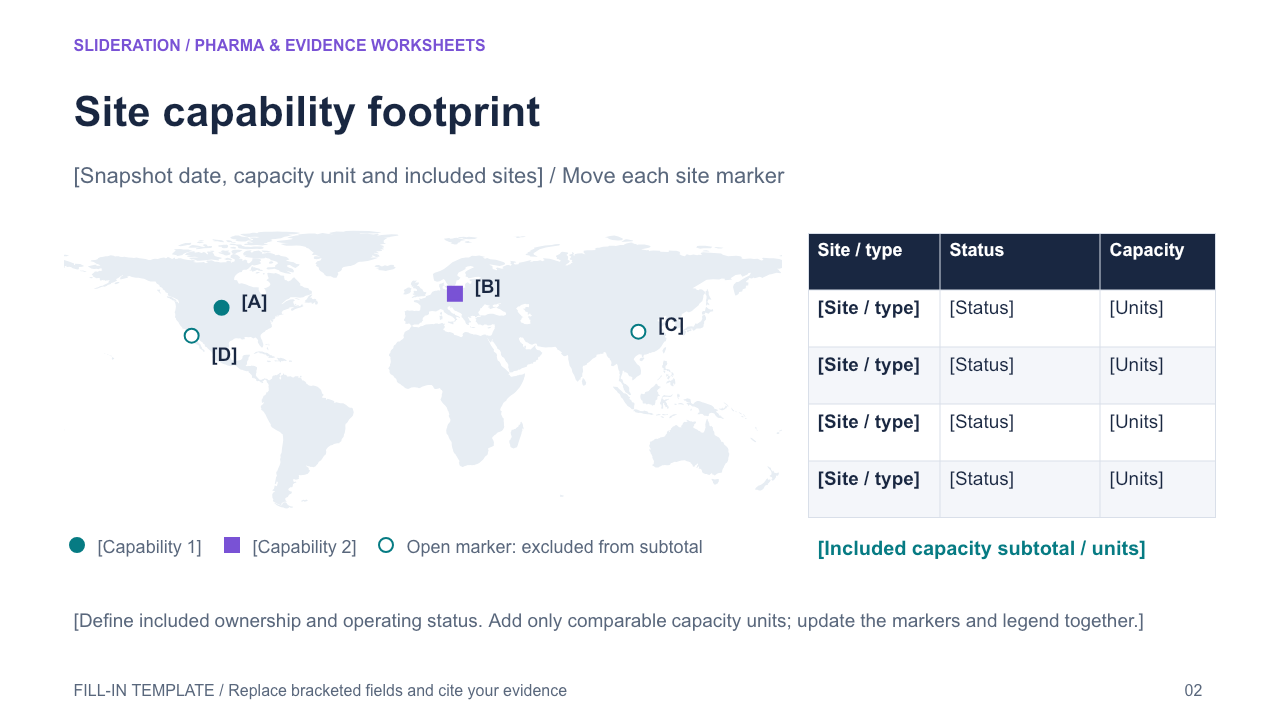
Edit the text, table cells and any native chart data in PowerPoint. The second slide keeps the structure and provides replacement fields. Chart templates use zero seed values on the fill-in slide; replace these together with the associated definitions and tables.
Use the evidence correctly
Use fictional sites; do not copy source cities, site capacities, company logo or map artwork. A licensed/public-domain base map must have a provenance receipt and be converted to editable native paths before finalization; labels/markers/legend native editable. Map is context, not geographic precision or supply-flow links. Capacity includes only the declared active owned sites.
- Define your population, reporting period, measures and evidence sources.
- Duplicate the fill-in slide and replace every bracketed field and chart value.
- Check units, denominators, labels and conclusions against your source before presenting.
View in library · PPTX · 1 credit
Sign in to download. One credit unlocks the complete 2-slide file; repeat downloads are free.
All example content is fictional. Original Slideration template; no company endorsement. Use in your own presentations and client work under our slide licence. Redistribution or resale of template files is not permitted.