Emissions inventory on two reporting bases PowerPoint Template
Editable emissions inventory on two reporting bases worksheet with a fictional worked example and a fill-in slide. Preview both pages; download the 2-slide PPTX for 1 credit.
View in library · PPTX · 1 credit
Sign in to download. One credit unlocks the complete 2-slide file; repeat downloads are free.
When to use this template
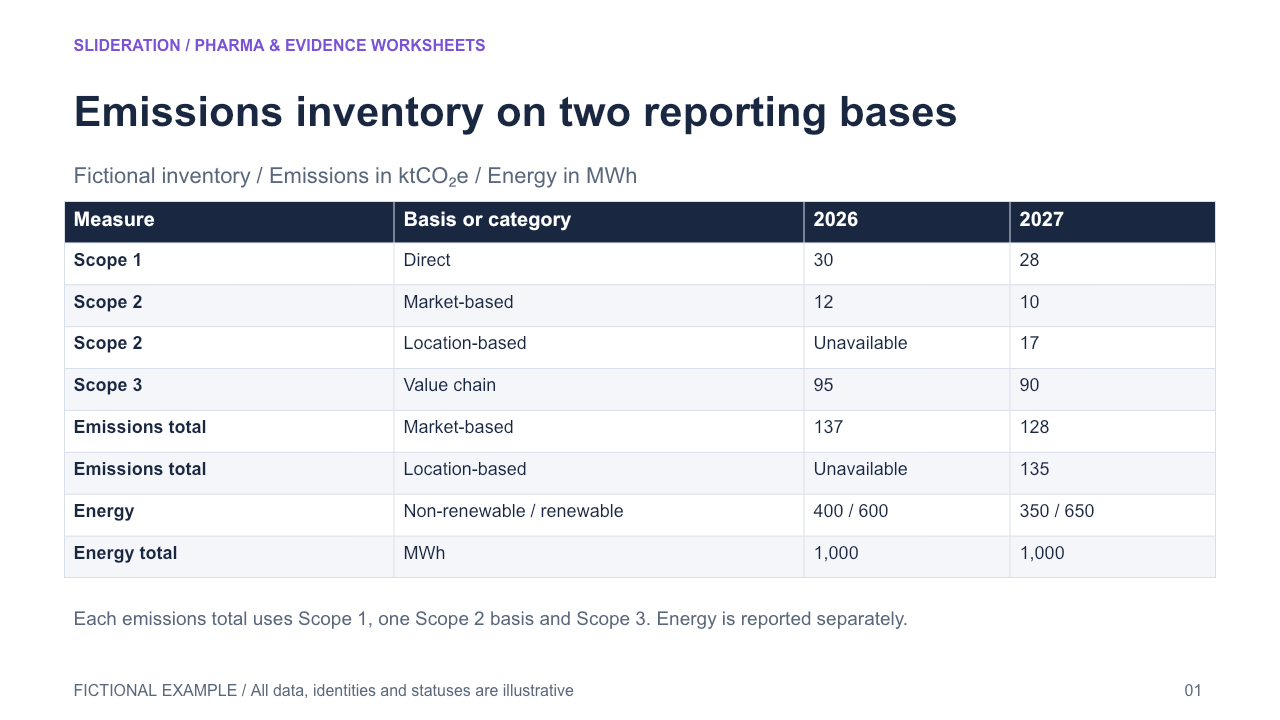
Compare market-based and location-based Scope 2 alternatives by year, share the same Scope 1 and Scope 3 values, and show which annual totals can be calculated. Keep energy quantities in a separate context panel.
What you can edit
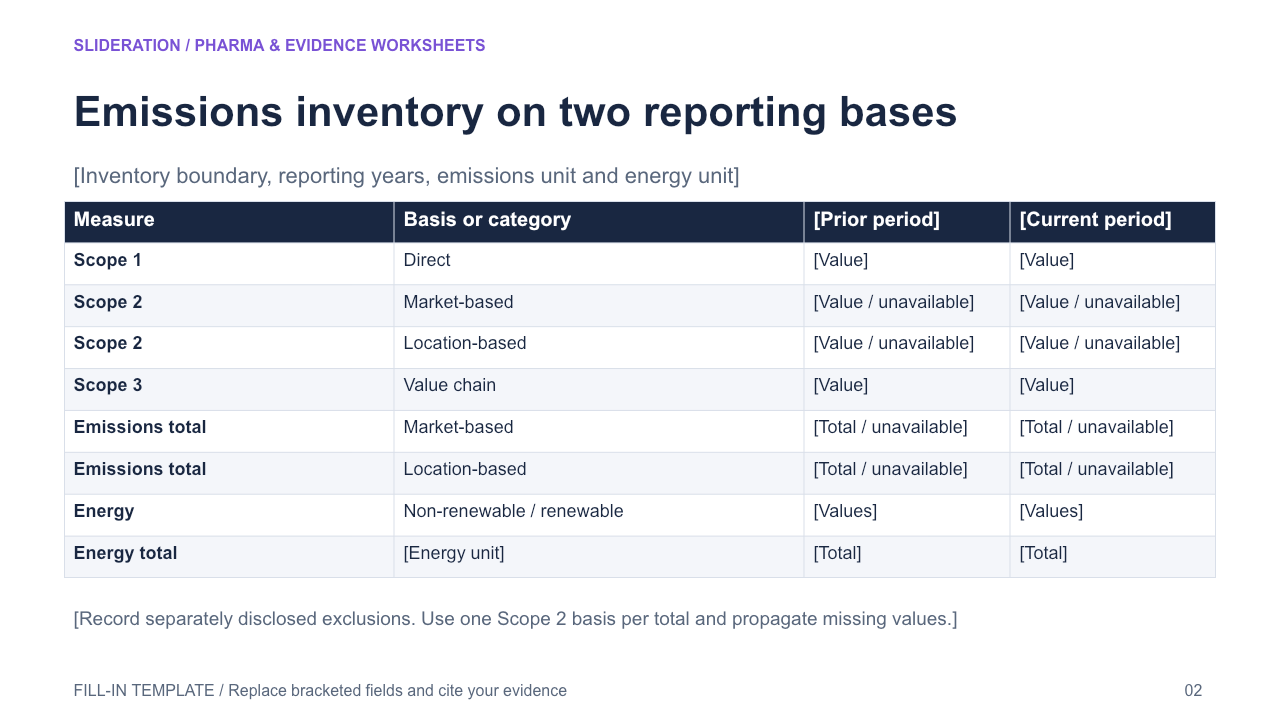
Edit the text, table cells and any native chart data in PowerPoint. The second slide keeps the structure and provides replacement fields. Chart templates use zero seed values on the fill-in slide; replace these together with the associated definitions and tables.
Use the evidence correctly
Use one Scope 2 value in each total. An unavailable prior value makes its corresponding total unavailable. Keep separately disclosed emissions and categories outside the subtotal unless the source defines their inclusion. Do not convert energy into emissions without stated factors. All example values are fictional.
- Define your population, reporting period, measures and evidence sources.
- Duplicate the fill-in slide and replace every bracketed field and chart value.
- Check units, denominators, labels and conclusions against your source before presenting.
View in library · PPTX · 1 credit
Sign in to download. One credit unlocks the complete 2-slide file; repeat downloads are free.
All example content is fictional. Original Slideration template; no company endorsement. Use in your own presentations and client work under our slide licence. Redistribution or resale of template files is not permitted.