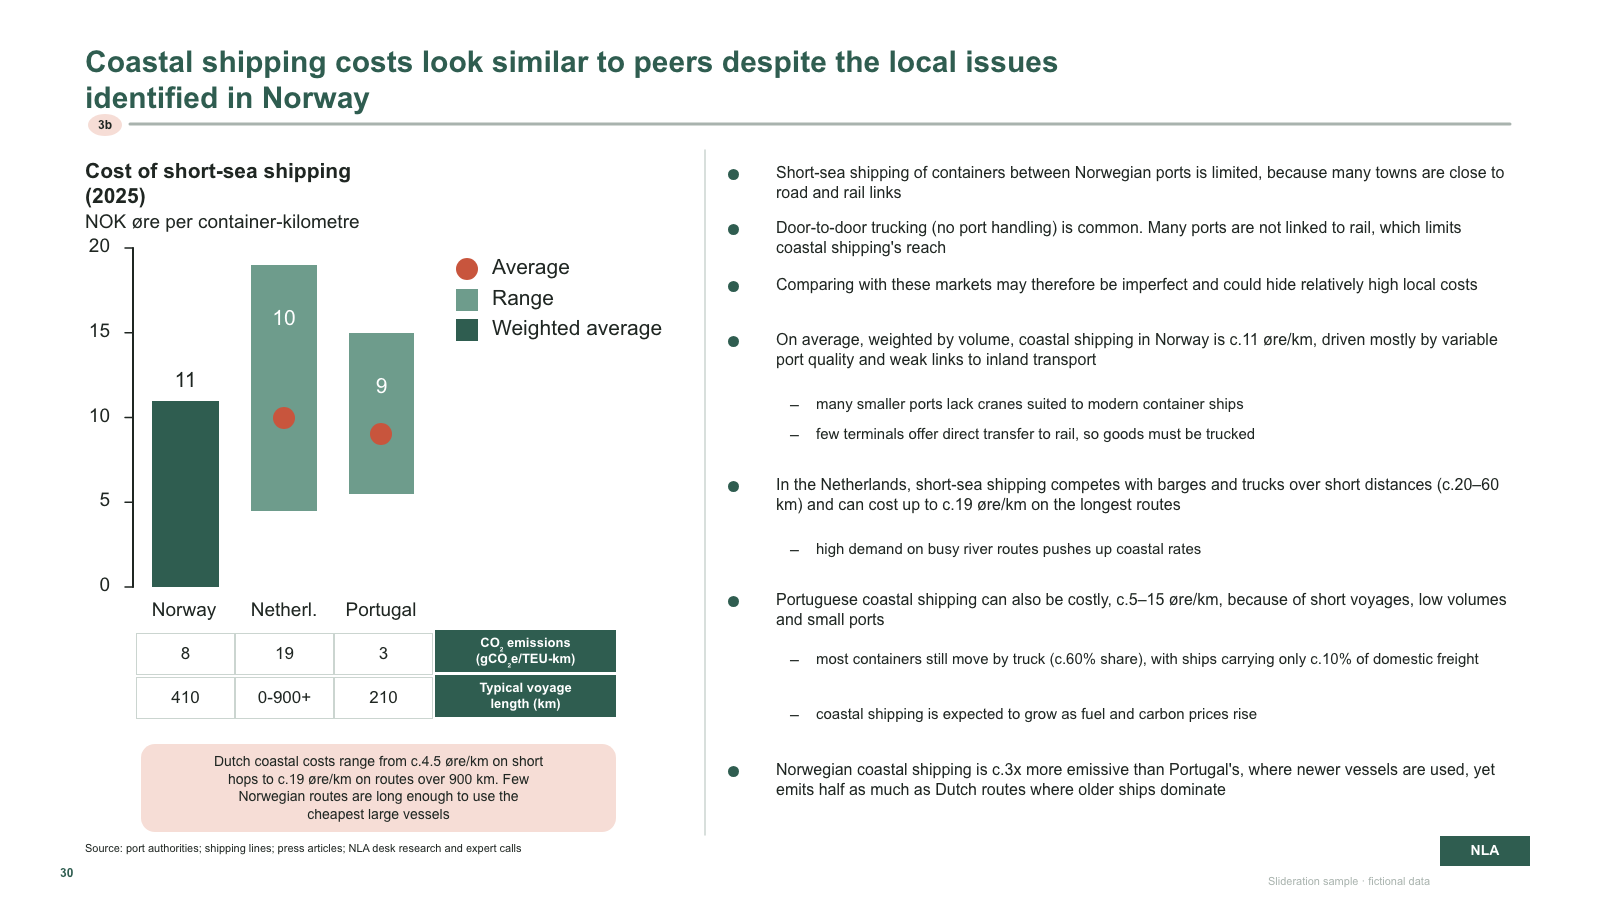
Benchmark bar + range chart
Benchmark bar + range chart with legend, data table and callout, next to a long bullet commentary
1 slides · 1 credit
Check inputs & editing effort →What do the observations support?
Bring: Defined measures, populations or categories, units, sources, cutoff and uncertainty where available.
Fit check: A visual association is not proof of causation. Use a recommendation page only after evaluating the evidence.
109 editable templates. Open a template to check its structure and editing requirements.
Benchmark bar + range chart with legend, data table and callout, next to a long bullet commentary
1 slides · 1 credit
Check inputs & editing effort →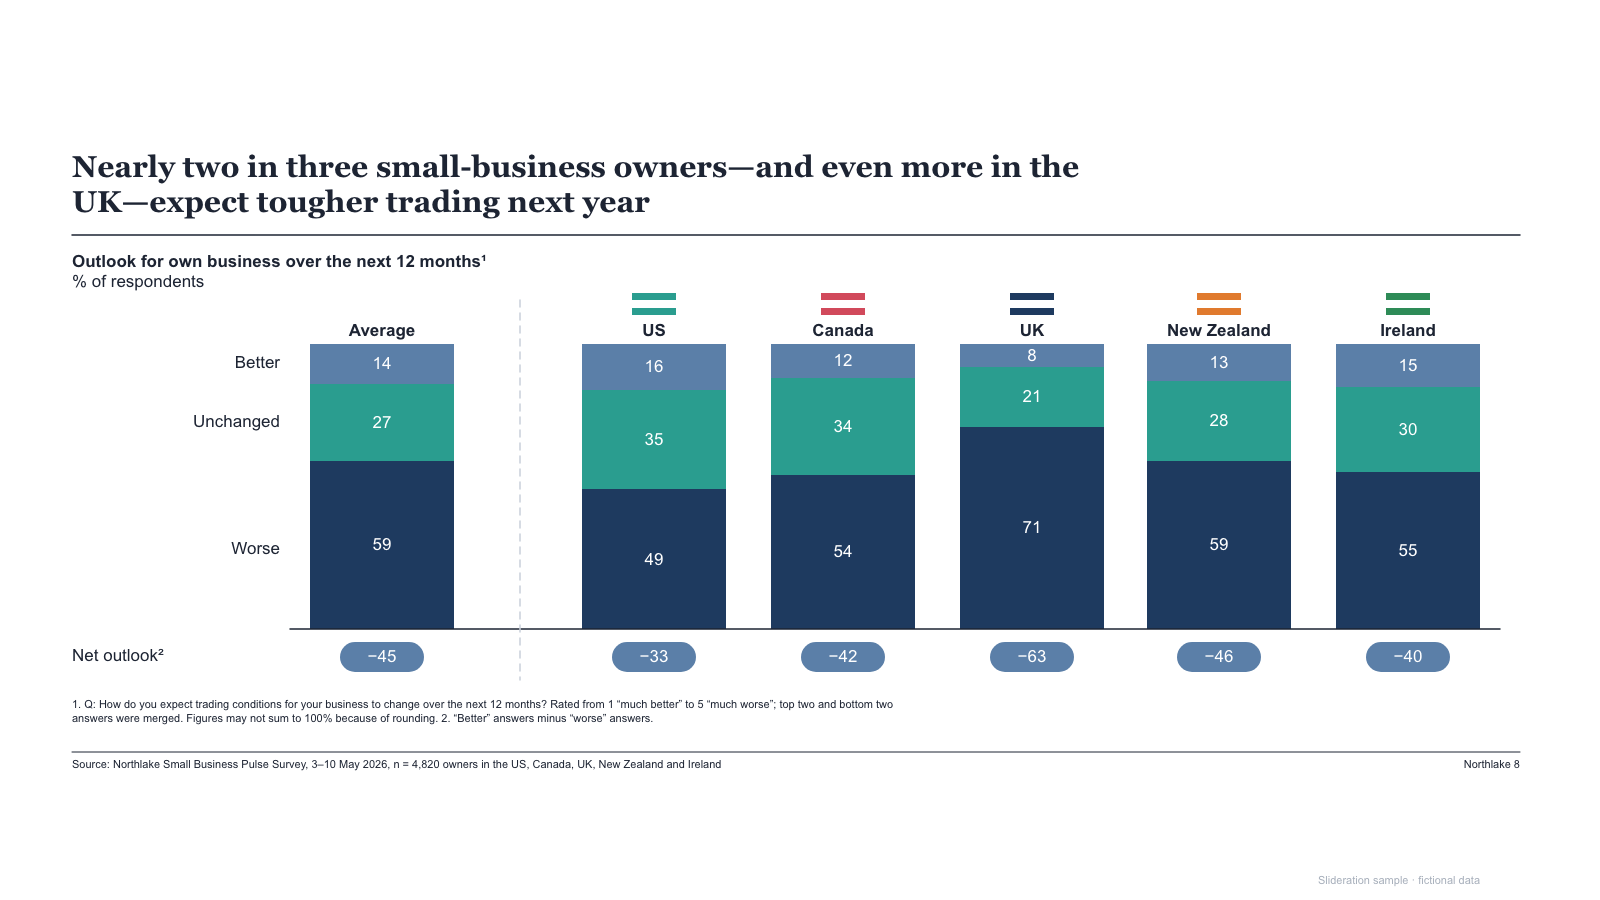
100% stacked columns by country with segment labels, row labels and net-score pills
1 slides · 1 credit
Check inputs & editing effort →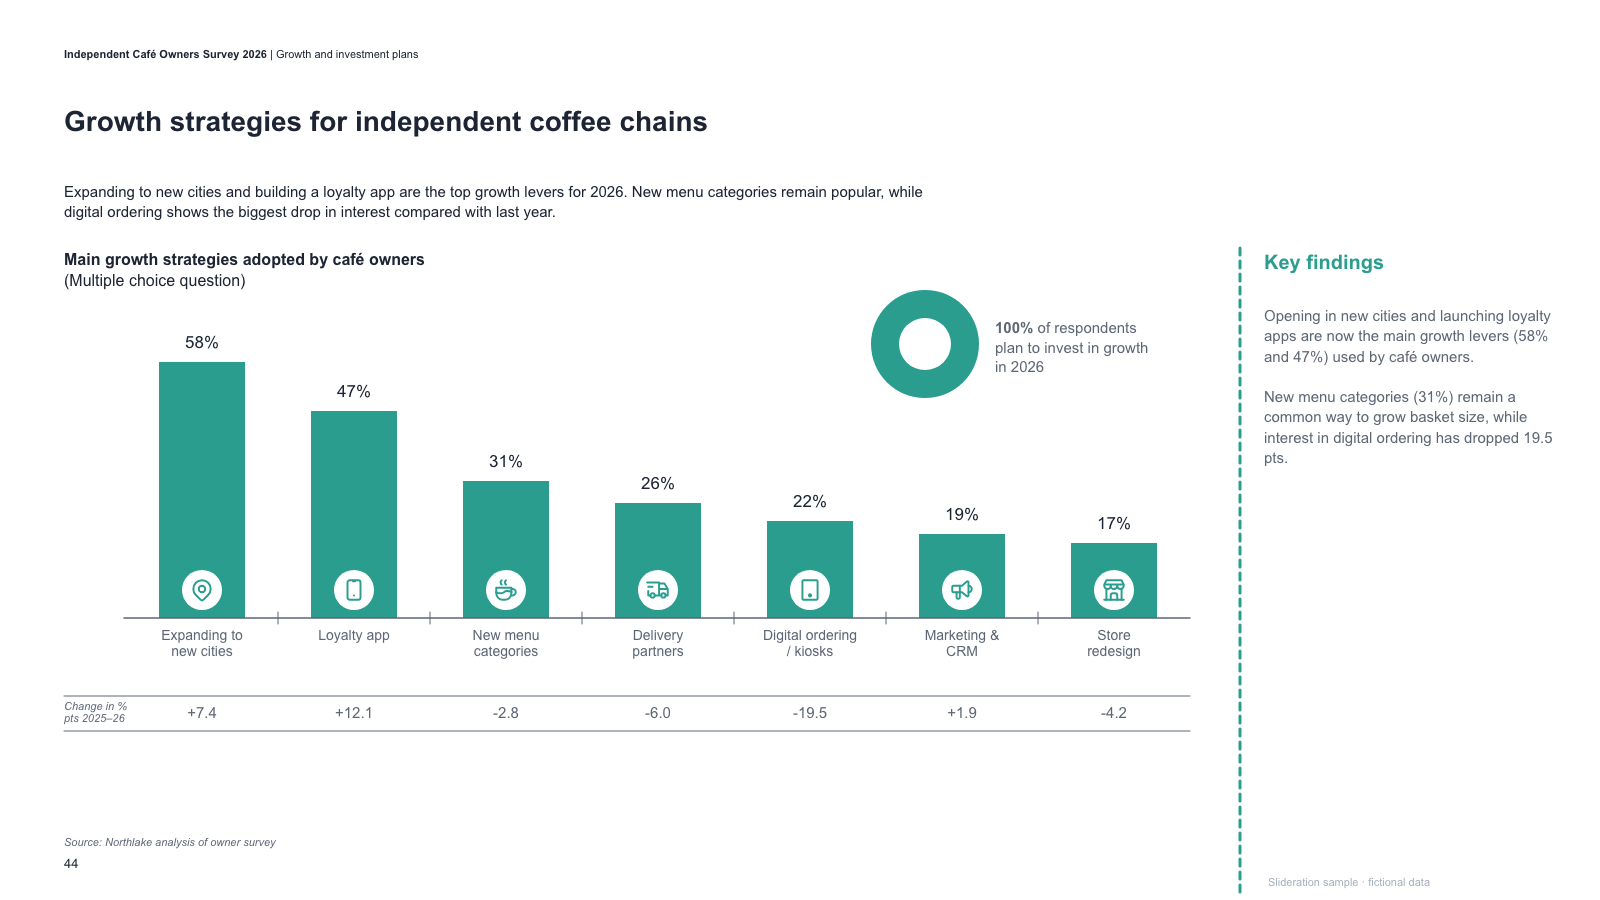
Ranked column chart with icons inside bars, change row, donut callout and key-findings column
1 slides · 1 credit
Check inputs & editing effort →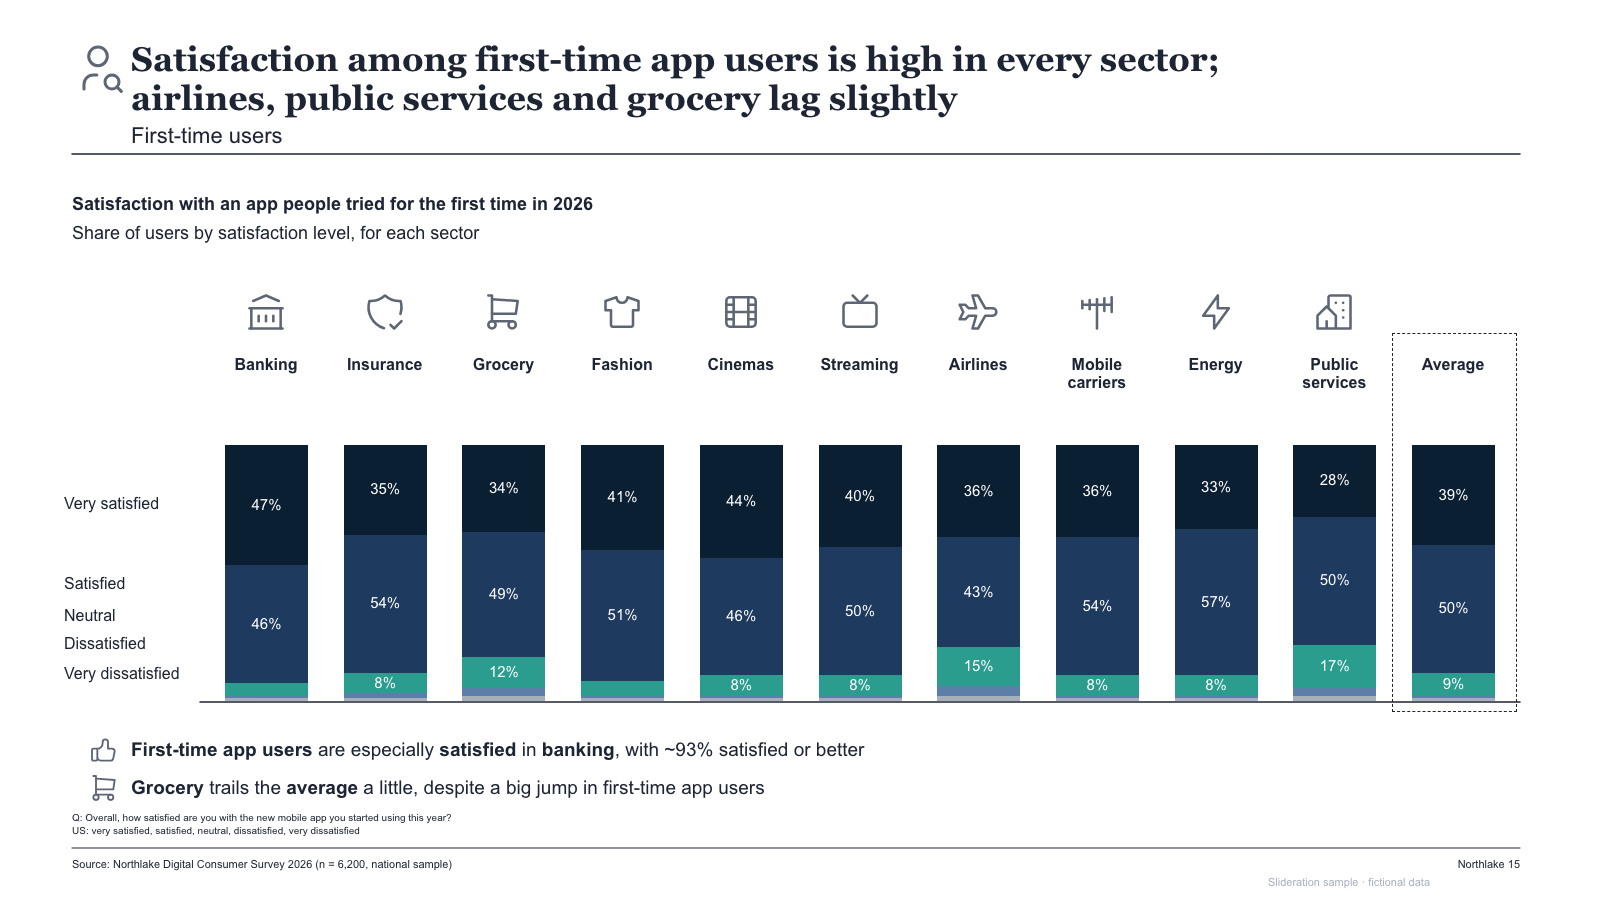
100% stacked satisfaction columns by industry with icons, segment labels and a dashed average column
1 slides · 1 credit
Check inputs & editing effort →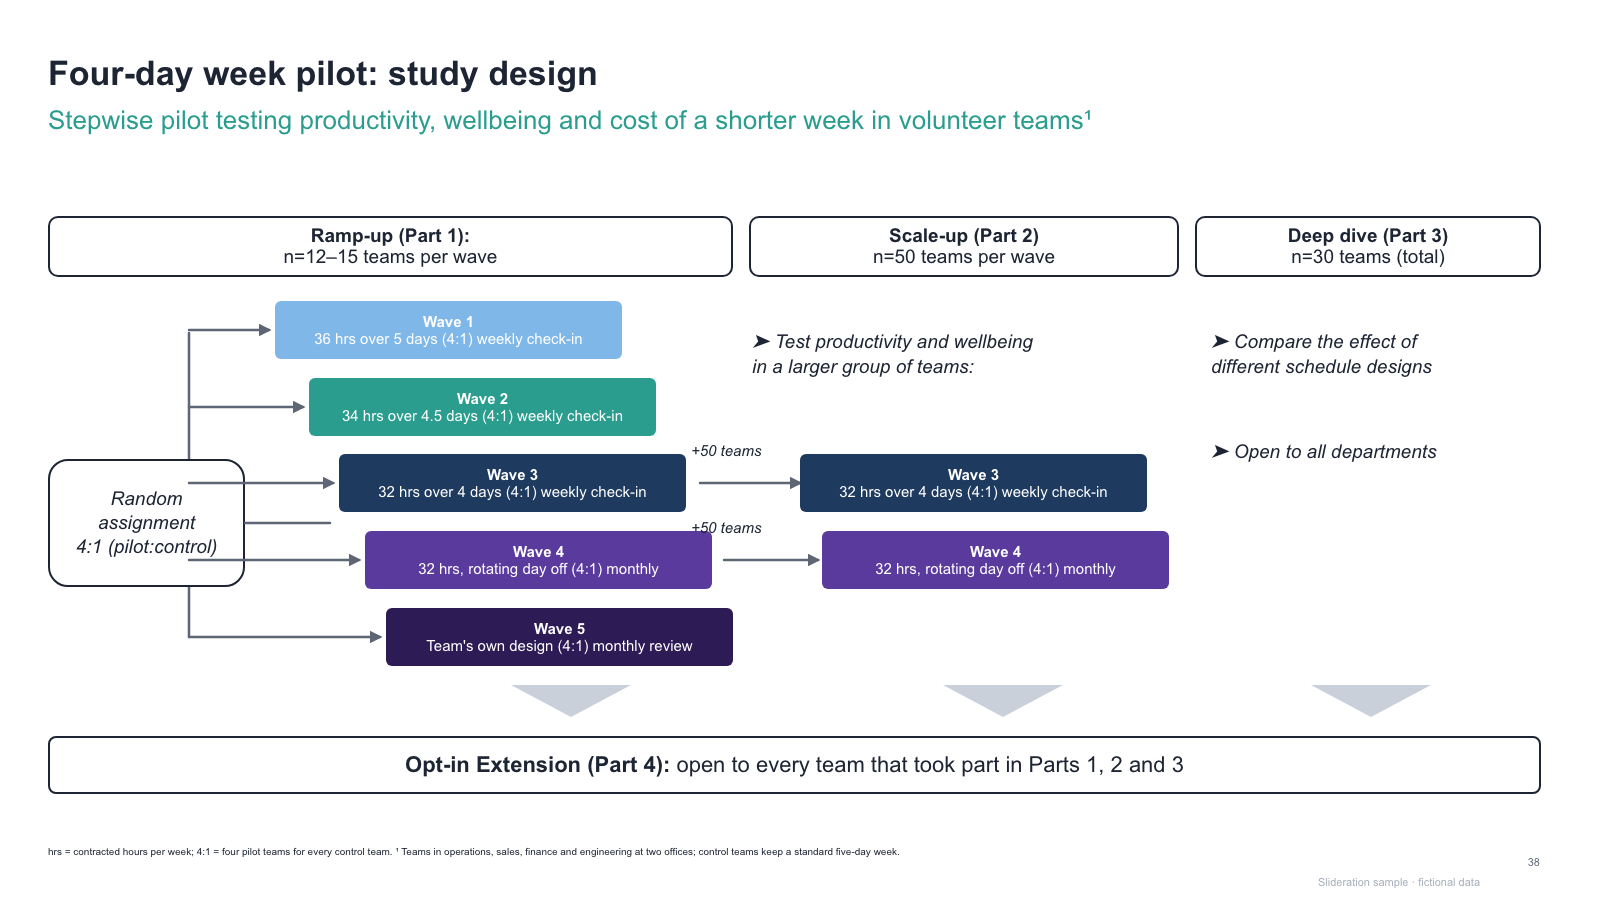
Staged trial design — randomisation box feeding staggered cohort bars, part headers and extension bar
1 slides · 1 credit
Check inputs & editing effort →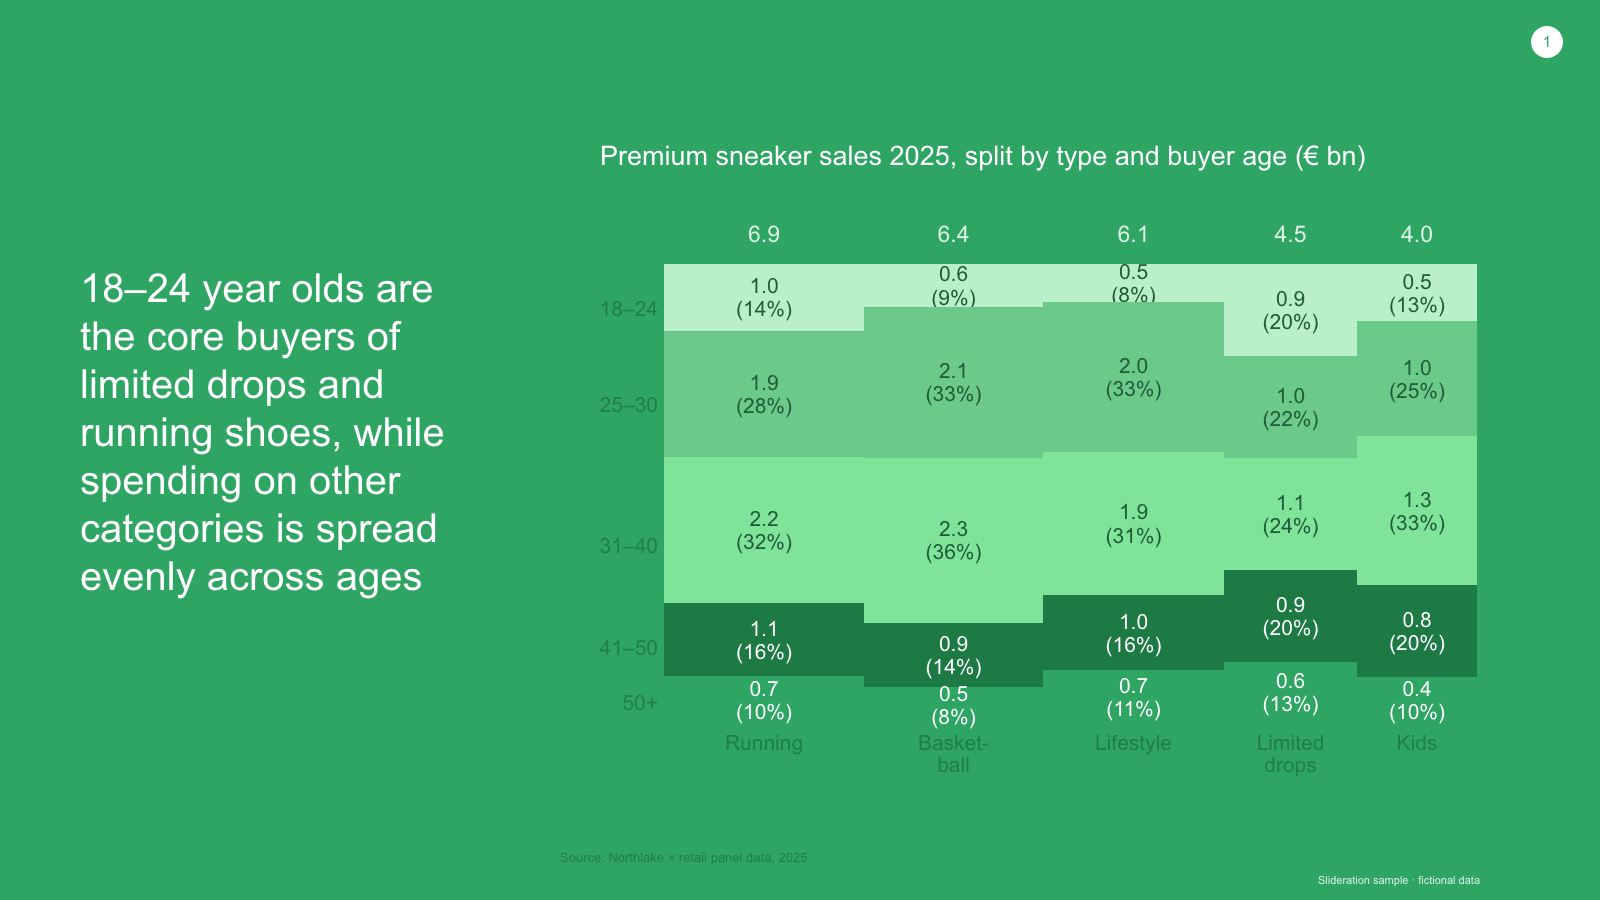
Full-colour background with a bold statement beside a stacked category-by-age market chart
1 slides · 1 credit
Check inputs & editing effort →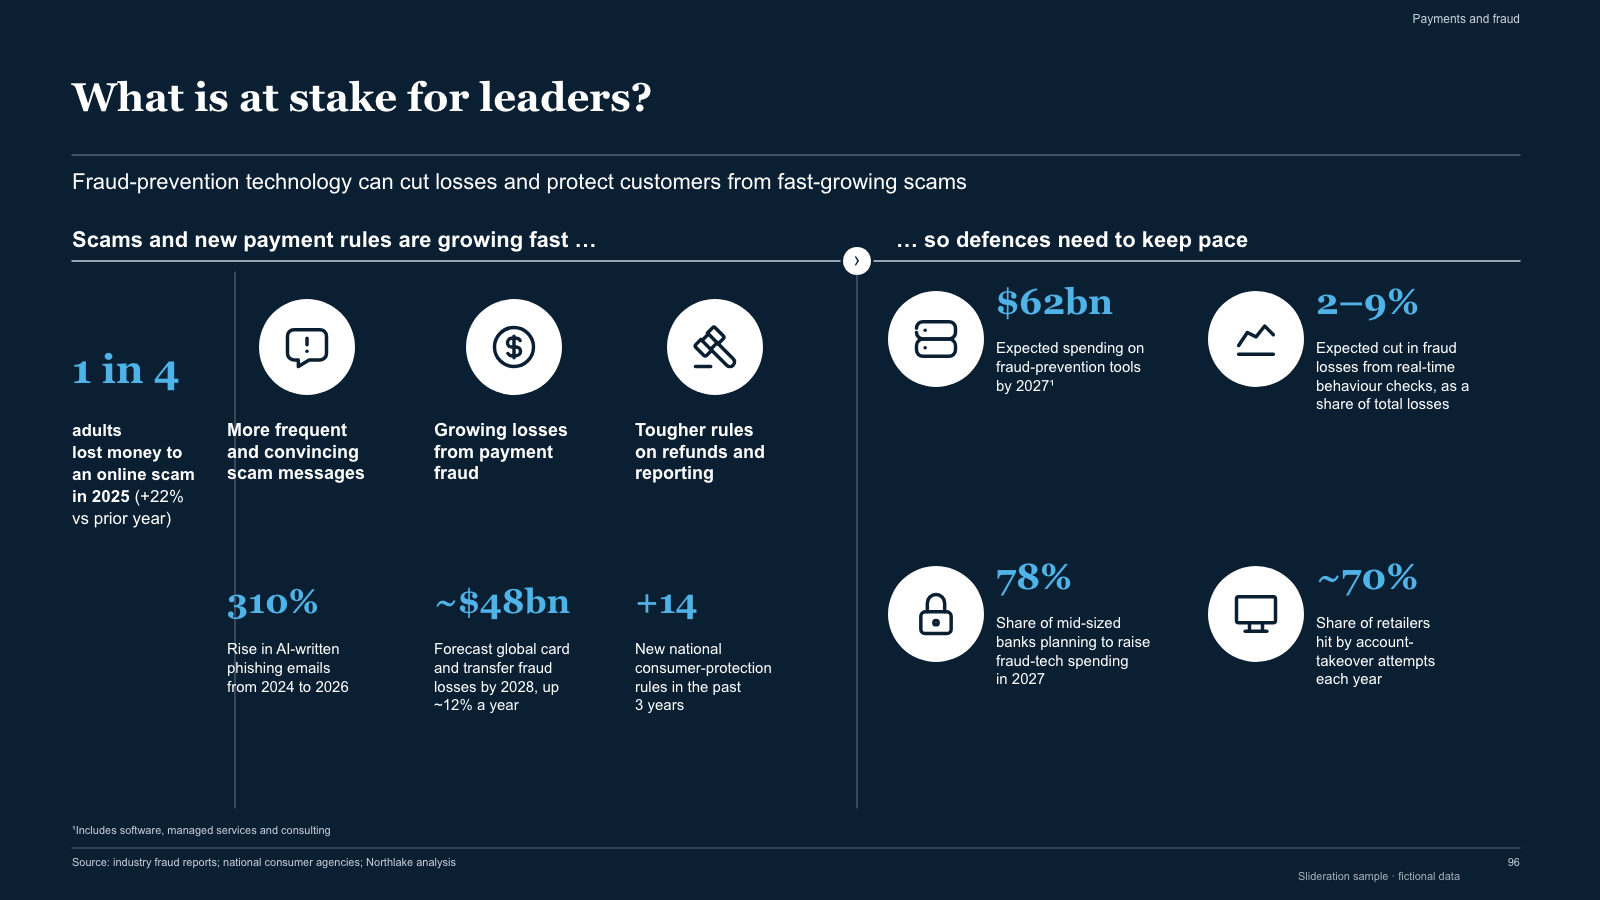
Dark stats dashboard — big lead stat, three icon columns with metrics, and a 2x2 icon-stat grid
1 slides · 1 credit
Check inputs & editing effort →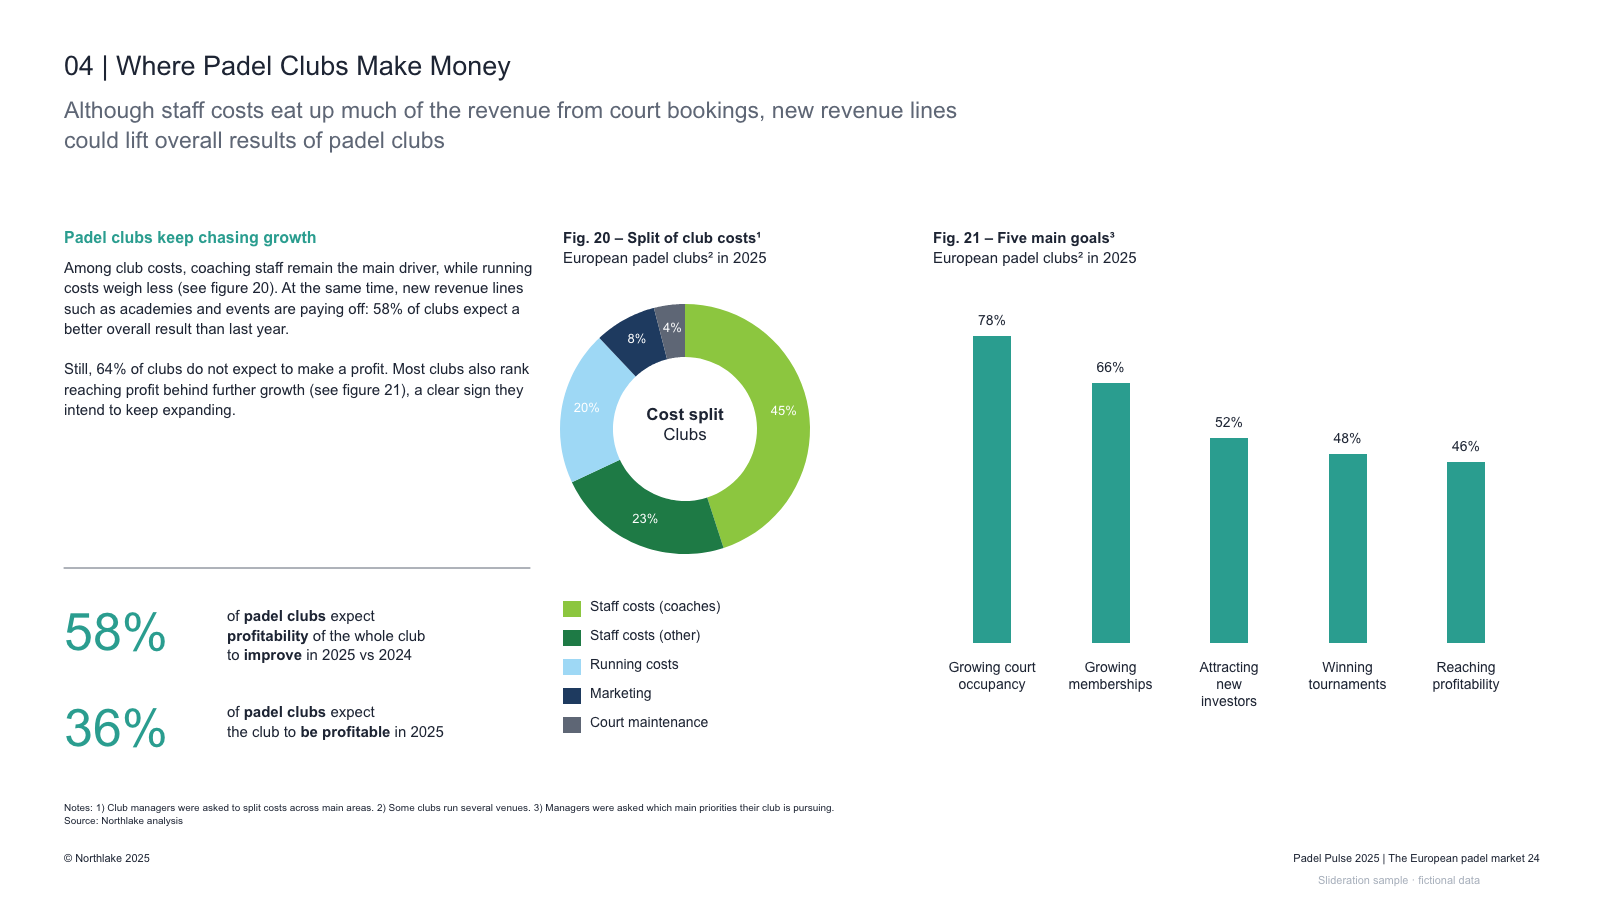
Report page — narrative column with big stats, cost-split donut with legend, and priority bar chart
1 slides · 1 credit
Check inputs & editing effort →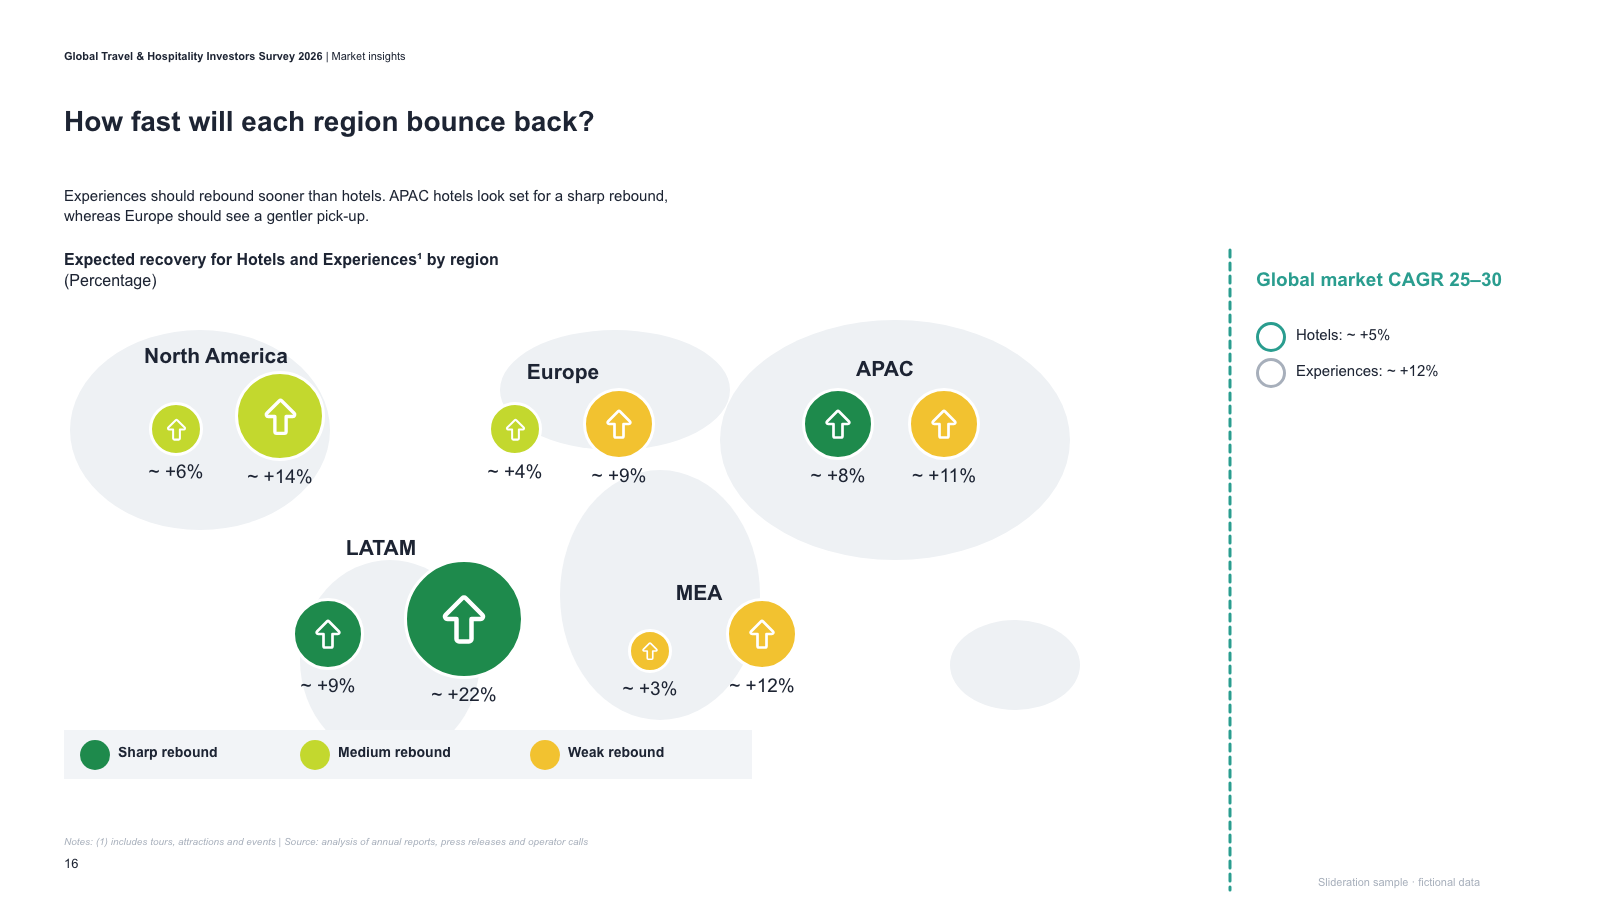
Map-style regional panel with paired recovery badges and values, legend and a side CAGR note
1 slides · 1 credit
Check inputs & editing effort →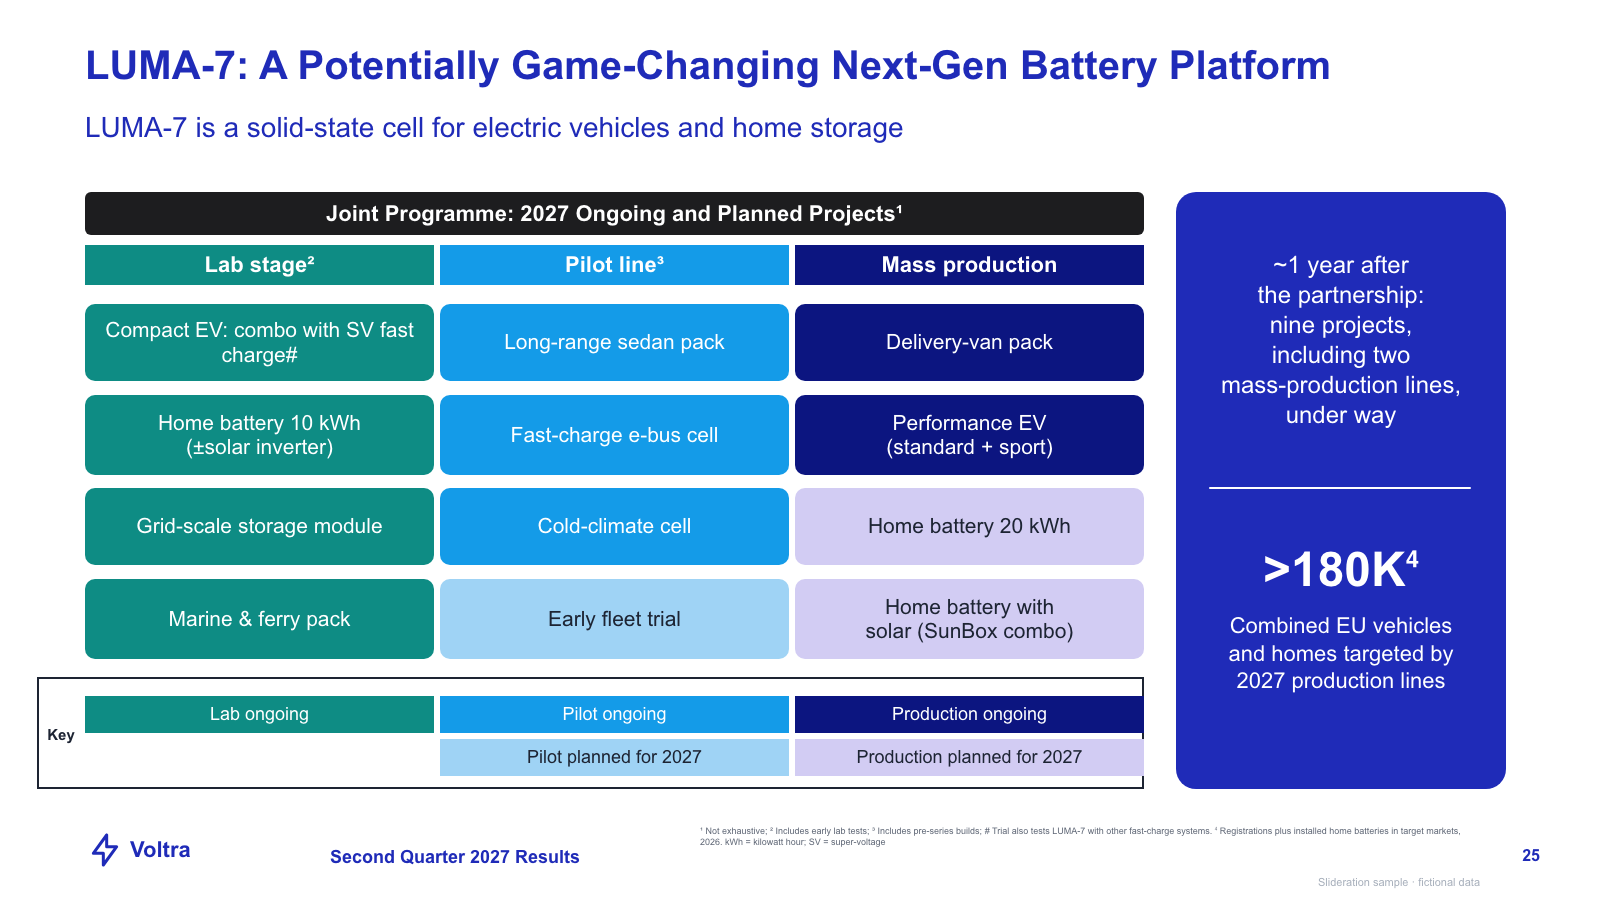
Programme matrix — dark title bar, three phase columns of coloured study cells, legend and stat panel
1 slides · 1 credit
Check inputs & editing effort →
Two brand scorecards (headline stats, flags, engagement/growth stats, target) around a faded narrative column
1 slides · 1 credit
Check inputs & editing effort →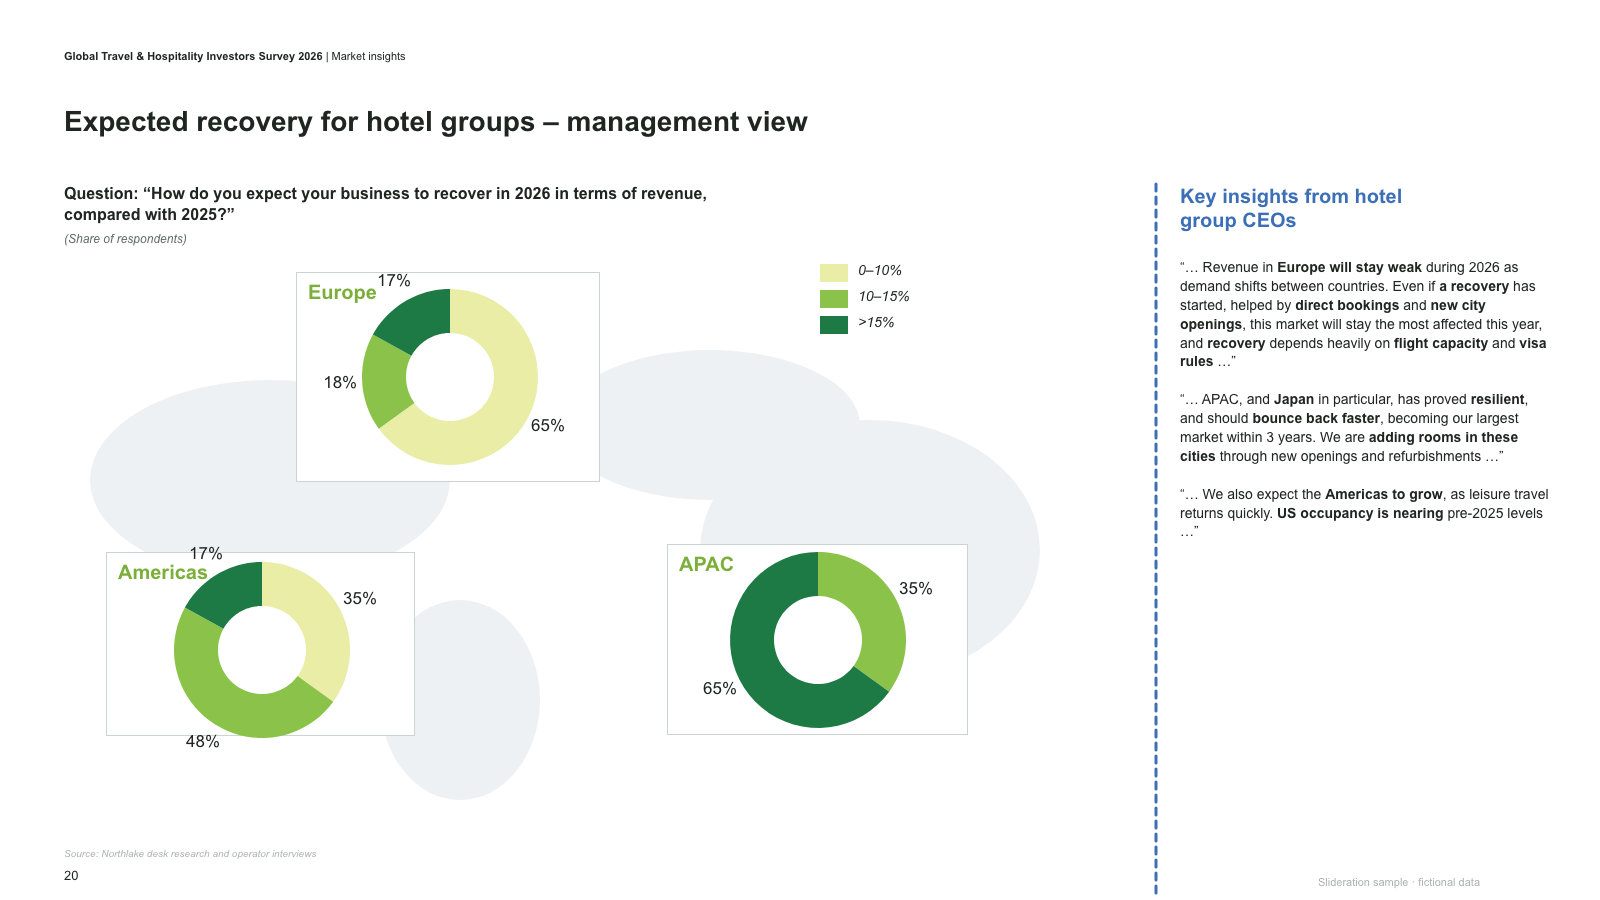
Map-style panel with three regional donut charts in boxes, legend and a quotes column
1 slides · 1 credit
Check inputs & editing effort →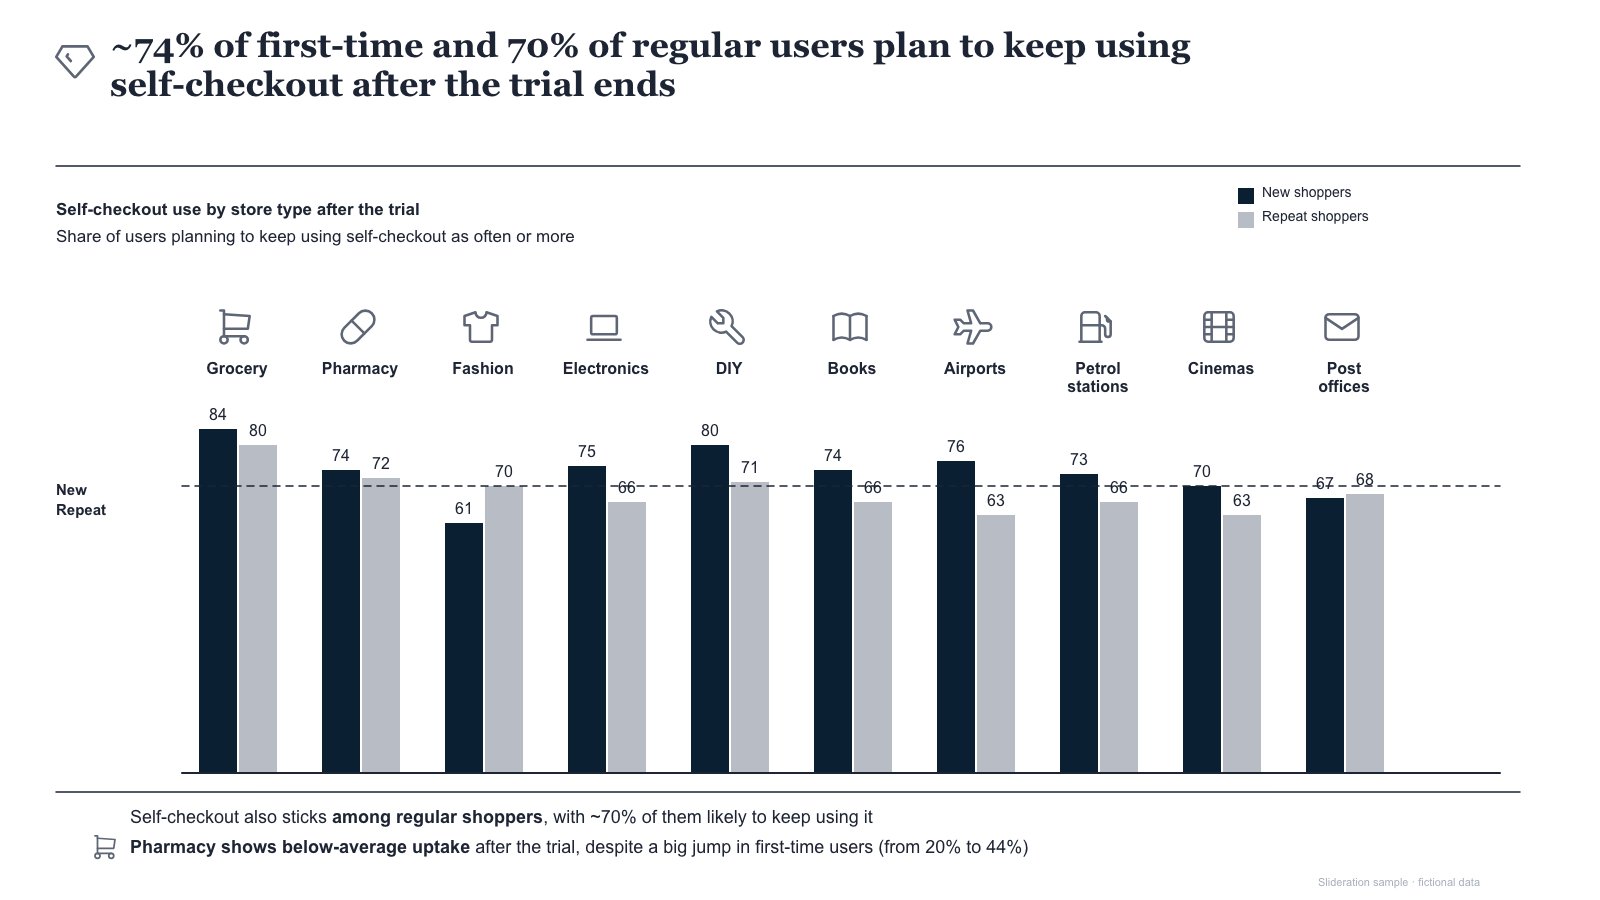
Grouped column pairs by sector with icons, value labels, dashed reference line and two icon takeaways
1 slides · 1 credit
Check inputs & editing effort →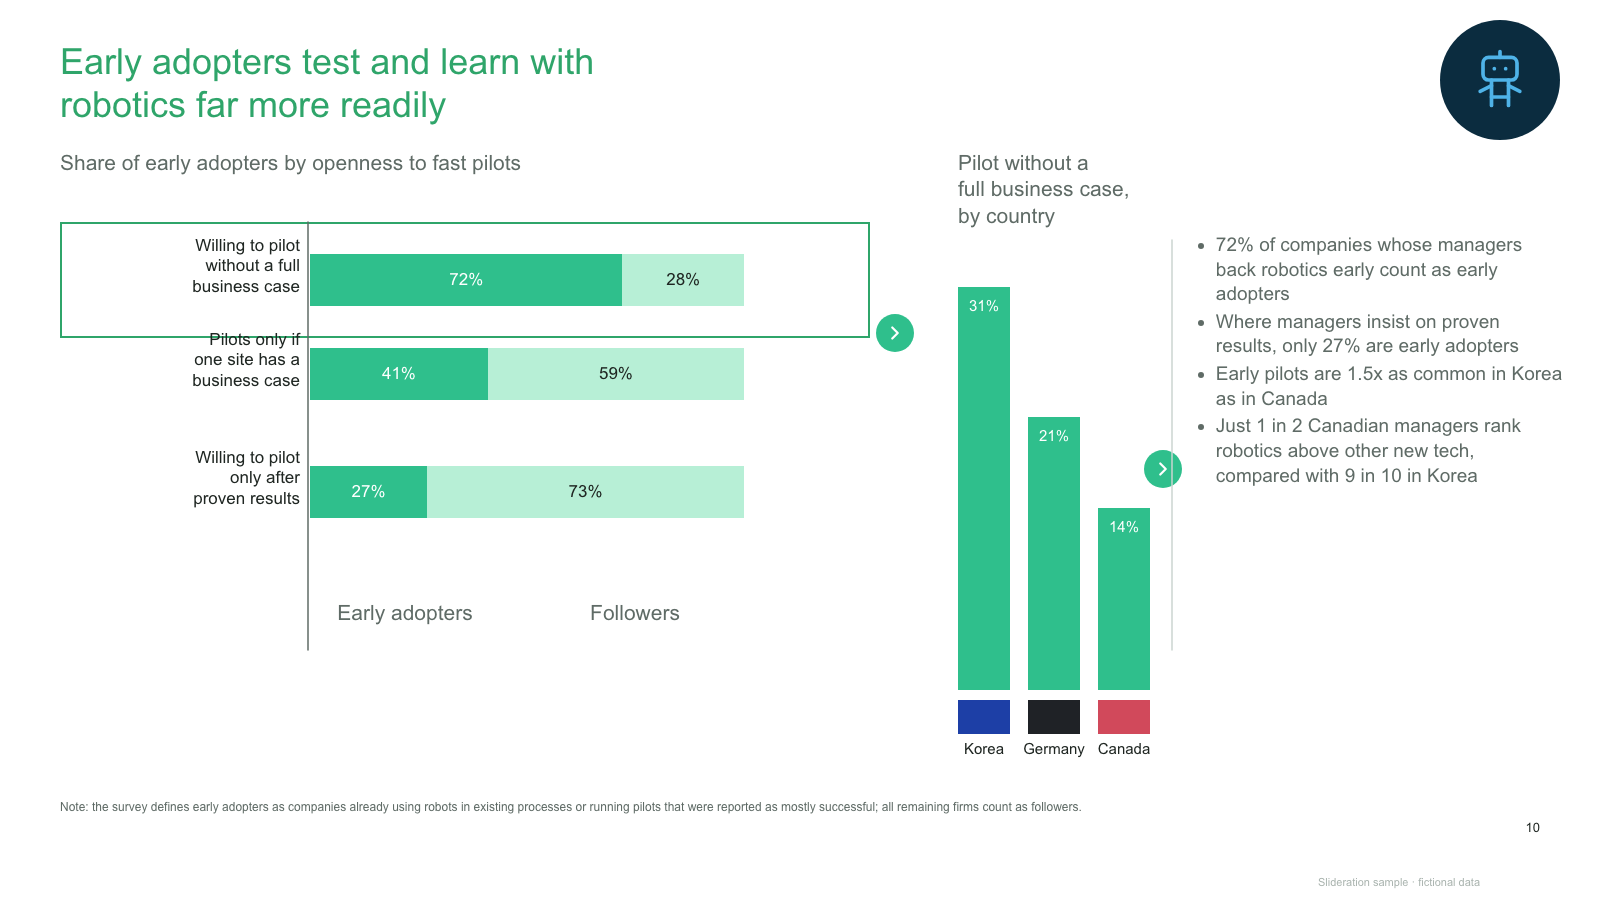
Highlighted 100% bar comparison of three groups with arrows to a country column chart and bullet takeaways
1 slides · 1 credit
Check inputs & editing effort →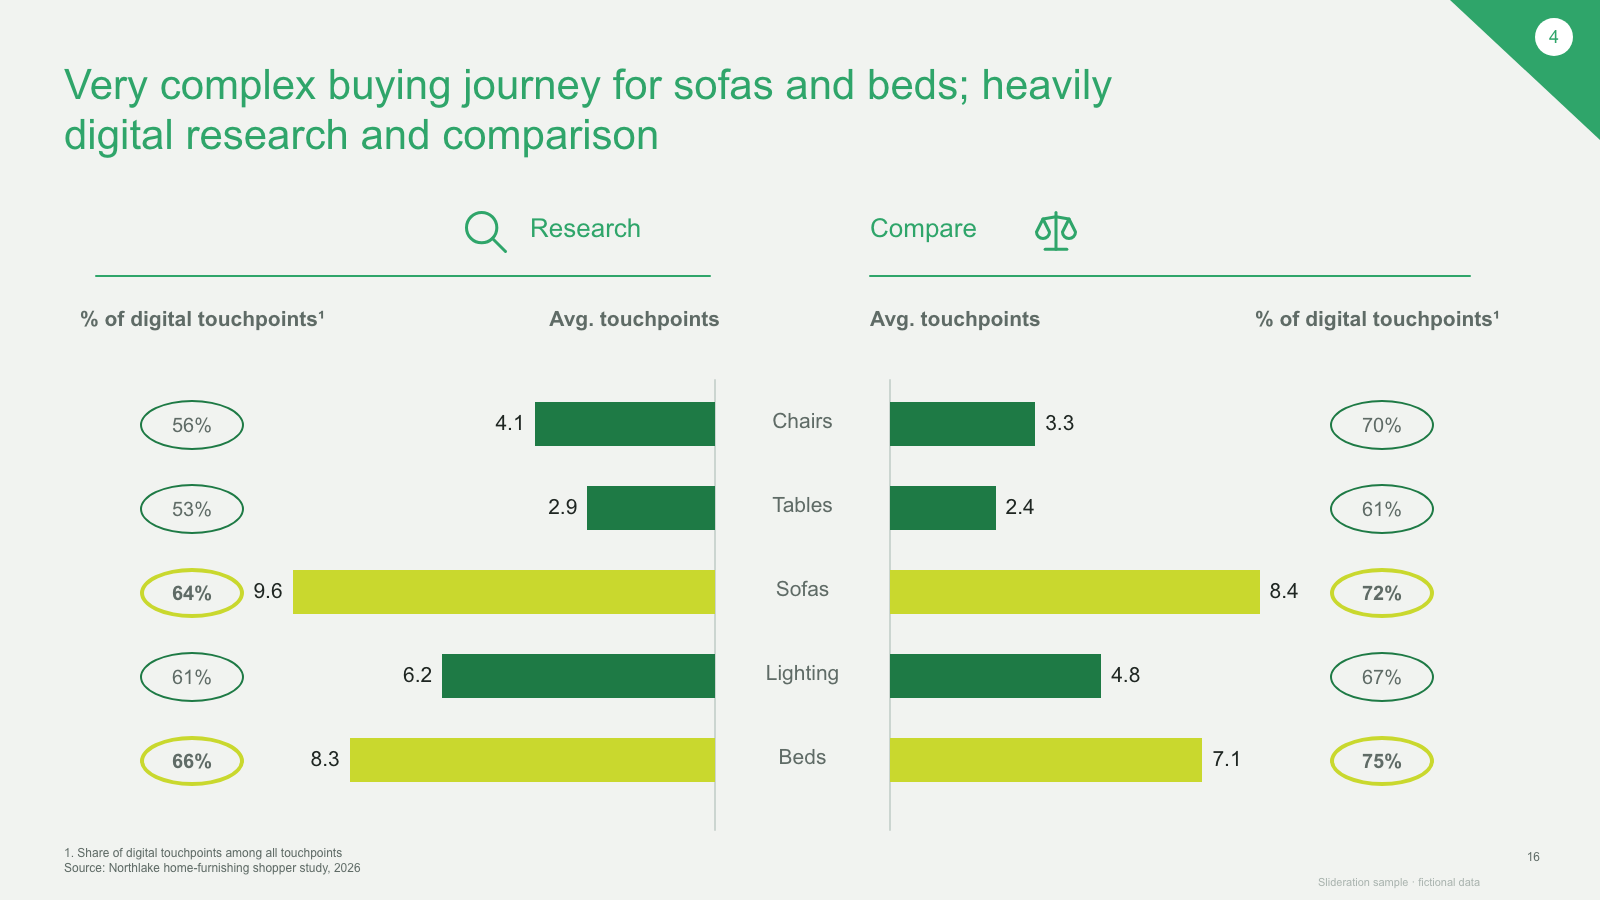
Butterfly bar chart — two stages with circled percentages on outer edges and shared category labels
1 slides · 1 credit
Check inputs & editing effort →
Grouped horizontal bars per statement (seven countries), grouped by two stances, with quotes and a legend
1 slides · 1 credit
Check inputs & editing effort →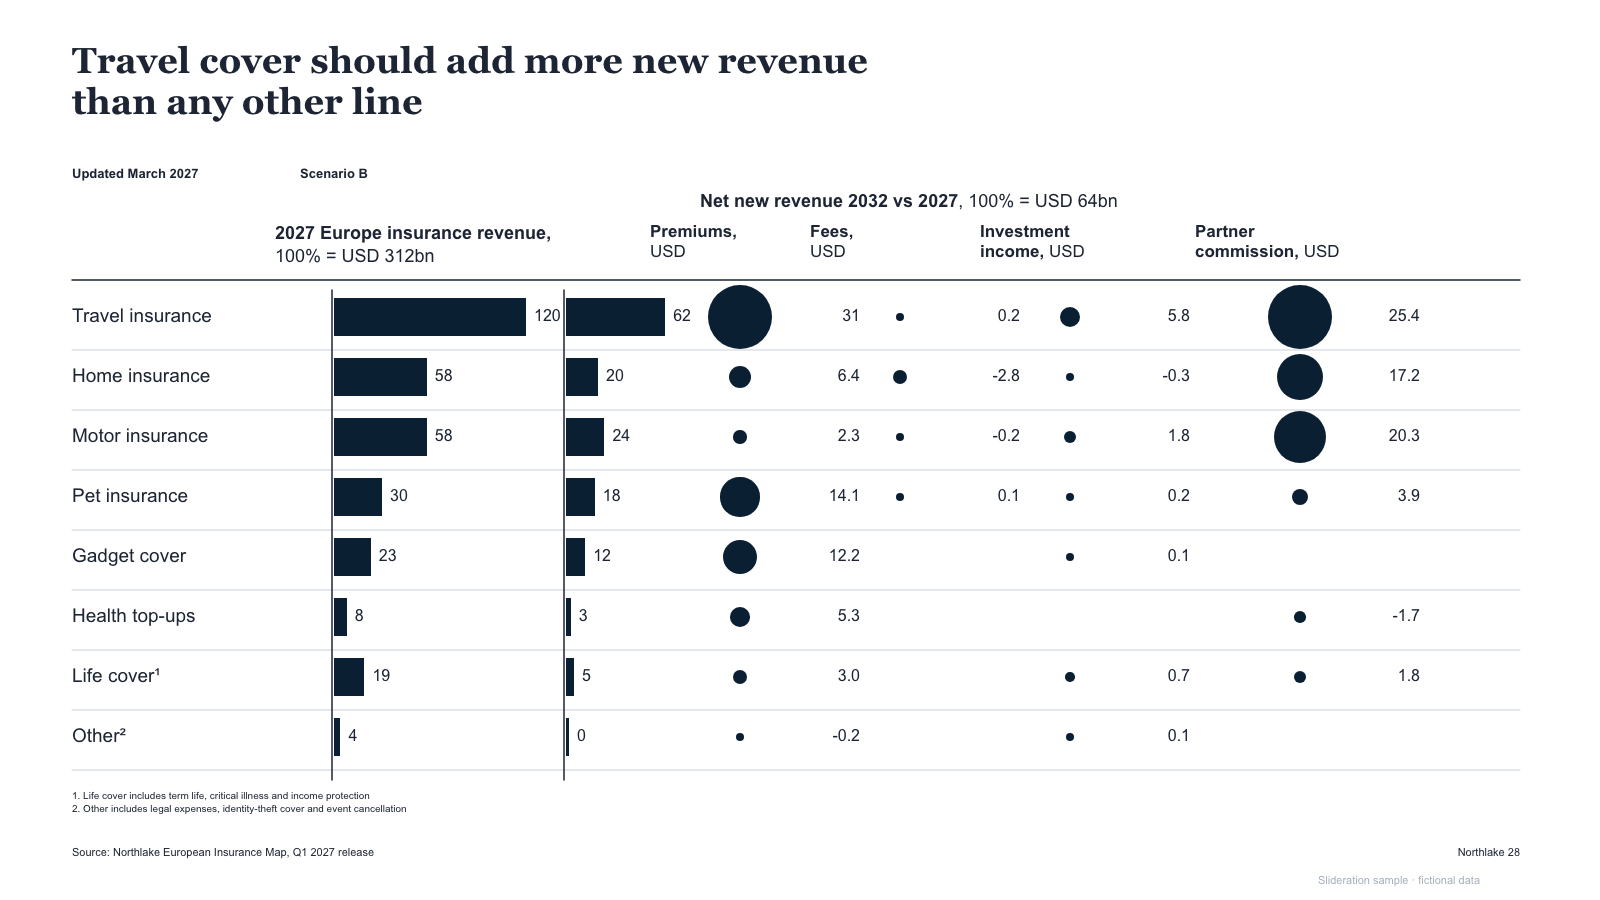
Multi-column table — base bars, second bar series, bubble columns with values, per category row
1 slides · 1 credit
Check inputs & editing effort →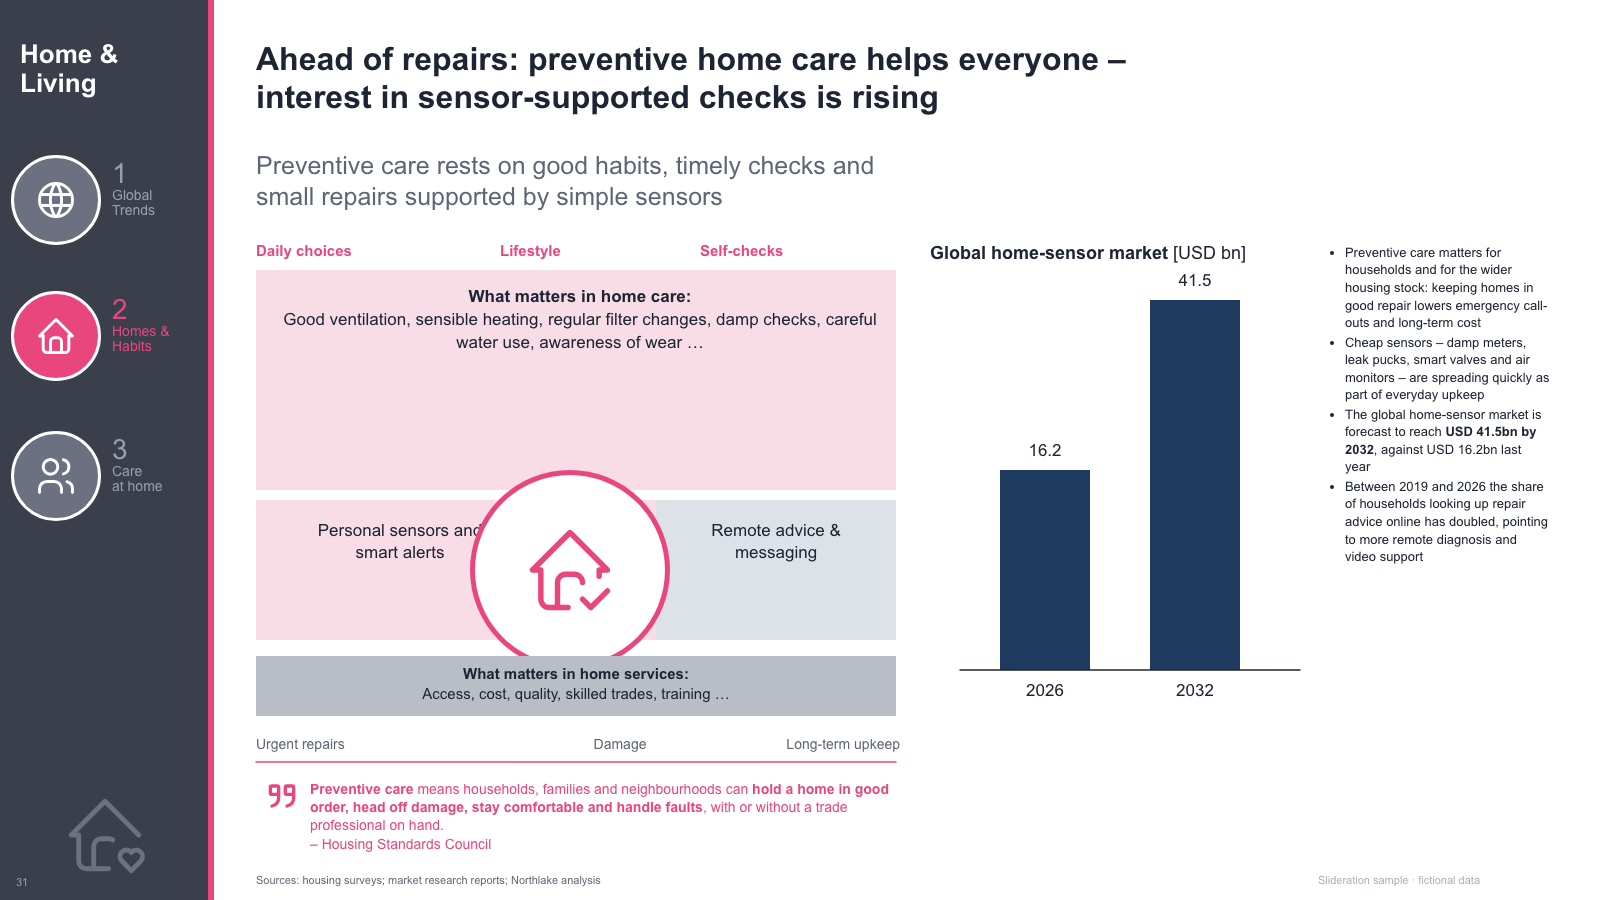
Side rail, tinted factor blocks with a circular emblem, a bar chart panel, bullet column and pull quote
1 slides · 1 credit
Check inputs & editing effort →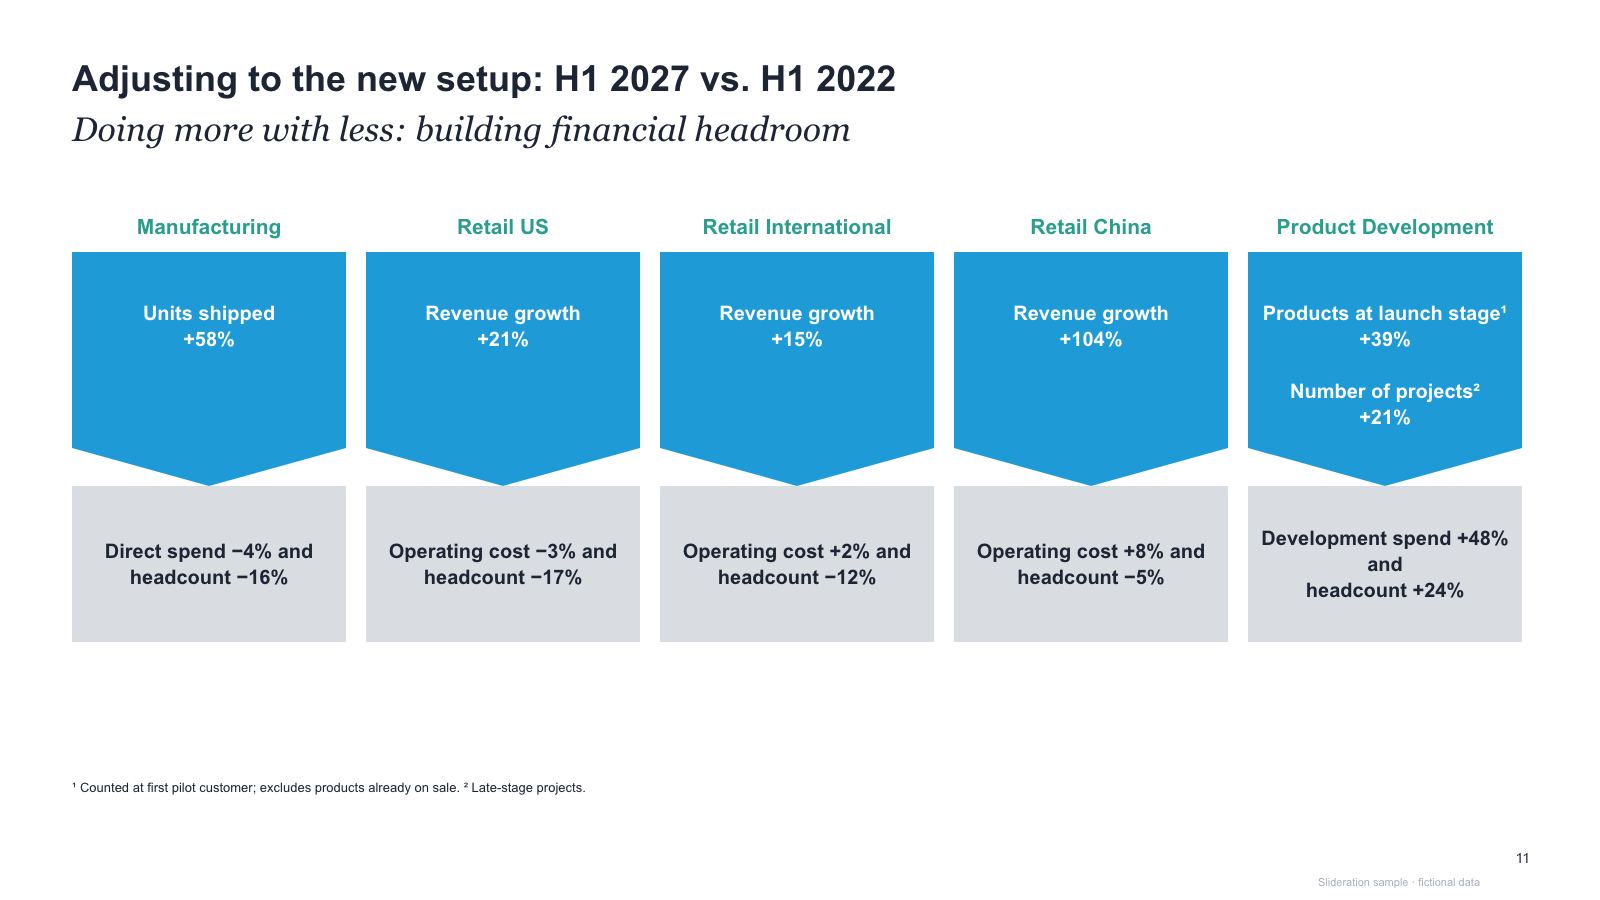
Five unit columns, each a coloured metric card with a notch pointing to a grey cost line
1 slides · 1 credit
Check inputs & editing effort →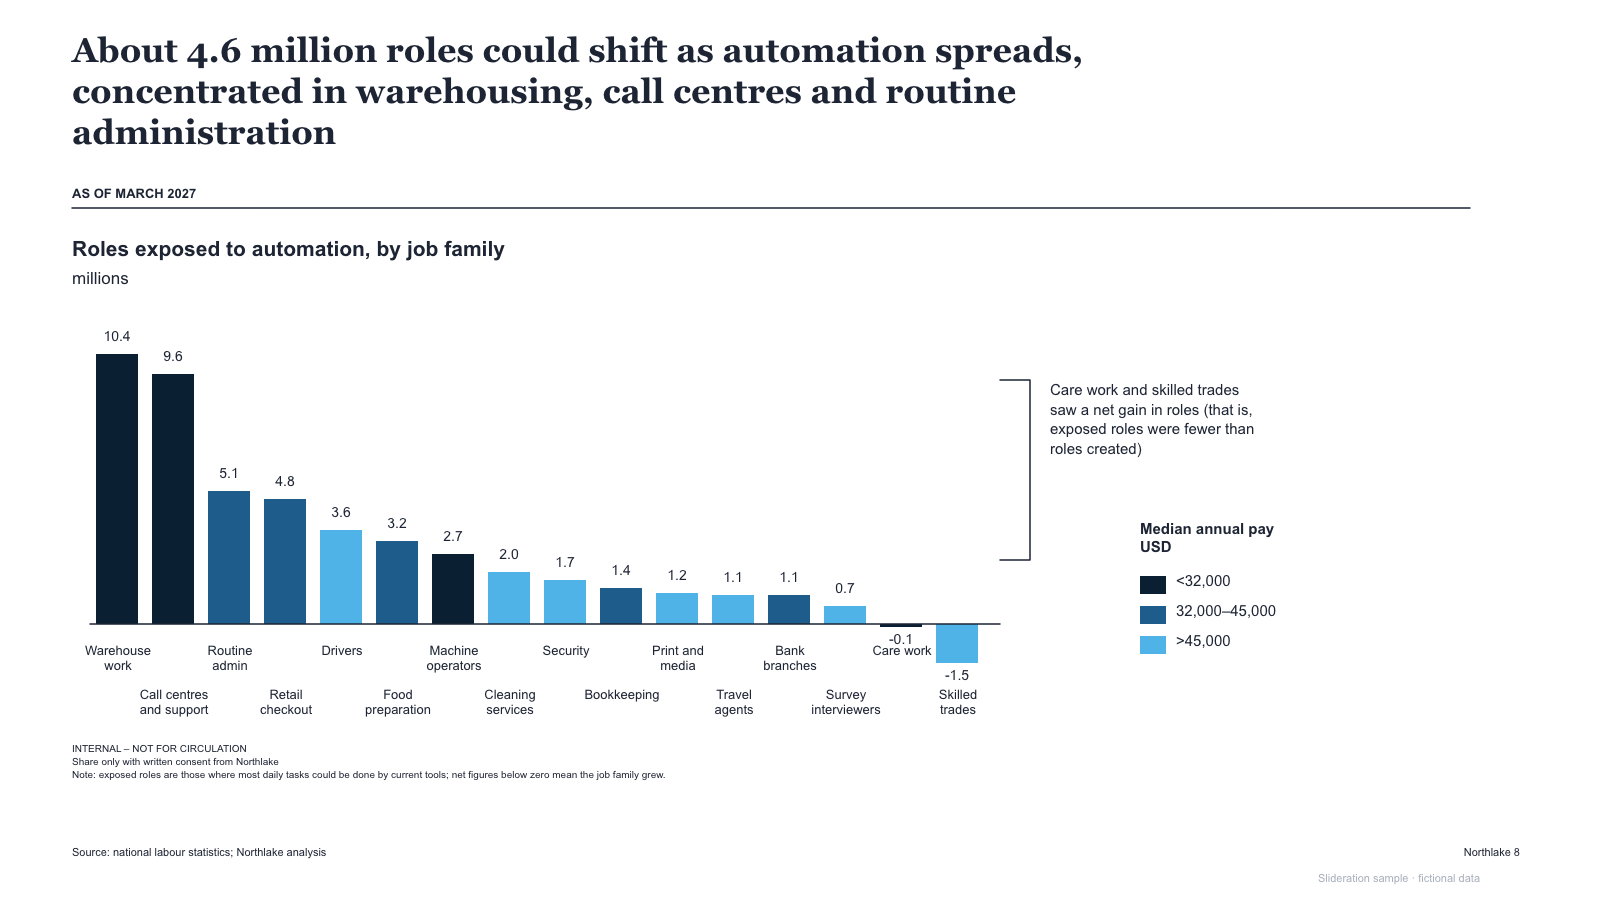
Ranked bar chart with wage-band colour legend, two negative bars and a bracketed side note
1 slides · 1 credit
Check inputs & editing effort →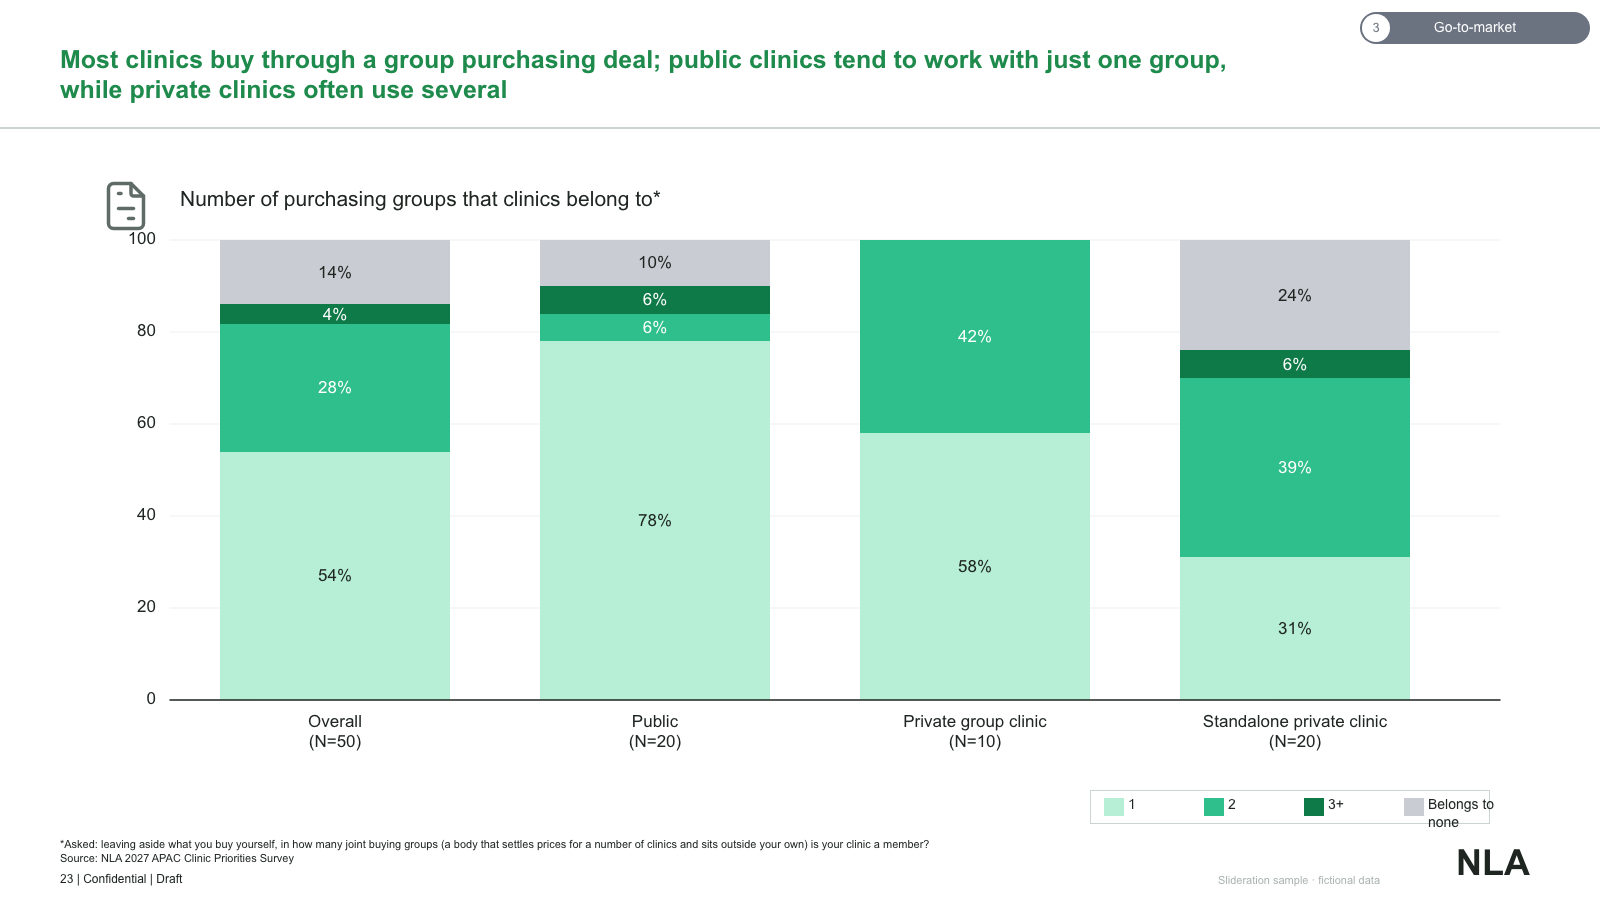
100% stacked columns by segment with percentage labels, axis ticks and a bottom legend row
1 slides · 1 credit
Check inputs & editing effort →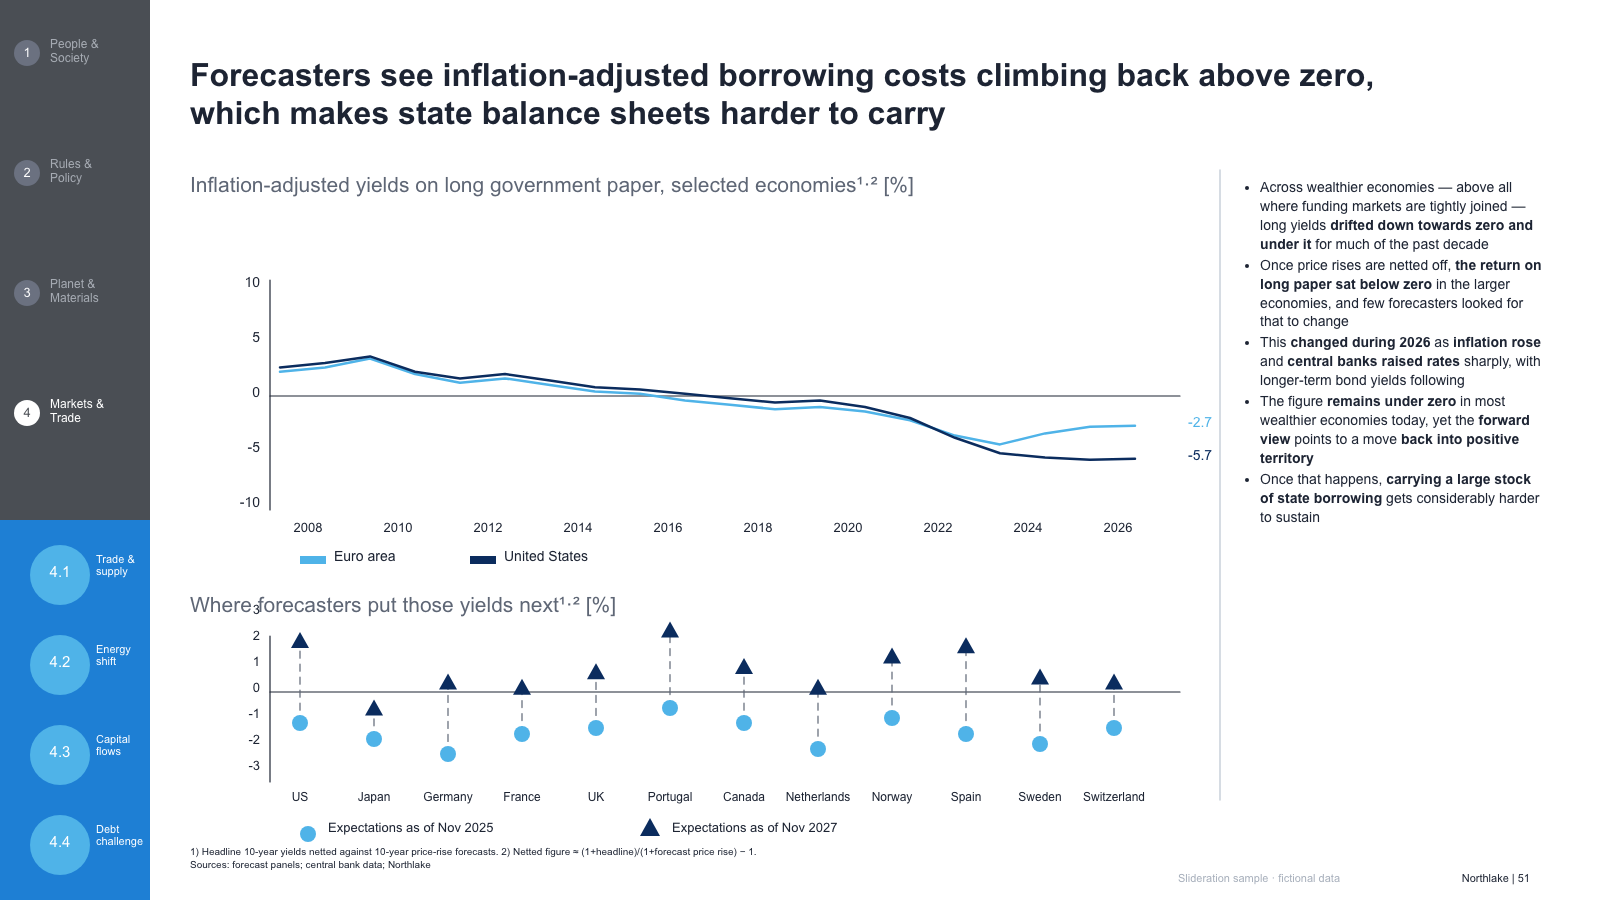
Side rail with numbered sections, two stacked charts (line and dot range) and a bullet column
1 slides · 1 credit
Check inputs & editing effort →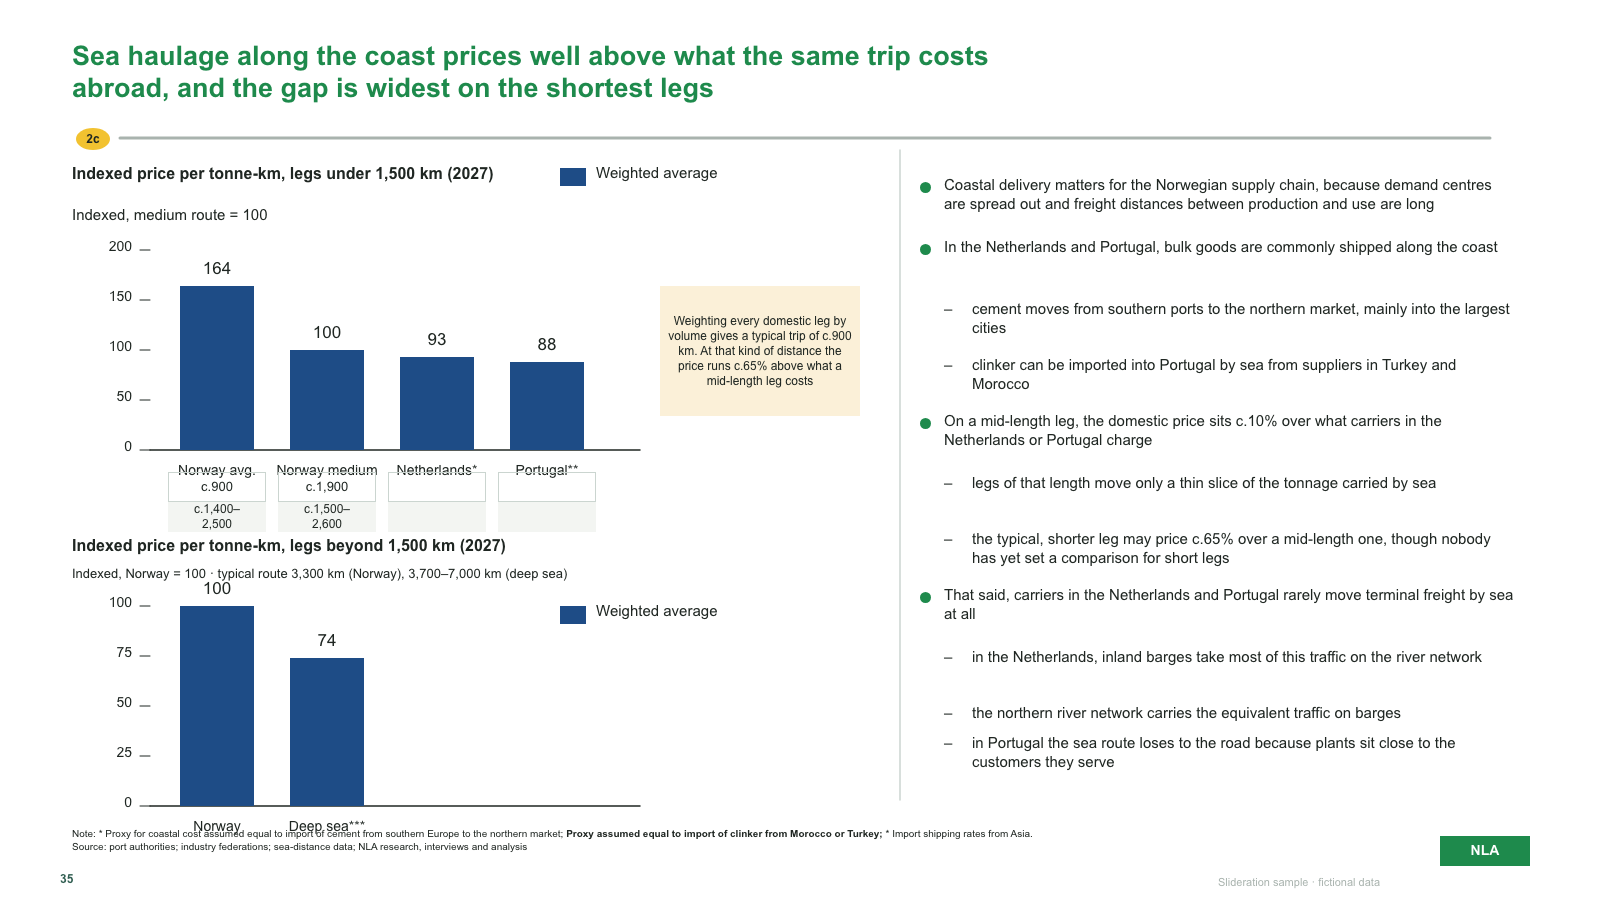
Two indexed bar charts with weighted-average legend, note callout, route tables and bullet column
1 slides · 1 credit
Check inputs & editing effort →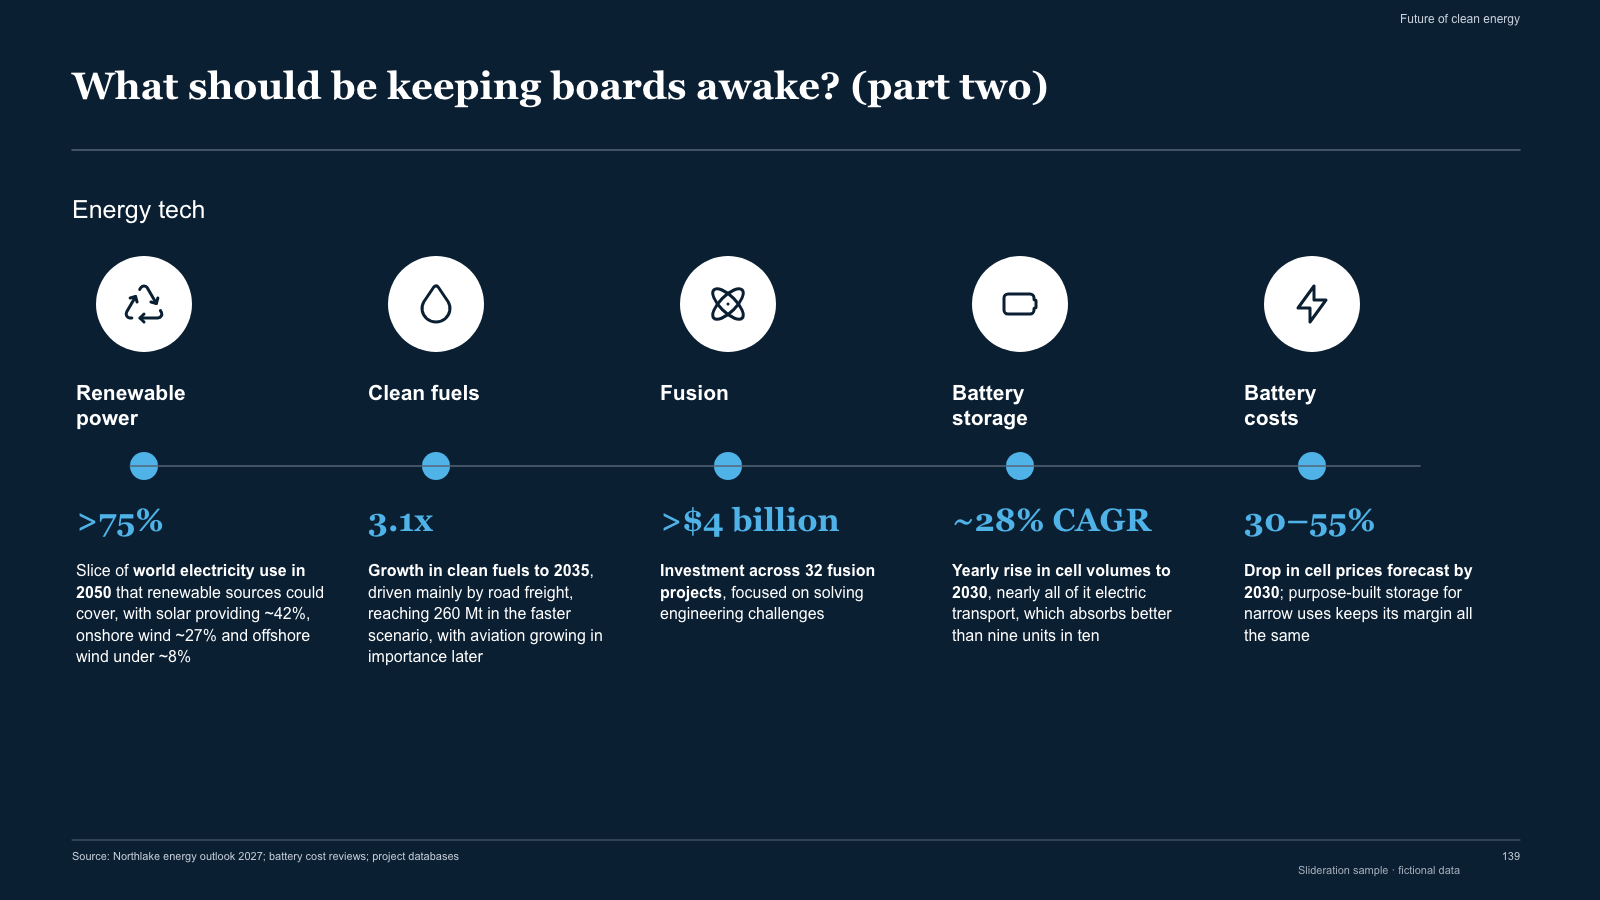
Dark stat row — five icon badges on a connector line, each with a big number and explanation
1 slides · 1 credit
Check inputs & editing effort →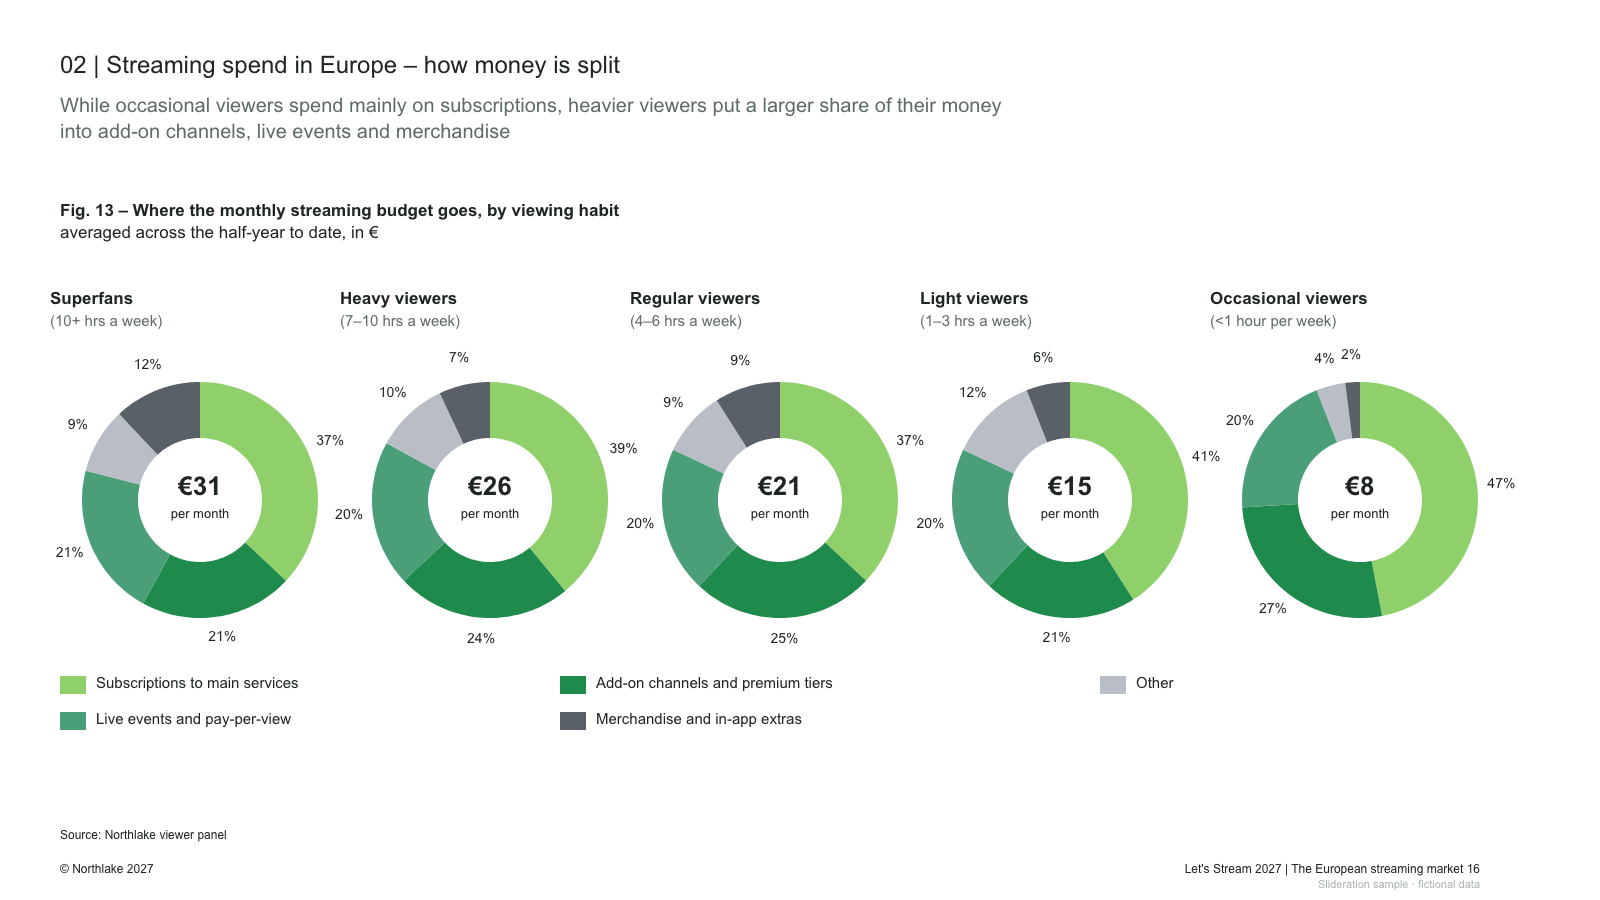
Five donut charts with centre values, segment labels and a two-row legend
1 slides · 1 credit
Check inputs & editing effort →
Rail of numbered sections beside three columns of attributed expert quotes with a closing mark
1 slides · 1 credit
Check inputs & editing effort →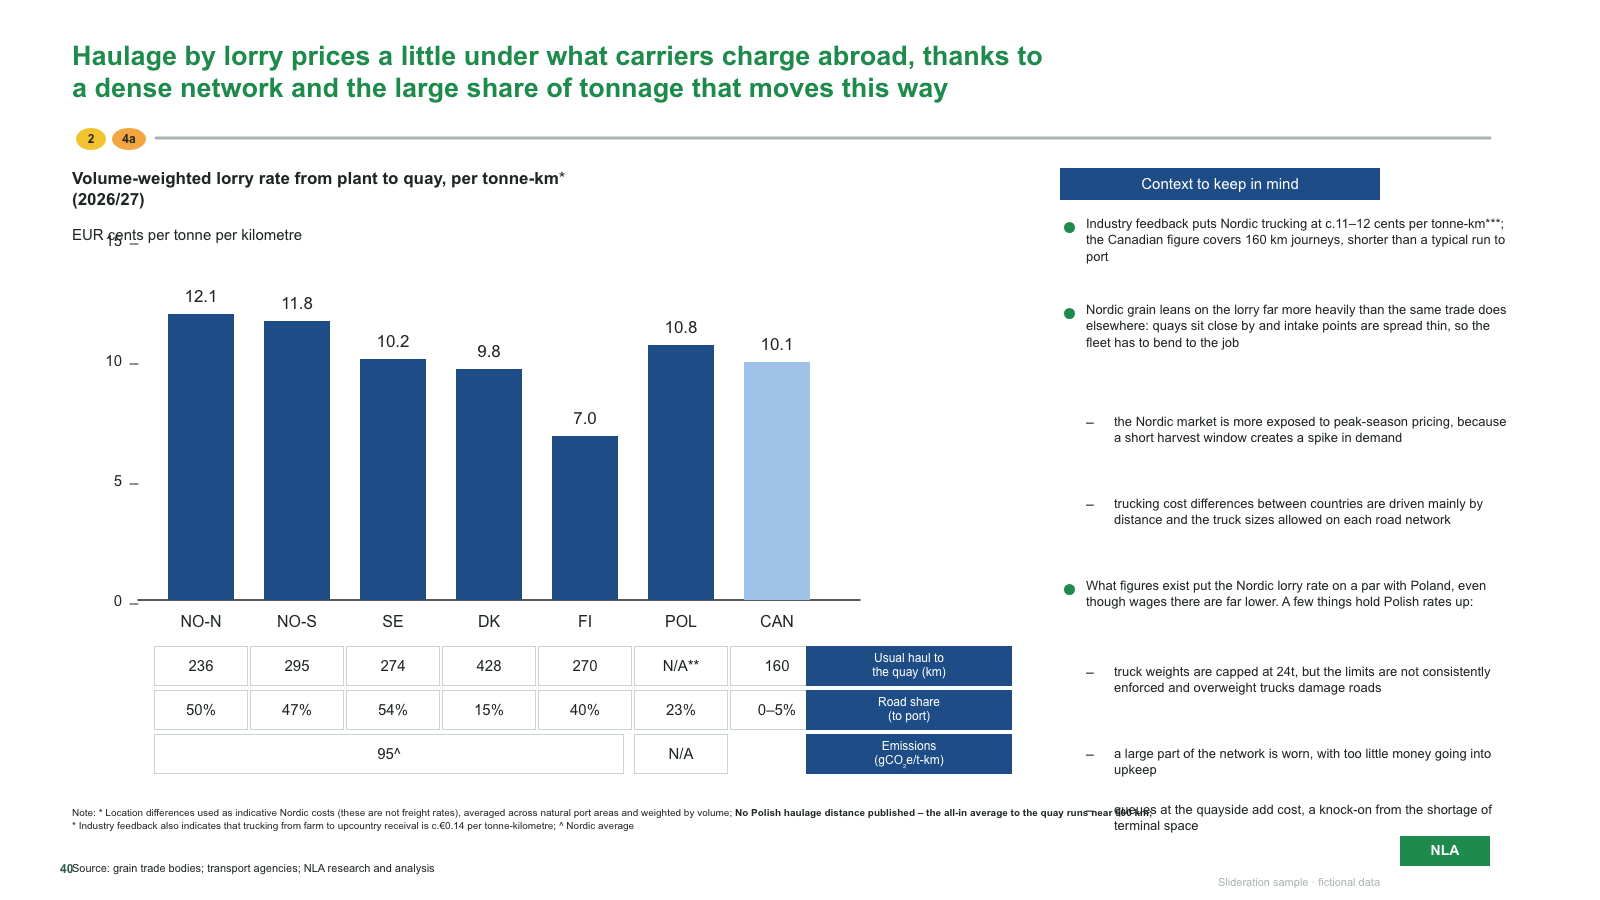
Bar chart with speech-bubble callouts, a three-row data table and a boxed considerations column
1 slides · 1 credit
Check inputs & editing effort →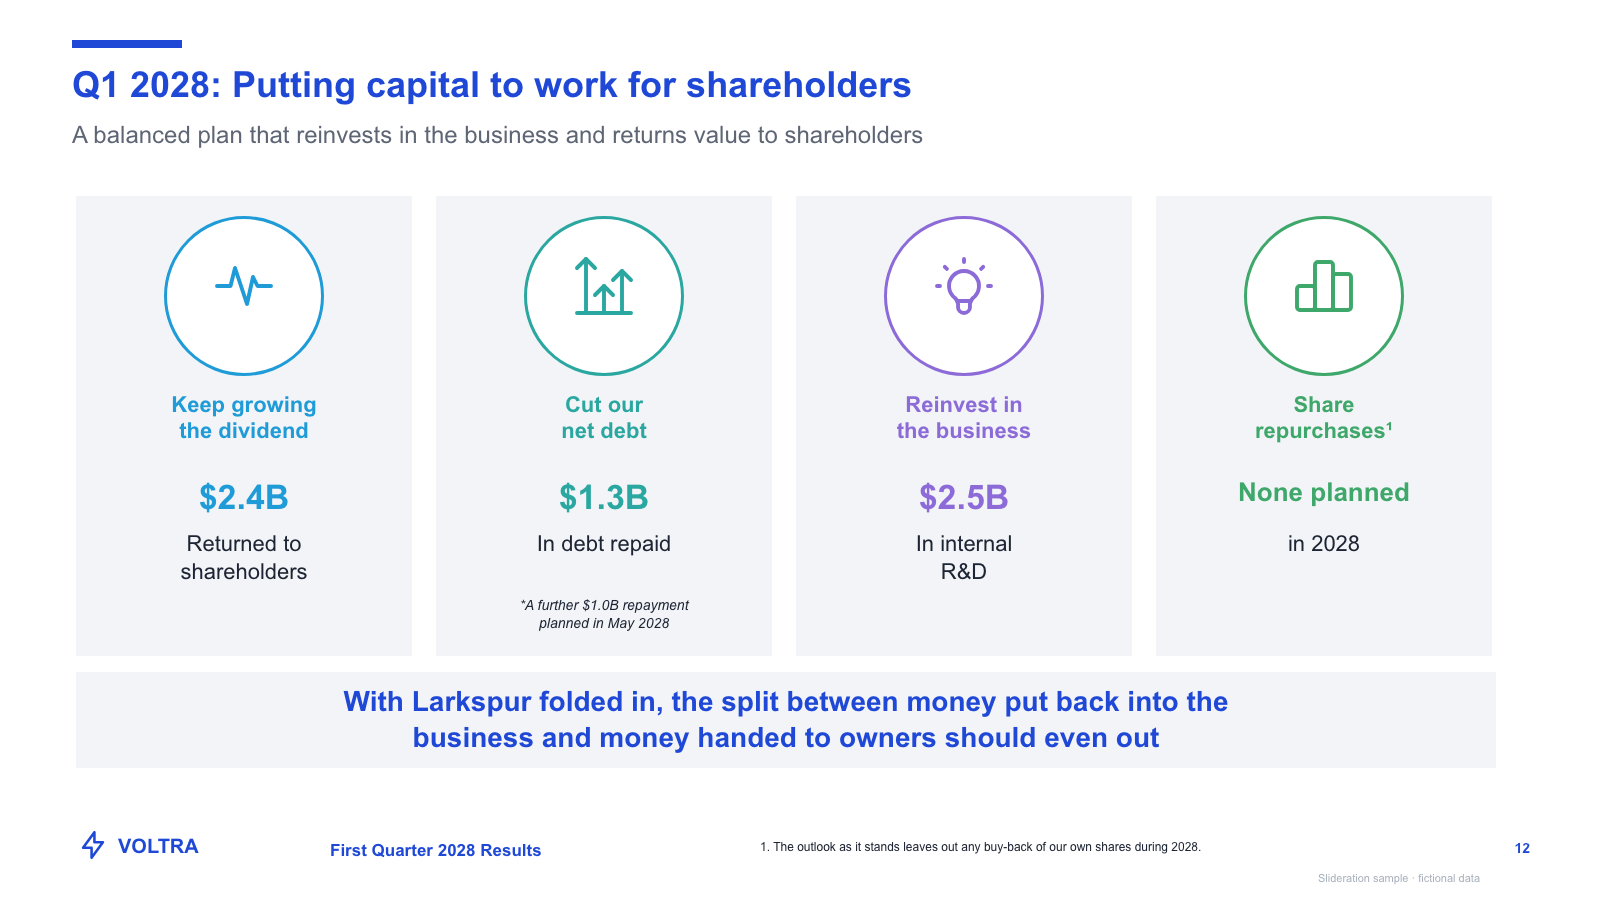
Four ringed icon cards with headline figures, a conclusion band and brand footer
1 slides · 1 credit
Check inputs & editing effort →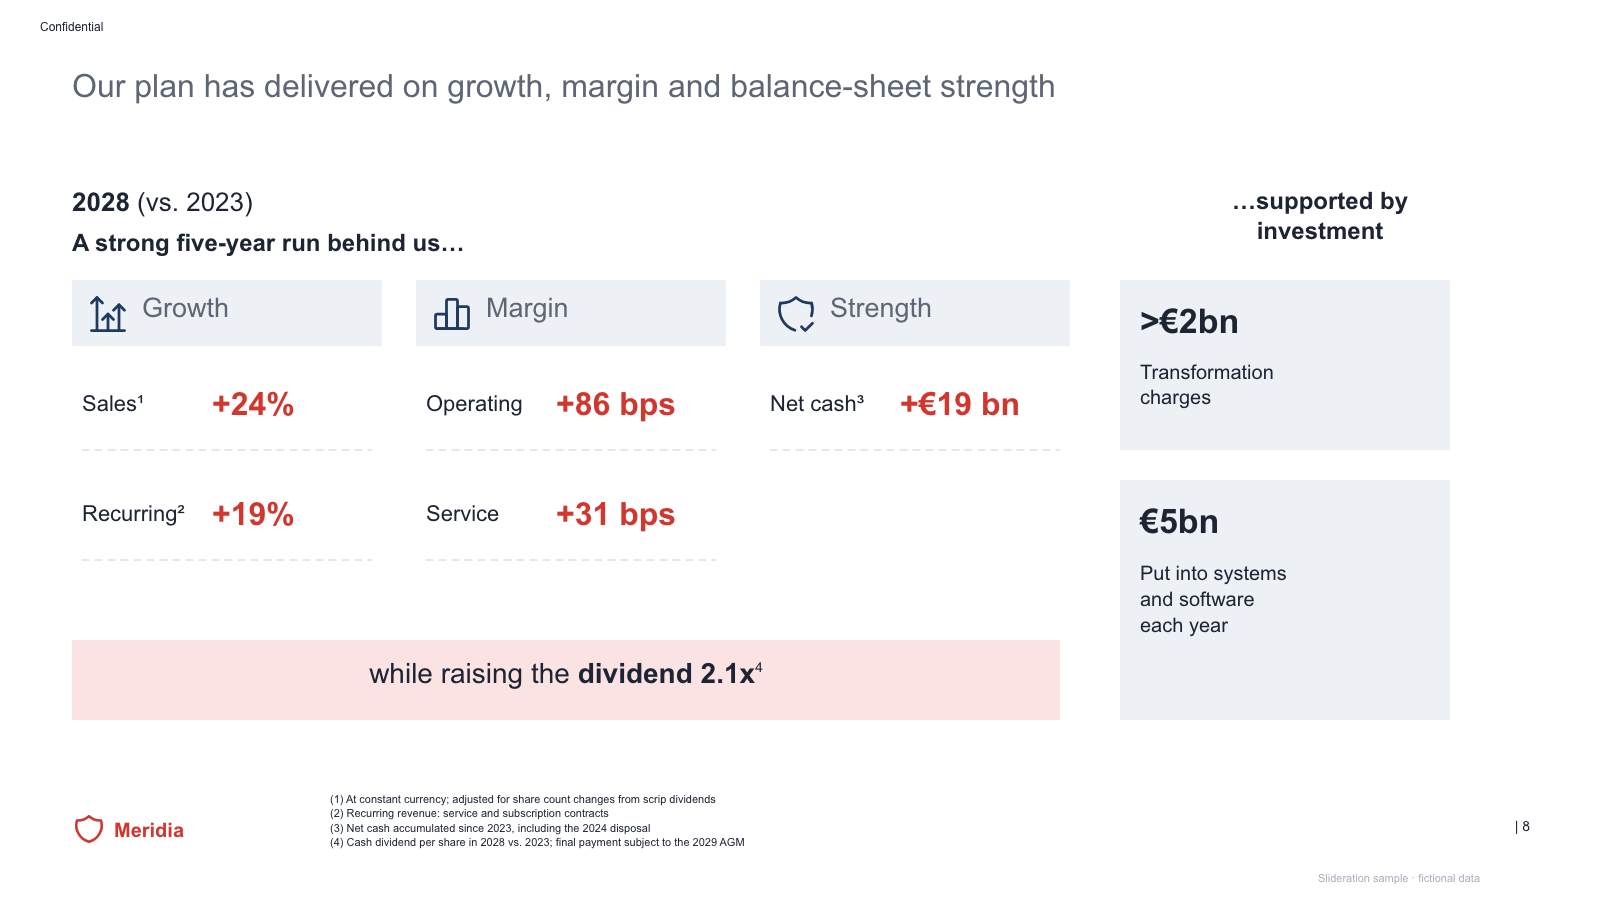
Three metric panels with icon headers and red figures, a highlight bar and two investment boxes
1 slides · 1 credit
Check inputs & editing effort →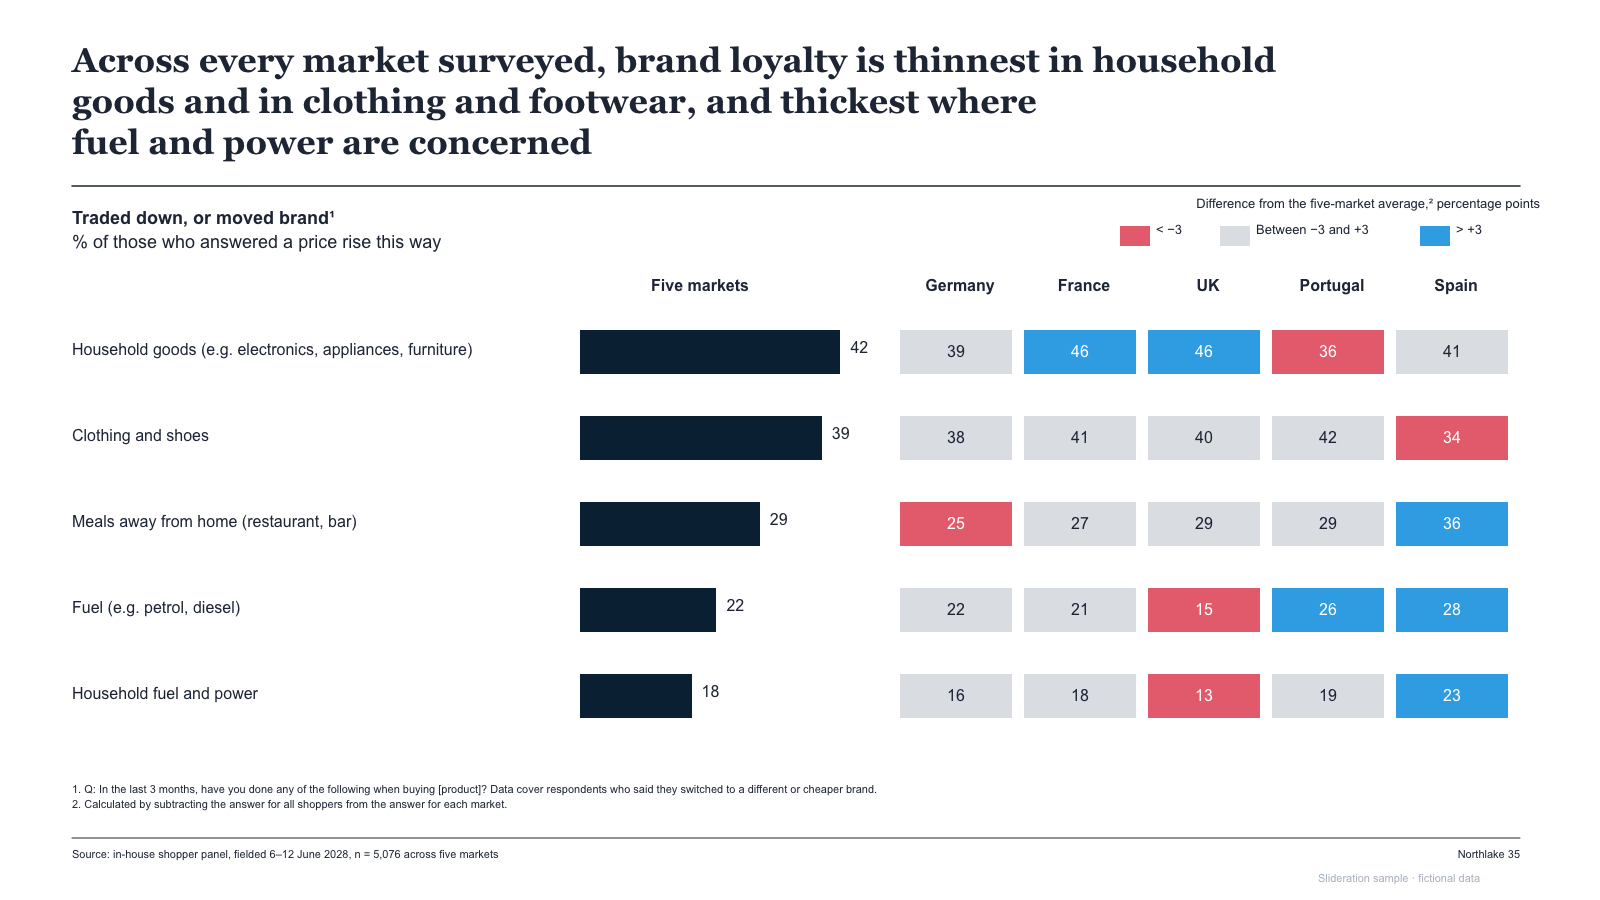
Ranked bar column plus a grid of country cells colour-coded against the regional benchmark
1 slides · 1 credit
Check inputs & editing effort →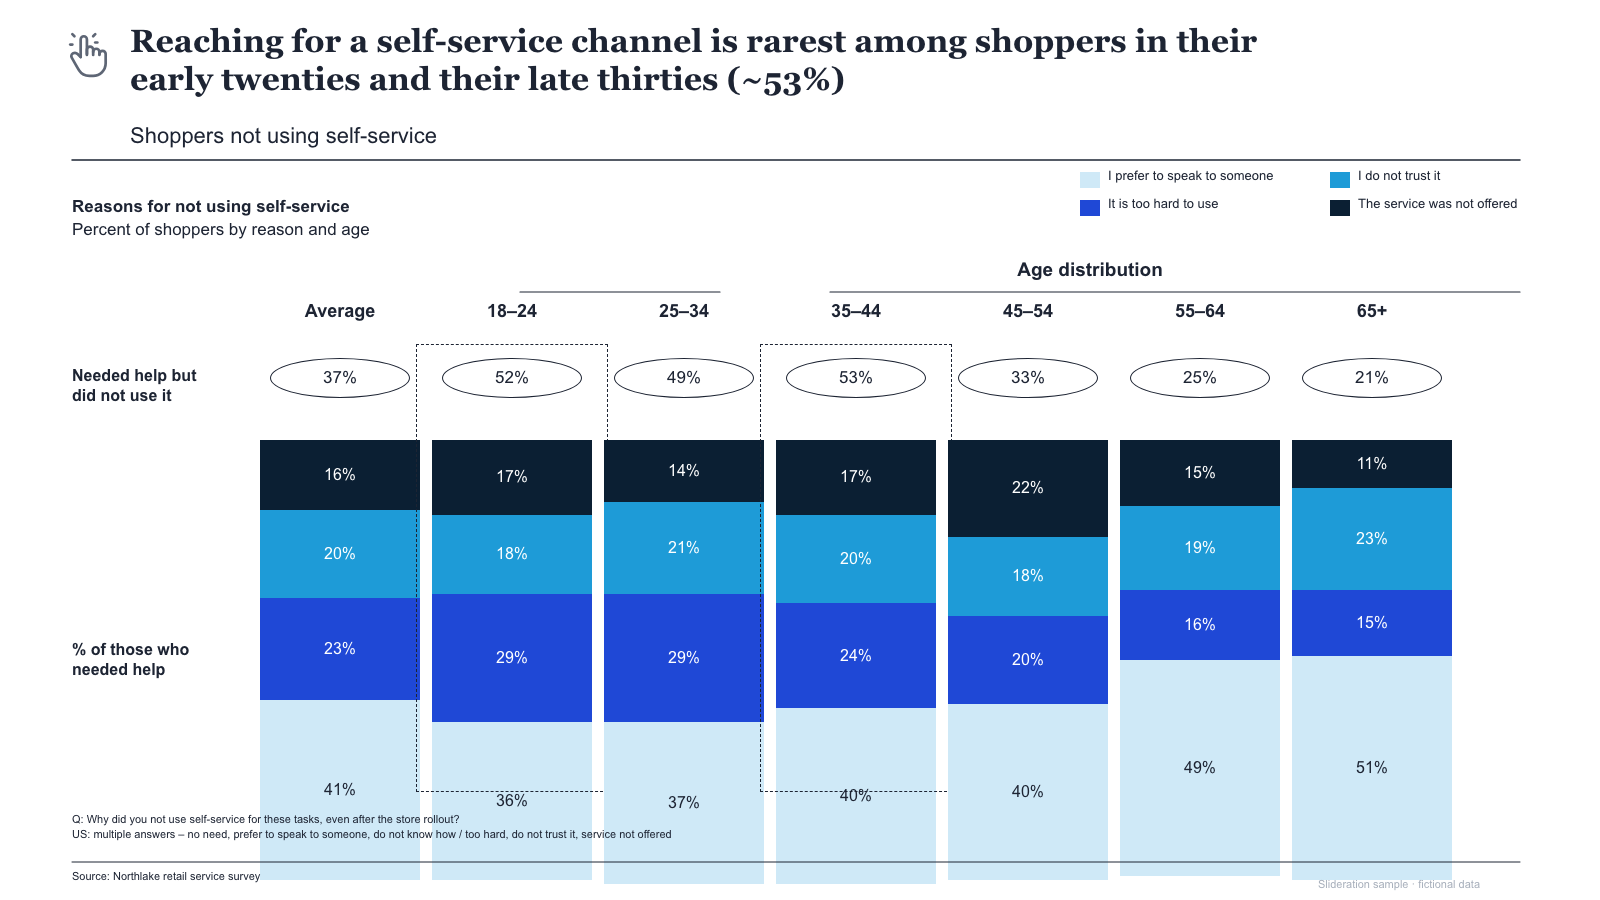
Stacked reason columns by age band with highlight boxes, pill row and four-part legend
1 slides · 1 credit
Check inputs & editing effort →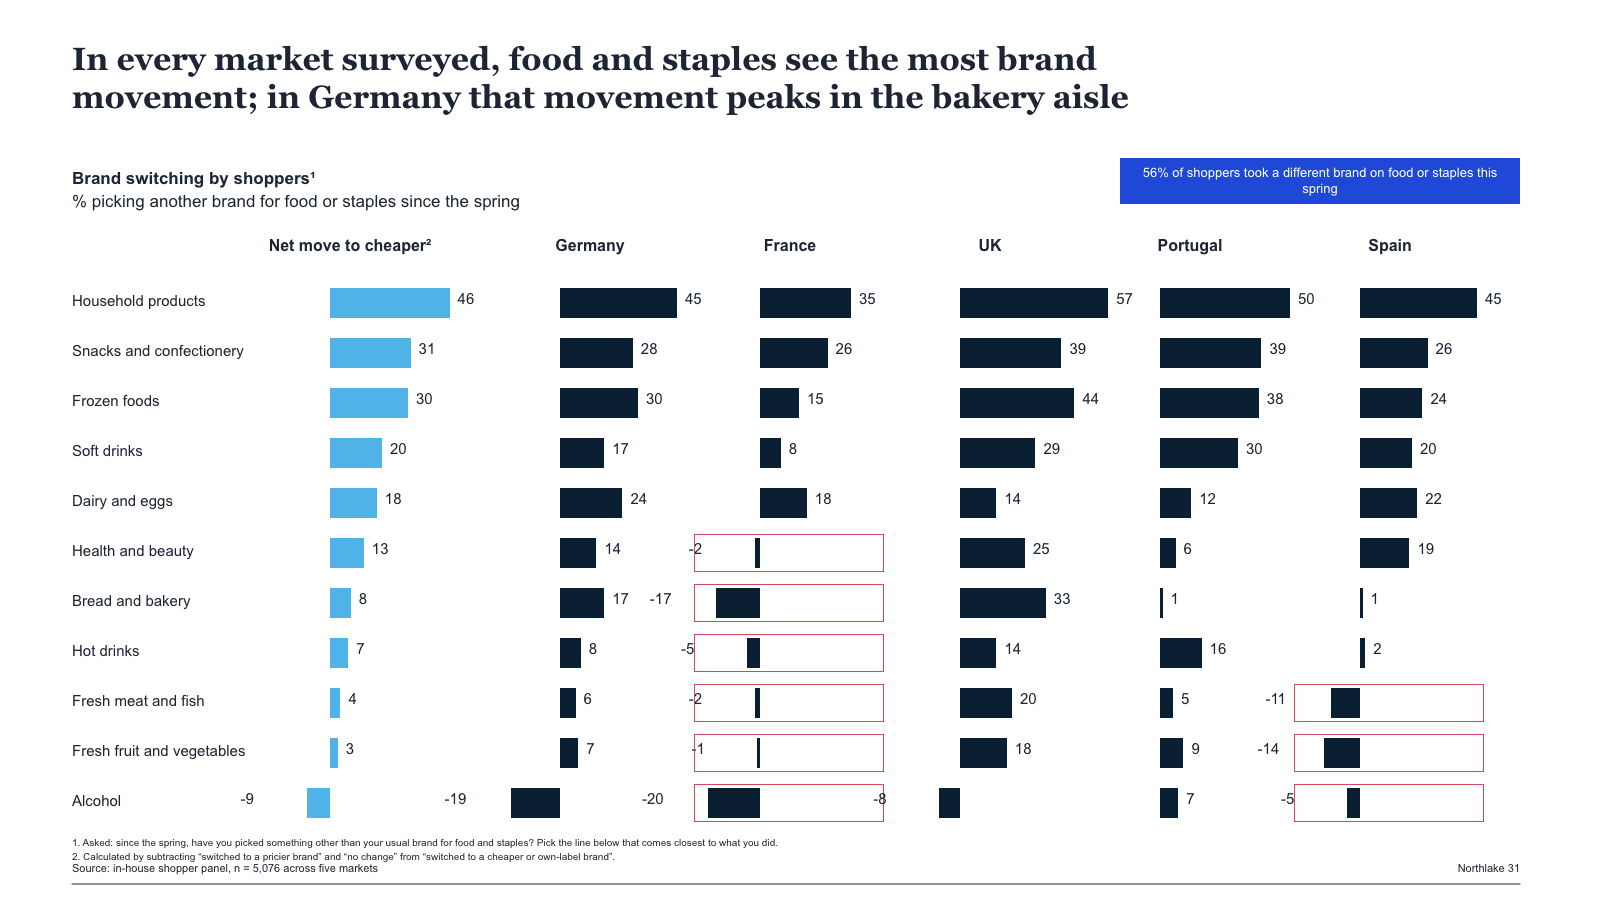
Category rows with a net bar column and five market bar cells, with highlight frames
1 slides · 1 credit
Check inputs & editing effort →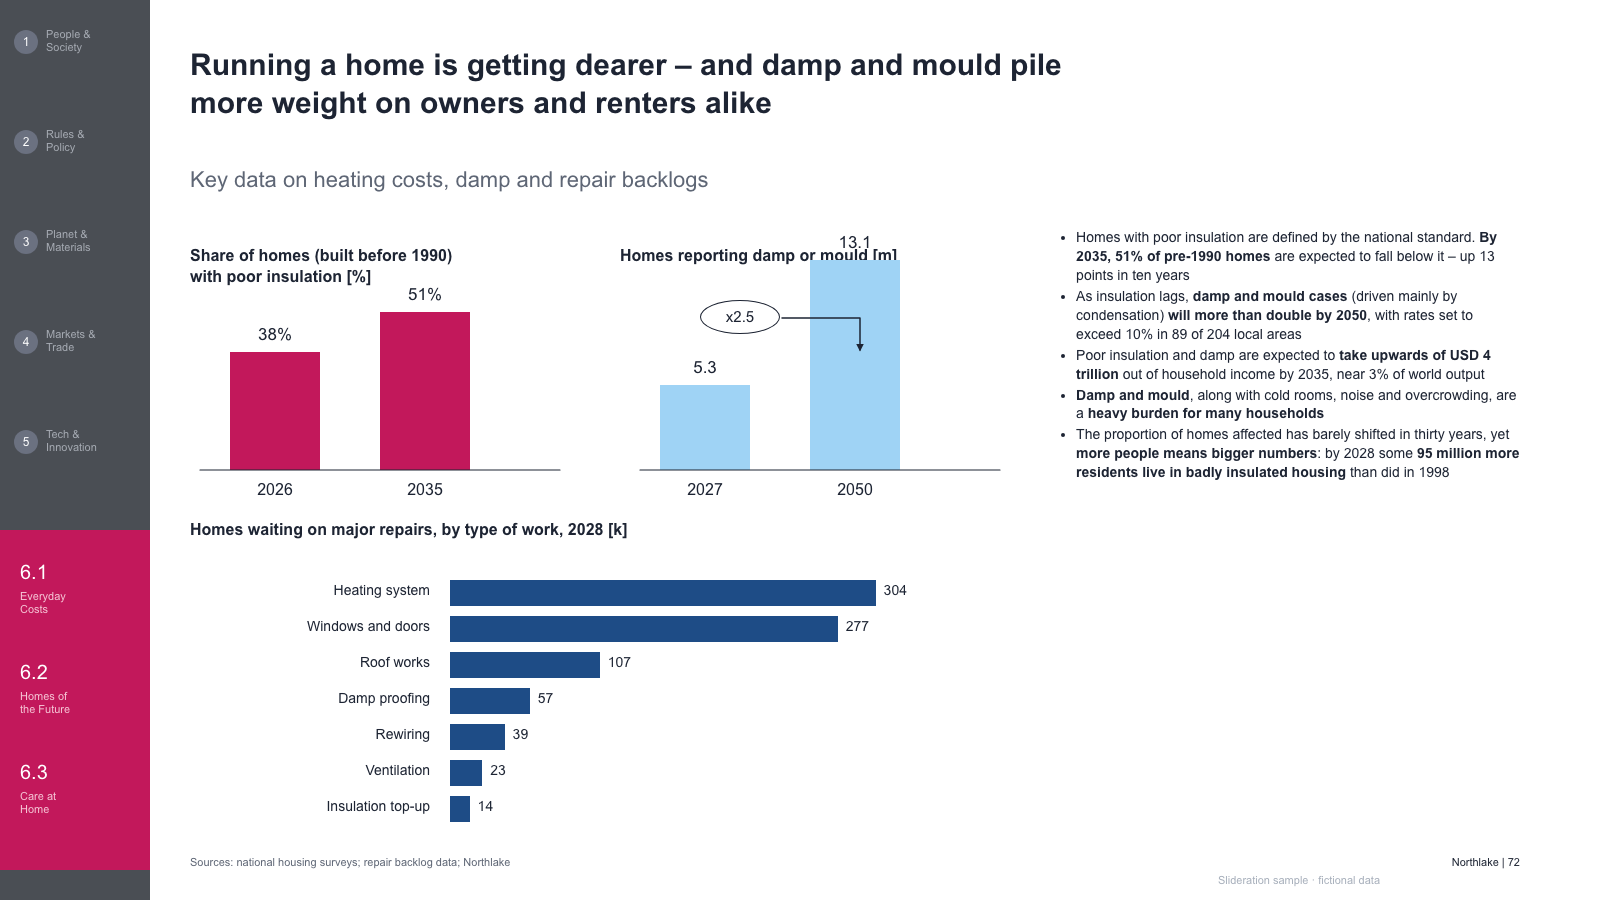
Rail plus three small charts (two bar pairs and a ranked bar list) with a bullet commentary column
1 slides · 1 credit
Check inputs & editing effort →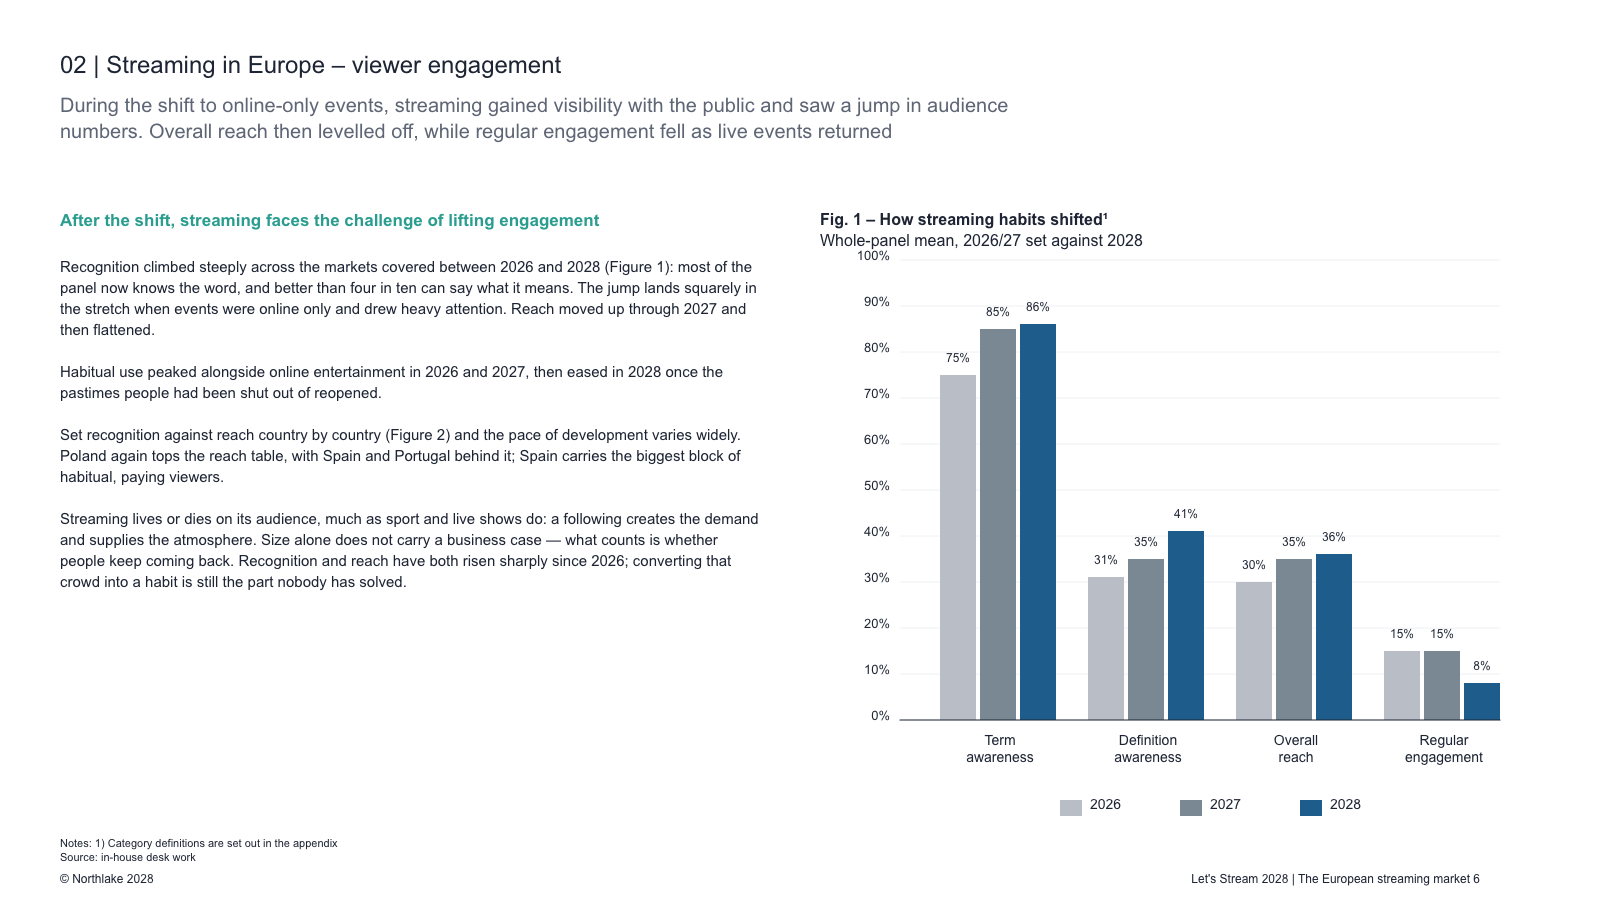
Intro paragraphs beside a grouped bar chart of three yearly series with a legend
1 slides · 1 credit
Check inputs & editing effort →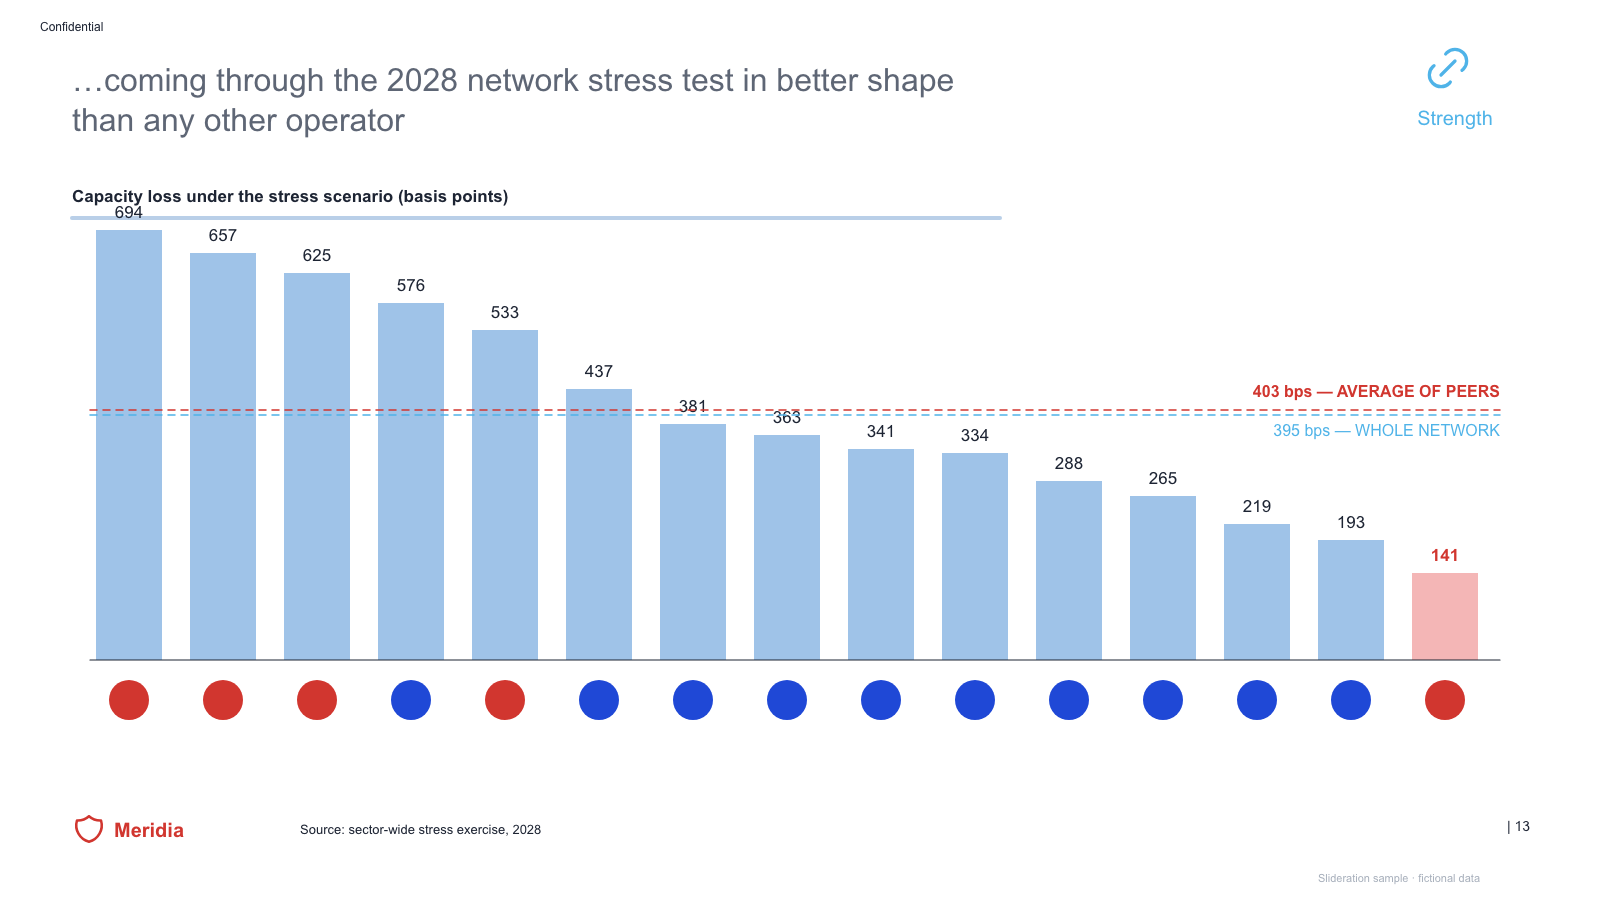
Ranked bar chart of peers with two reference lines, flag row and one highlighted bar
1 slides · 1 credit
Check inputs & editing effort →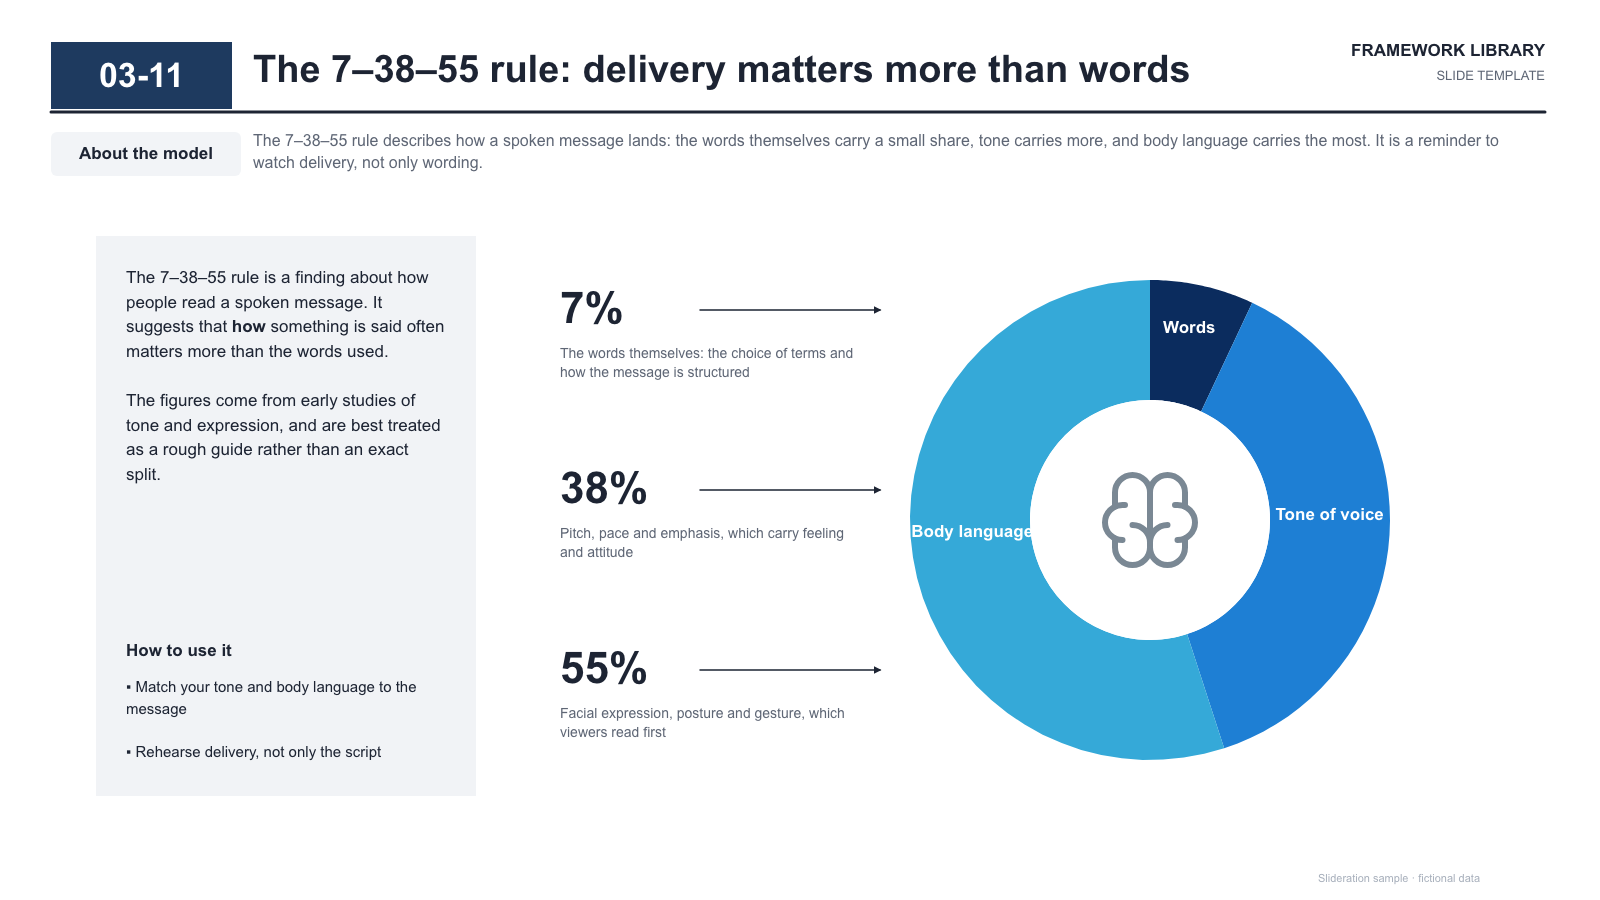
Explanatory text panel beside a three-segment donut with outside percentage callouts
1 slides · 1 credit
Check inputs & editing effort →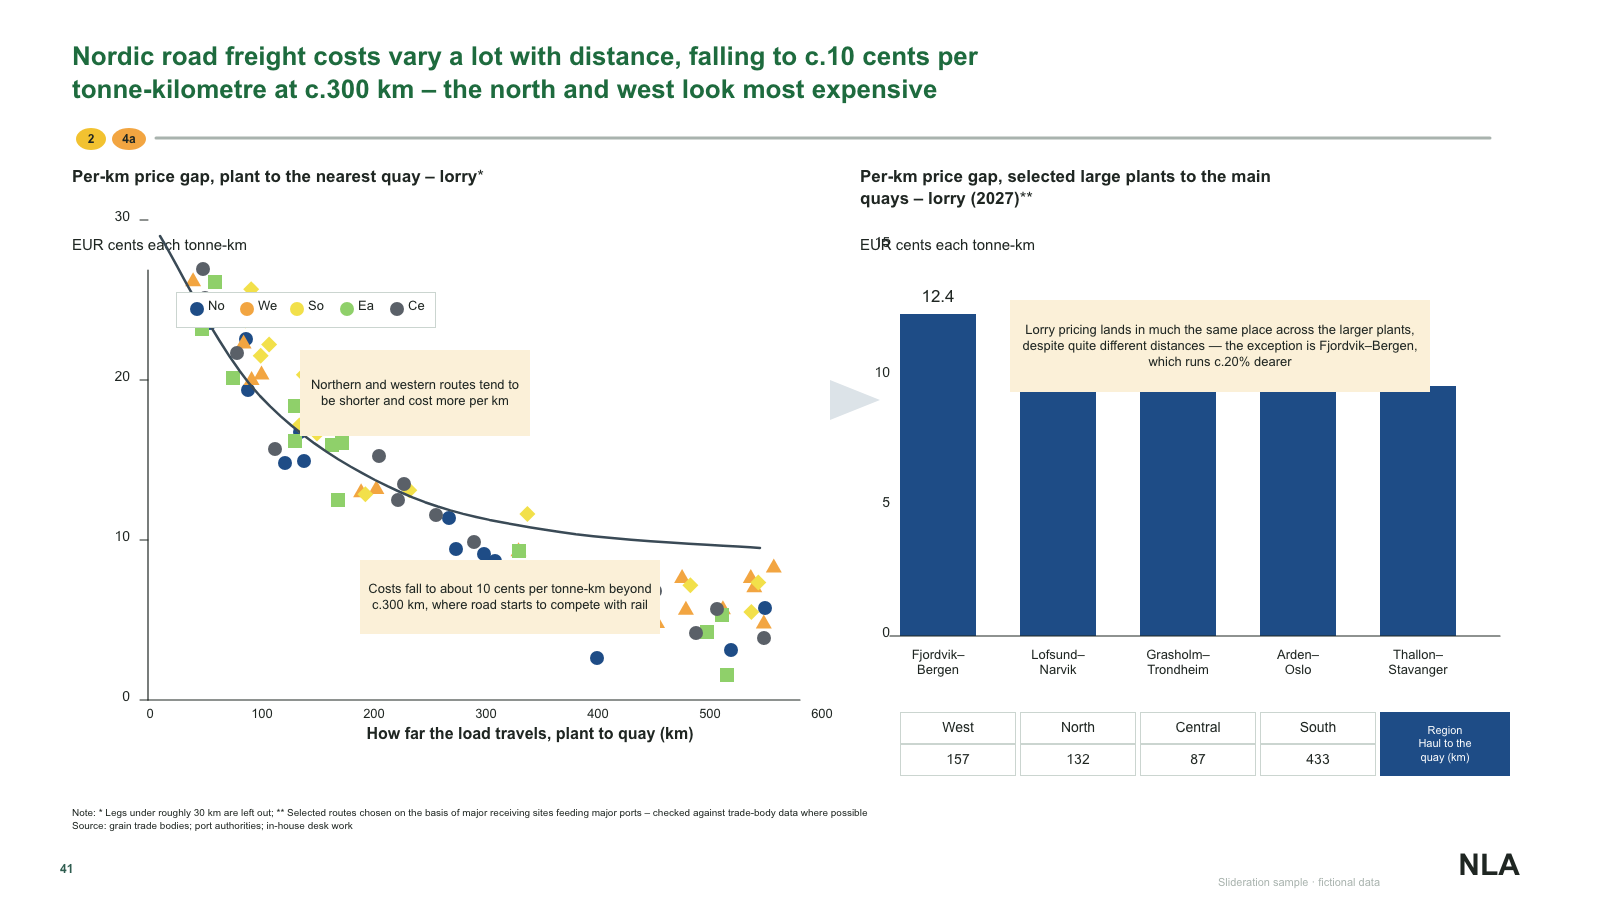
Scatter chart with trend line and callouts beside a ranked bar chart and a route table
1 slides · 1 credit
Check inputs & editing effort →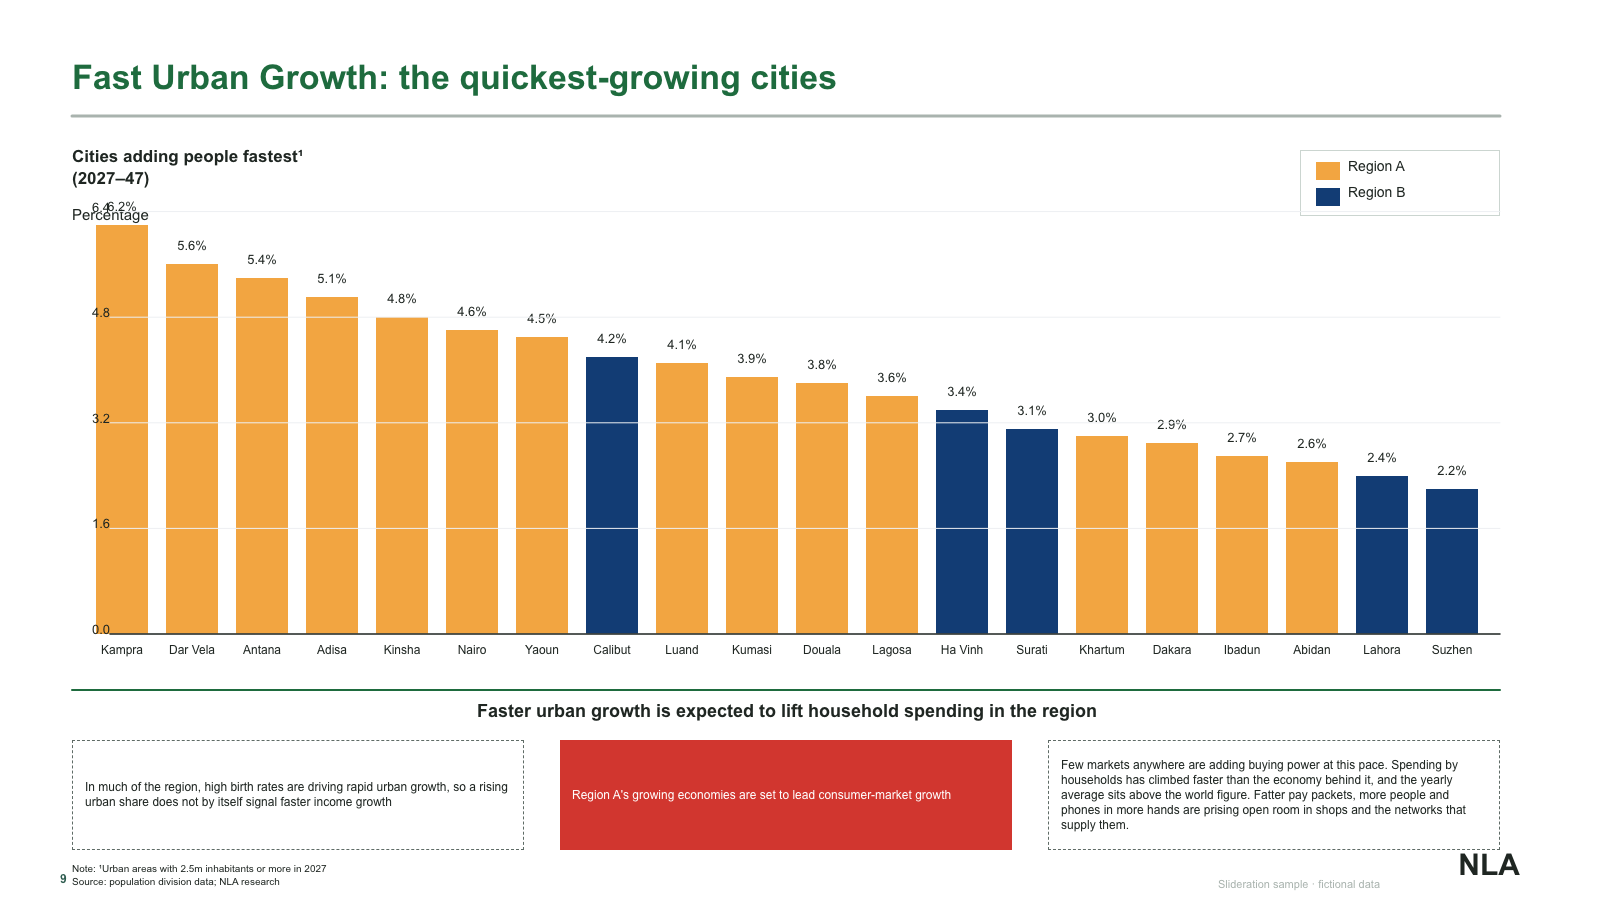
Ranked city growth bars with two-colour legend and three boxed commentary tiles
1 slides · 1 credit
Check inputs & editing effort →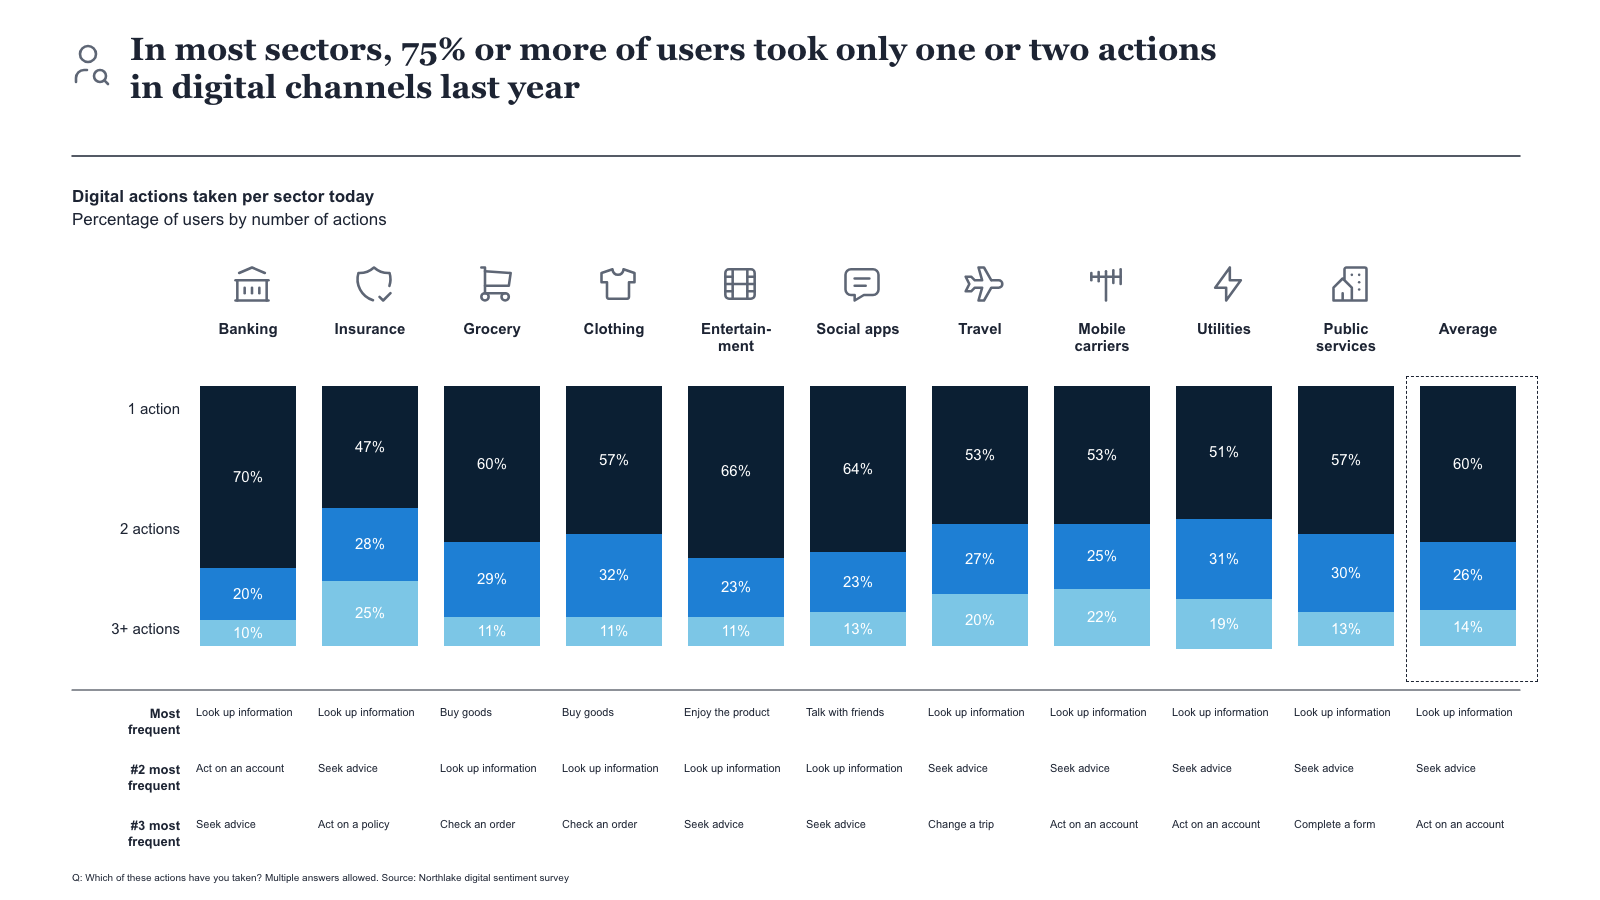
Stacked action-count columns by sector with icon headers and a three-row ranked action table
1 slides · 1 credit
Check inputs & editing effort →
Rail, two tinted quote panels with flags, a third wide quote and a right bullet column
1 slides · 1 credit
Check inputs & editing effort →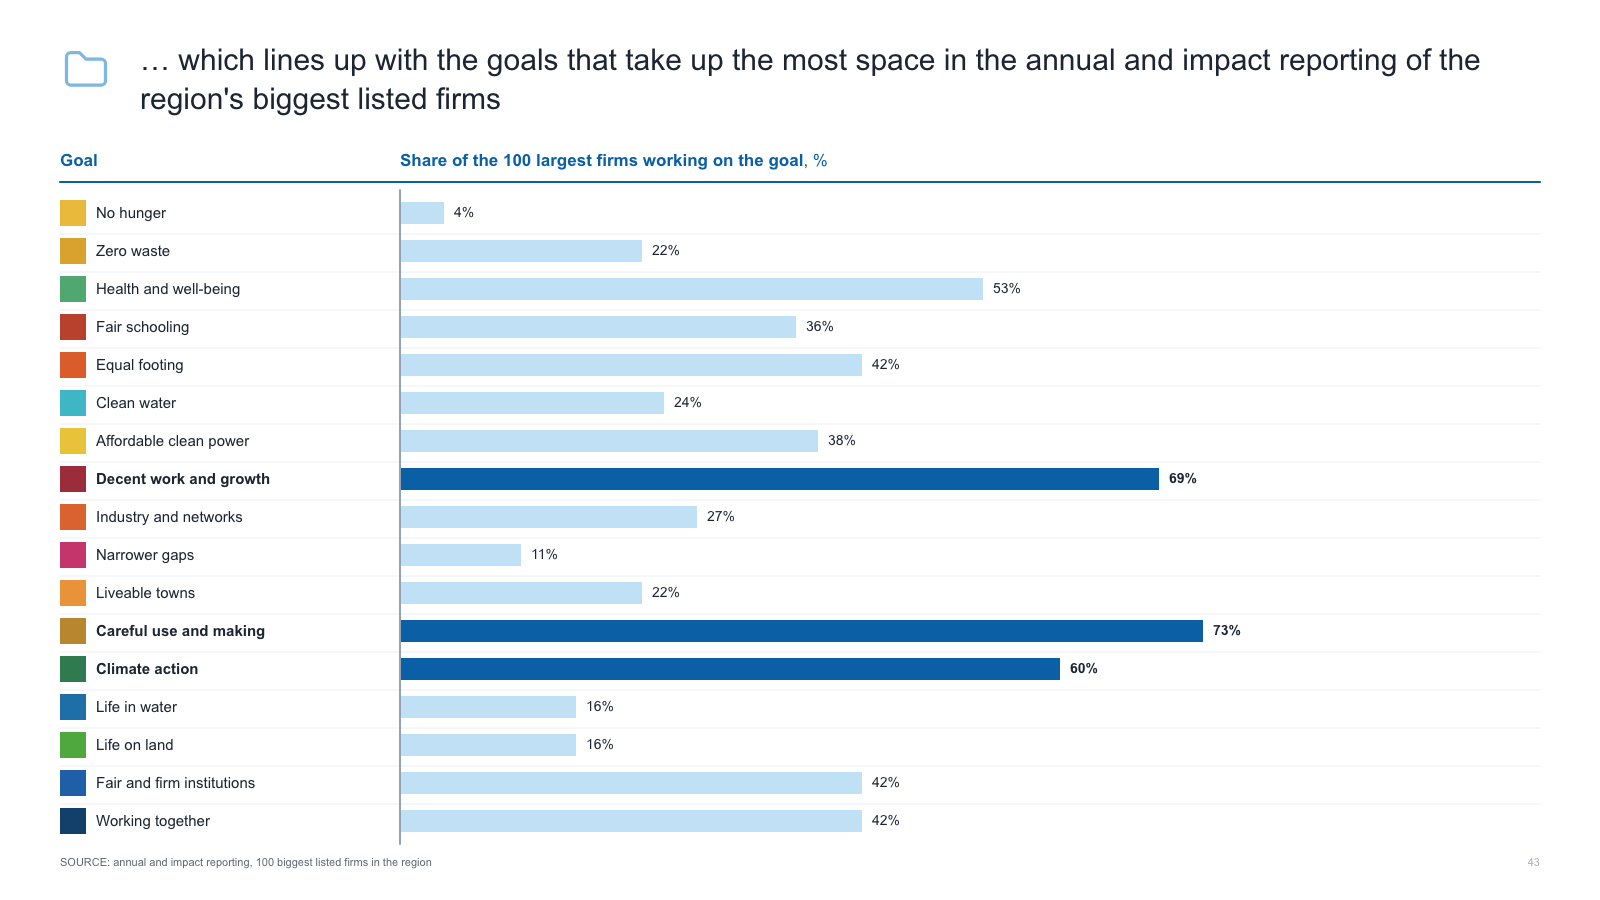
Goal rows with a coloured icon column beside labelled horizontal bars, three rows highlighted
1 slides · 1 credit
Check inputs & editing effort →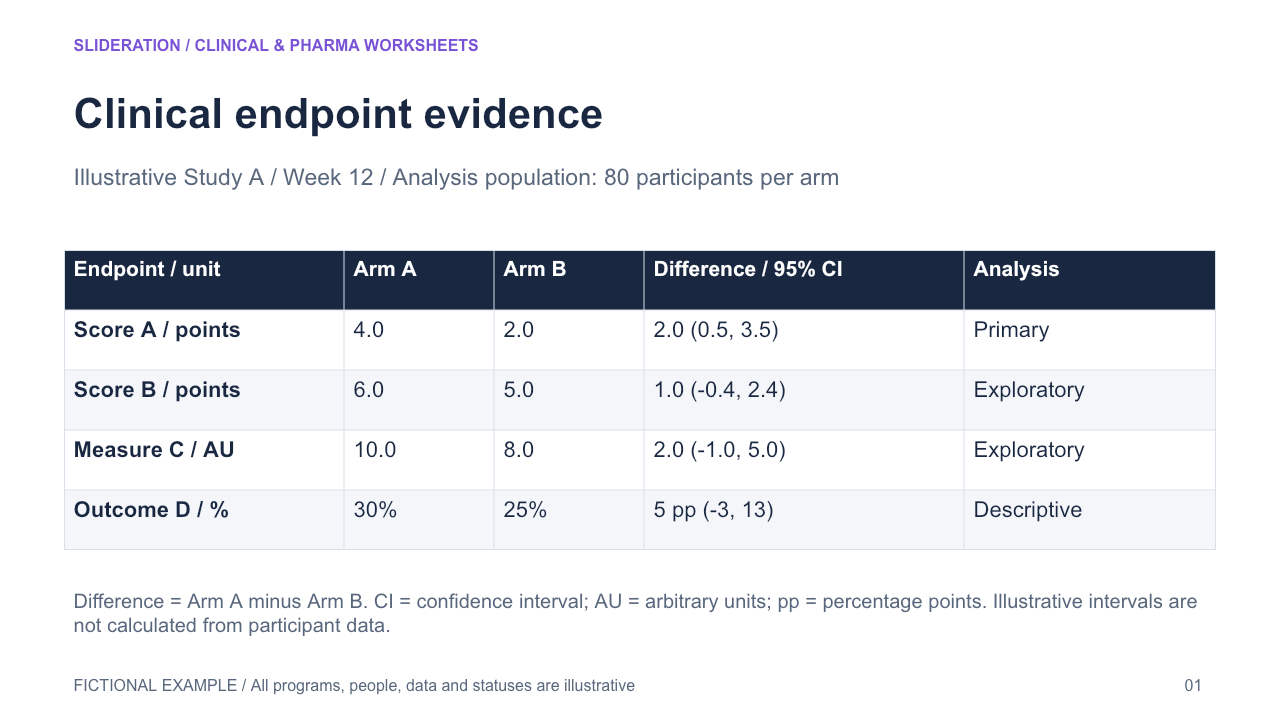
Clinical endpoint evidence — Endpoint, unit, analysis population, timepoint, estimate and interval stay associated in each row
2 slides · 1 credit
Check inputs & editing effort →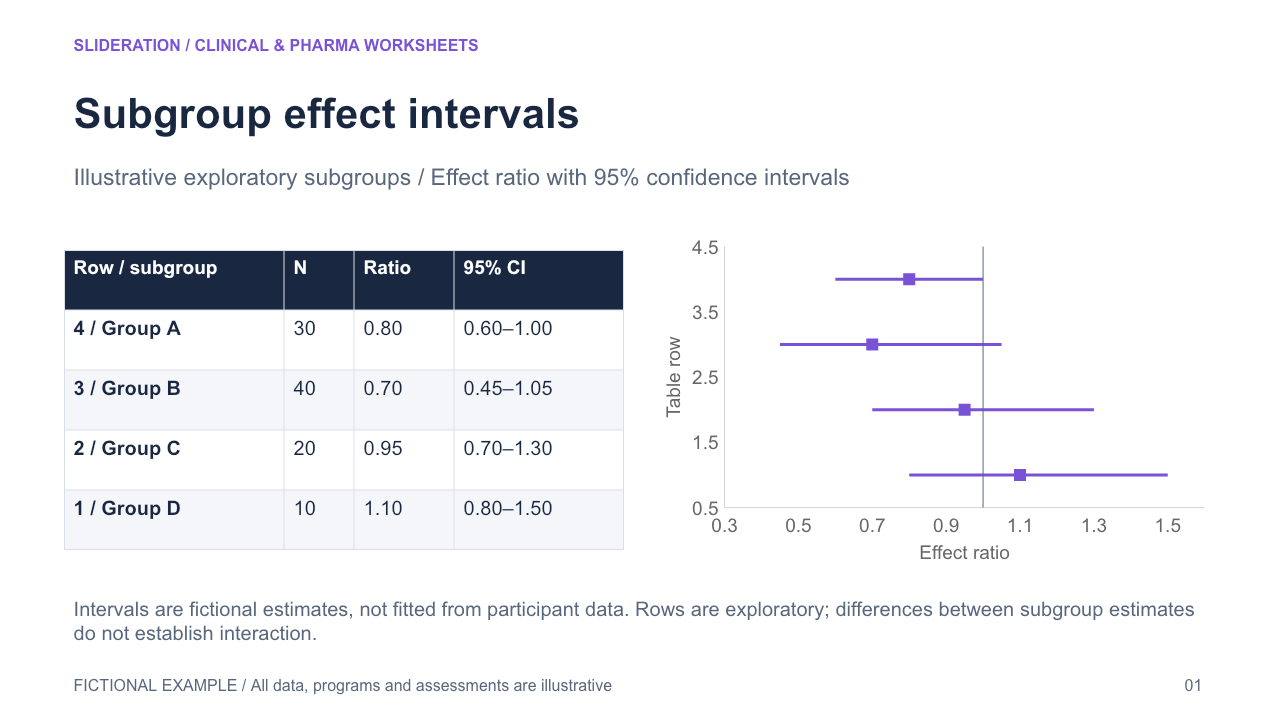
Subgroup effect intervals — Subgroup sample size, effect estimate and confidence interval share one axis and reference value
2 slides · 1 credit
Check inputs & editing effort →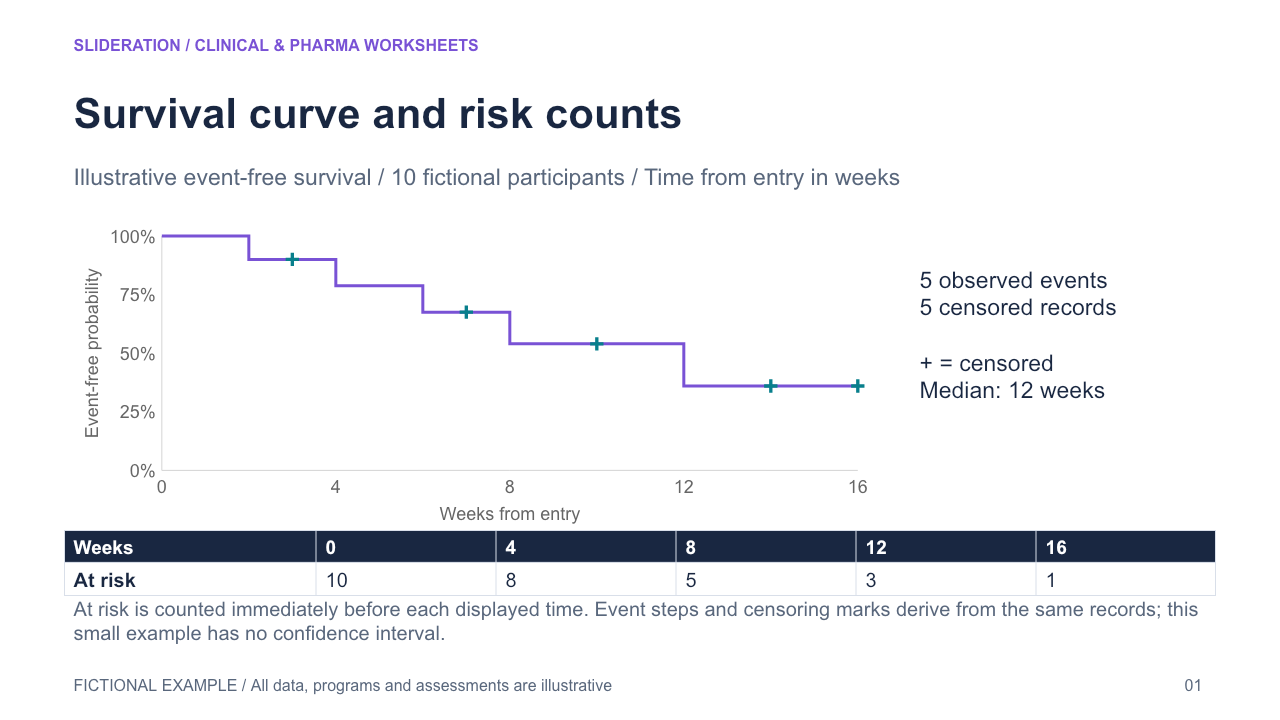
Survival curve and risk counts — Event-time step function, censoring and numbers at risk are derived from the same individual records
2 slides · 1 credit
Check inputs & editing effort →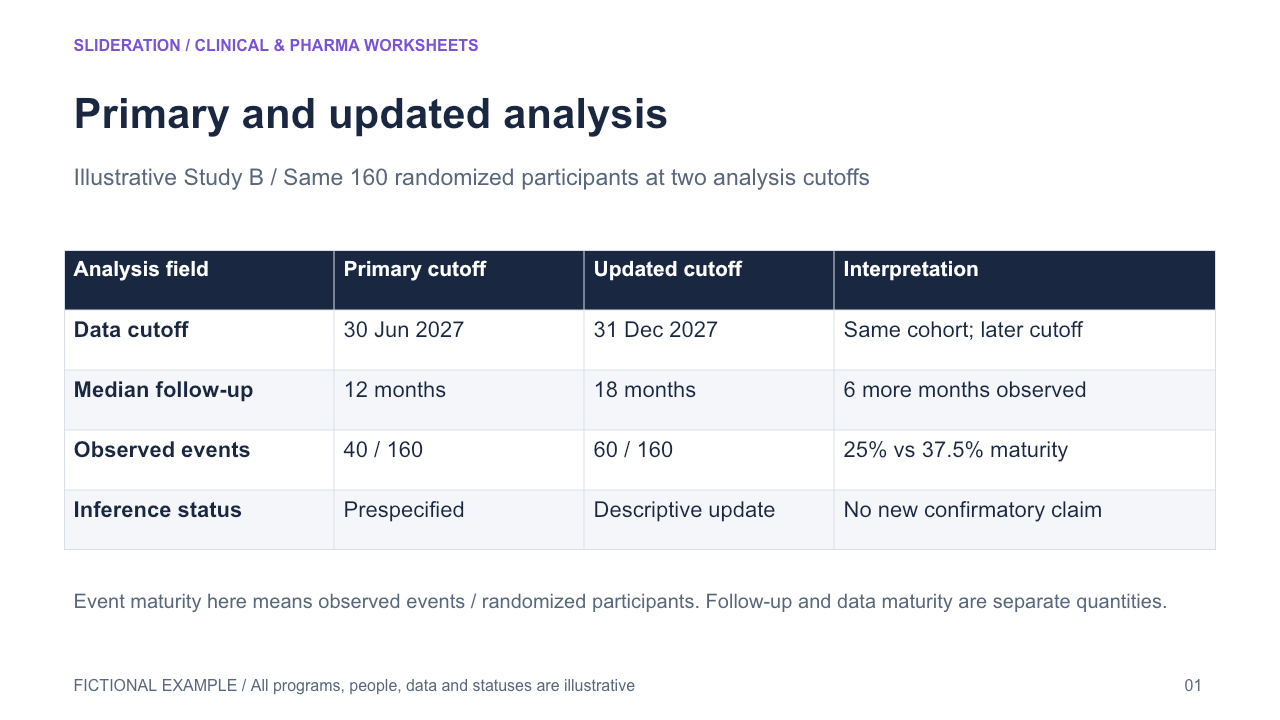
Primary and updated analysis — Same cohort compared across cutoffs with follow-up, maturity and inference status
2 slides · 1 credit
Check inputs & editing effort →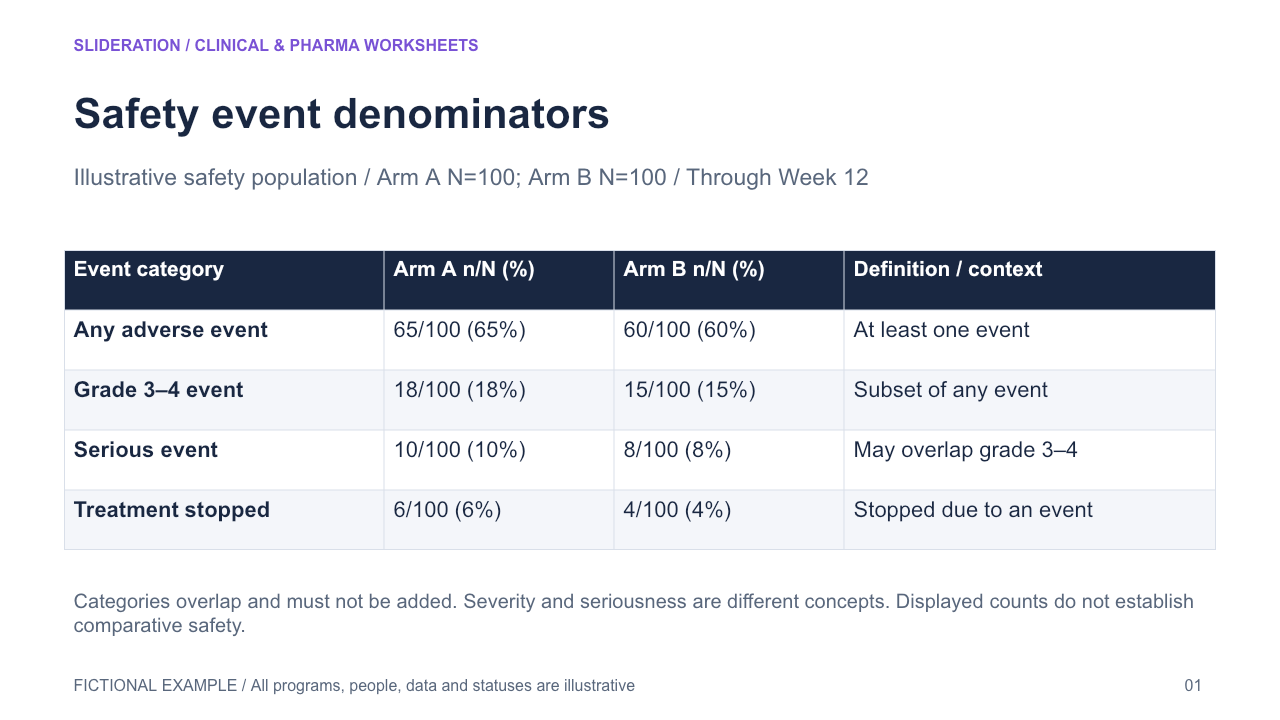
Safety event denominators — Hierarchical event definitions linked to each arm's exposed population and n/N
2 slides · 1 credit
Check inputs & editing effort →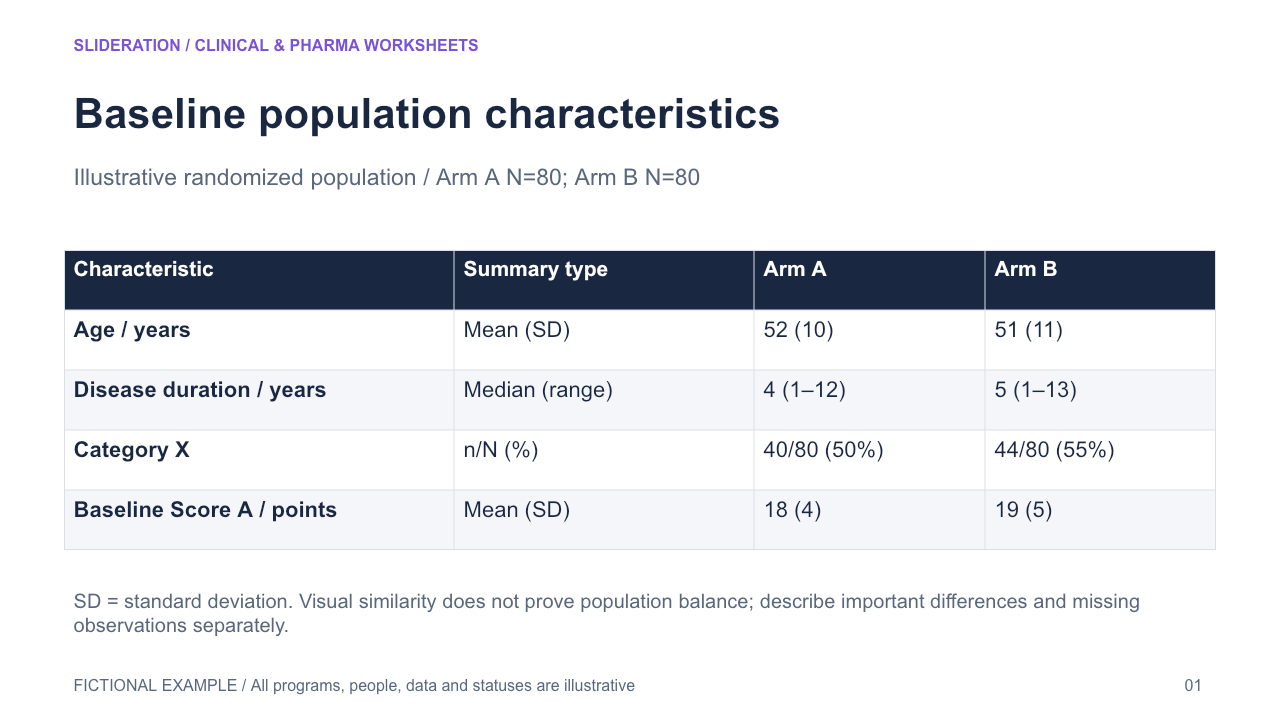
Baseline population characteristics — Variable definition and summary type paired with arm-specific sample sizes
2 slides · 1 credit
Check inputs & editing effort →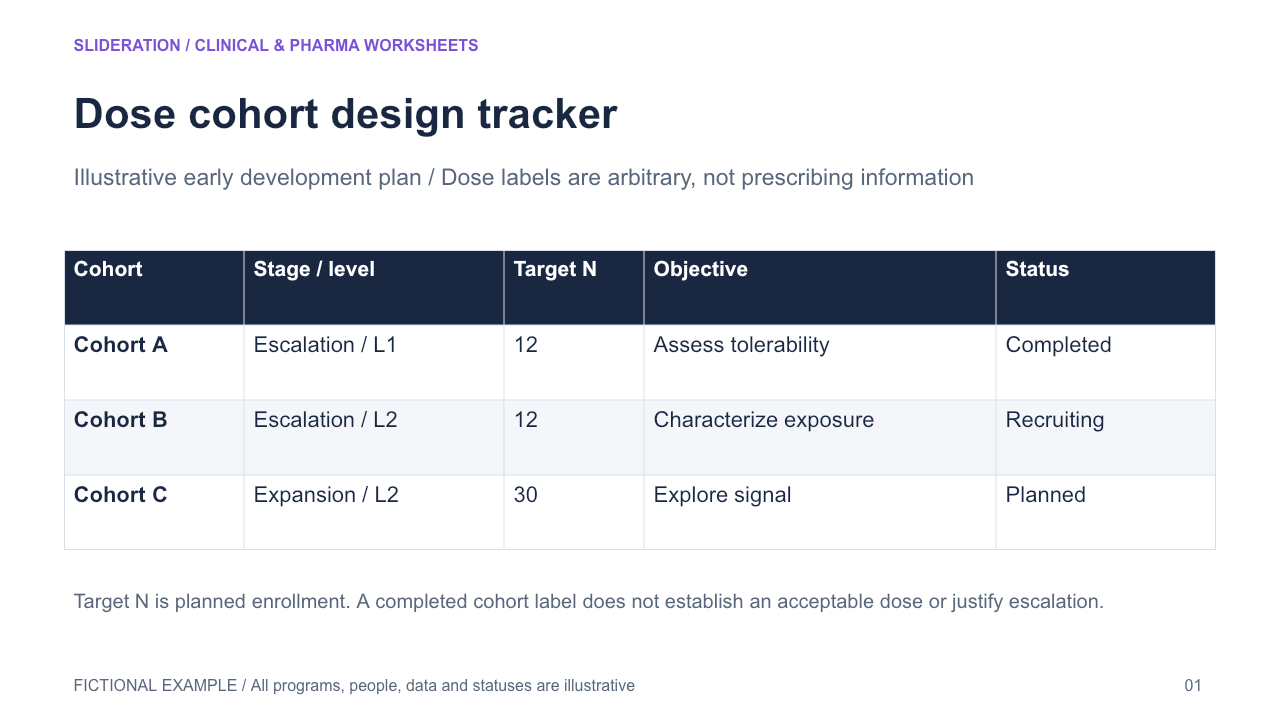
Dose cohort design tracker — Cohort stage, planned dose level, target enrollment, objective and status
2 slides · 1 credit
Check inputs & editing effort →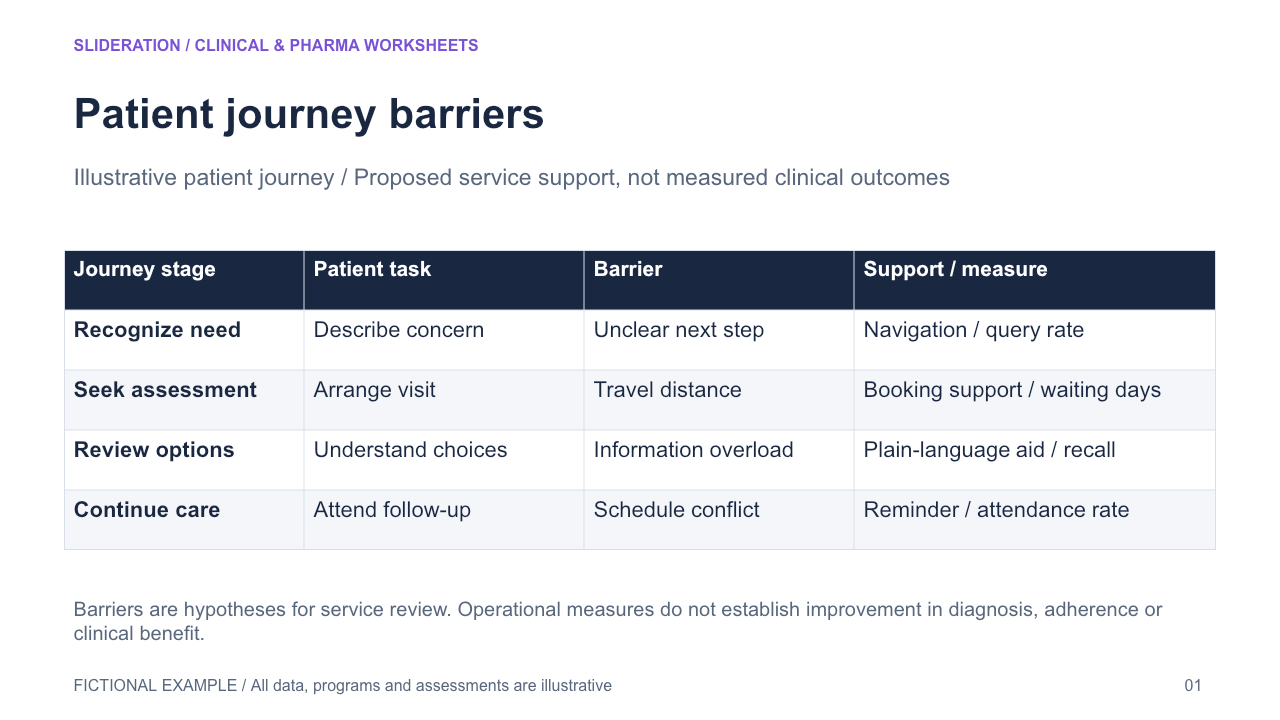
Patient journey barriers — Each journey stage links patient task, barrier, support and operational measure
2 slides · 1 credit
Check inputs & editing effort →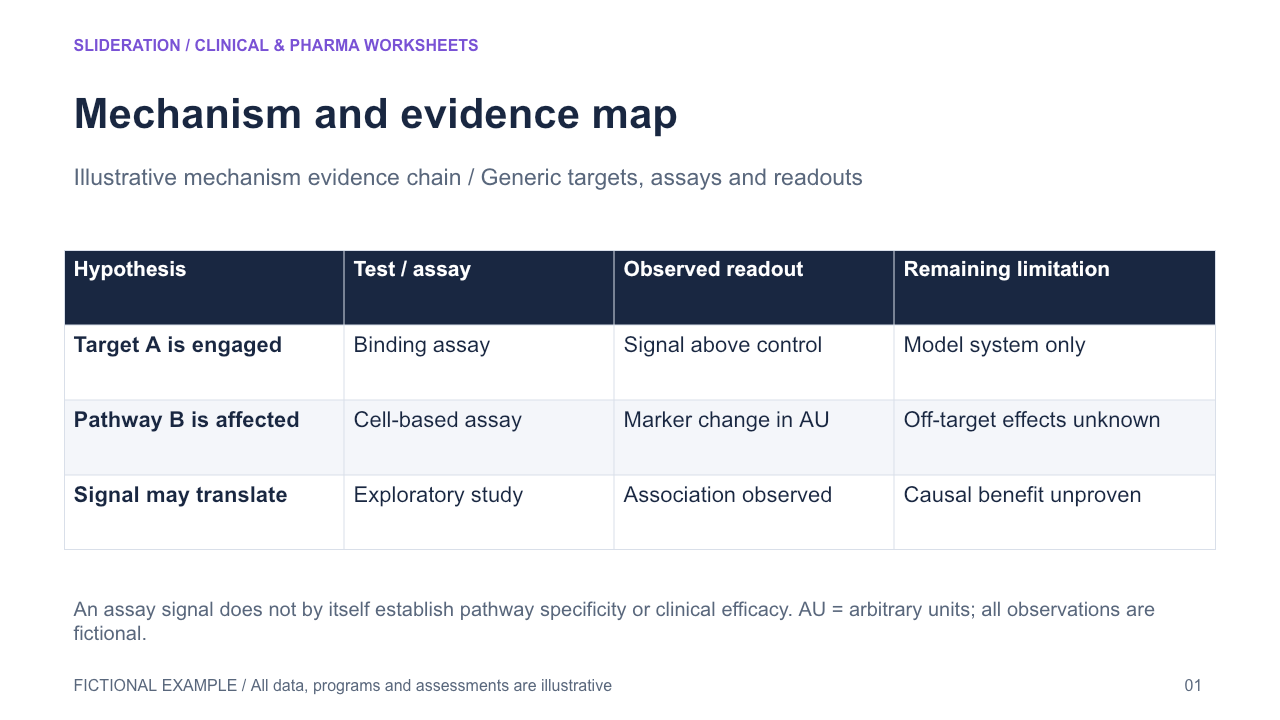
Mechanism and evidence map — Mechanistic hypothesis links assay, observed readout and remaining limitation
2 slides · 1 credit
Check inputs & editing effort →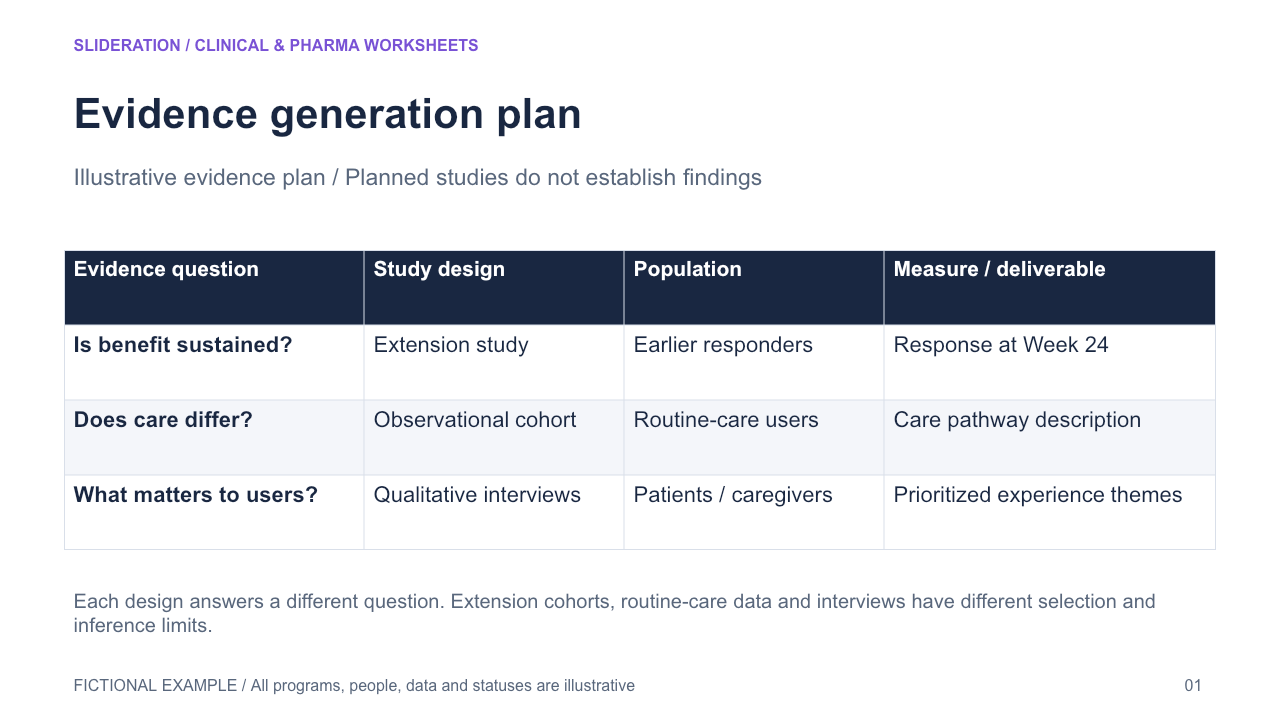
Evidence generation plan — Evidence question linked to study design, population, measure and deliverable
2 slides · 1 credit
Check inputs & editing effort →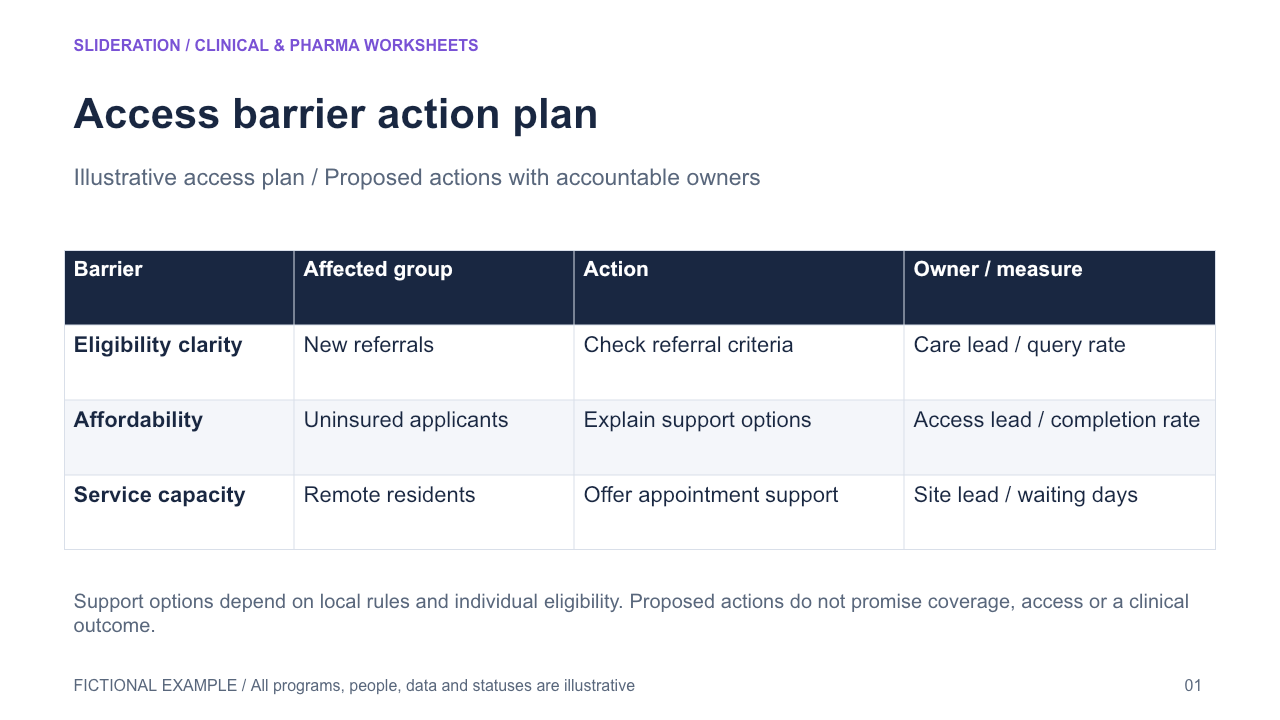
Access barrier action plan — Barrier and affected population linked to action, accountable owner and measure
2 slides · 1 credit
Check inputs & editing effort →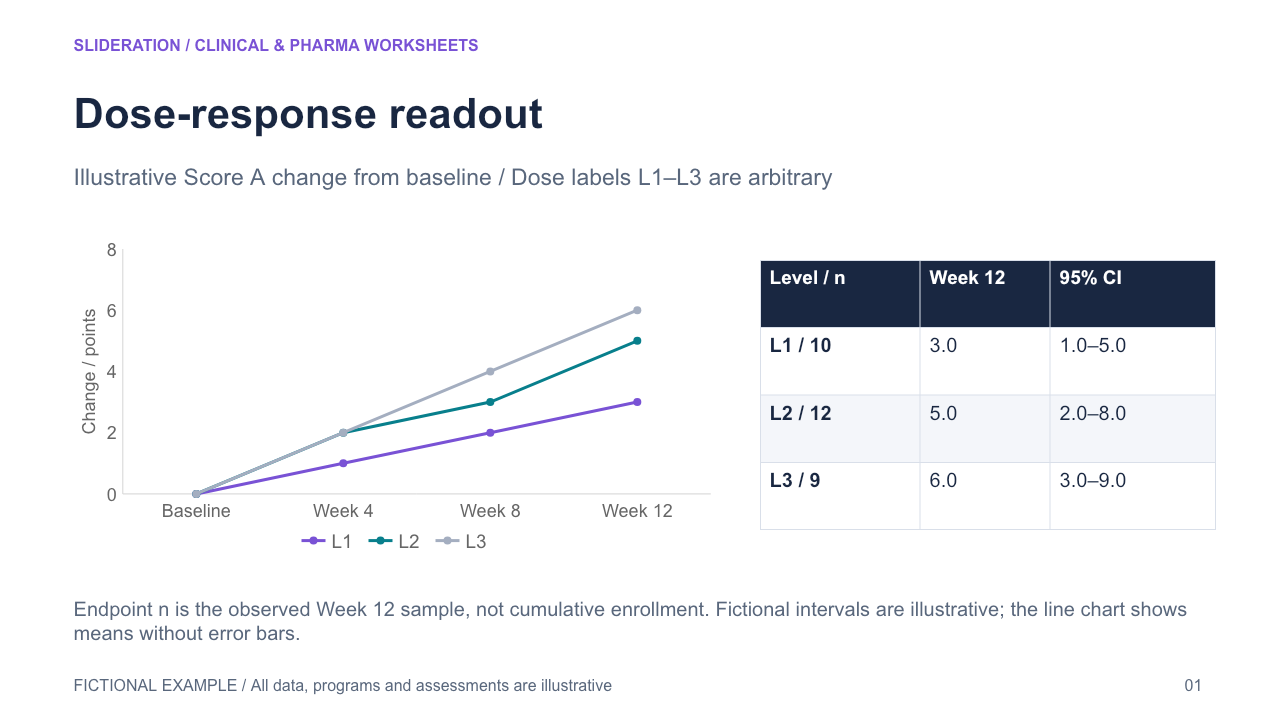
Dose-response readout — Trajectory by fictional dose with endpoint estimate, interval and observed n
2 slides · 1 credit
Check inputs & editing effort →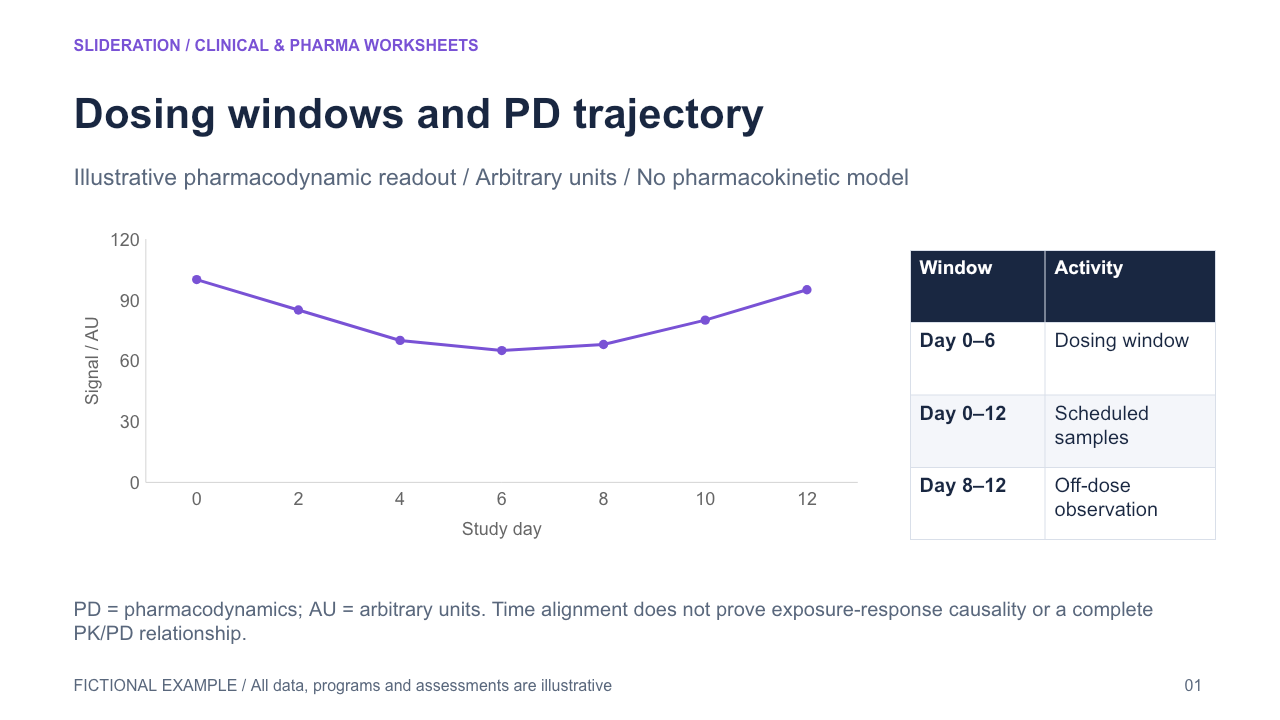
Dosing windows and PD trajectory — Observed pharmacodynamic trajectory aligned with dose and sampling windows
2 slides · 1 credit
Check inputs & editing effort →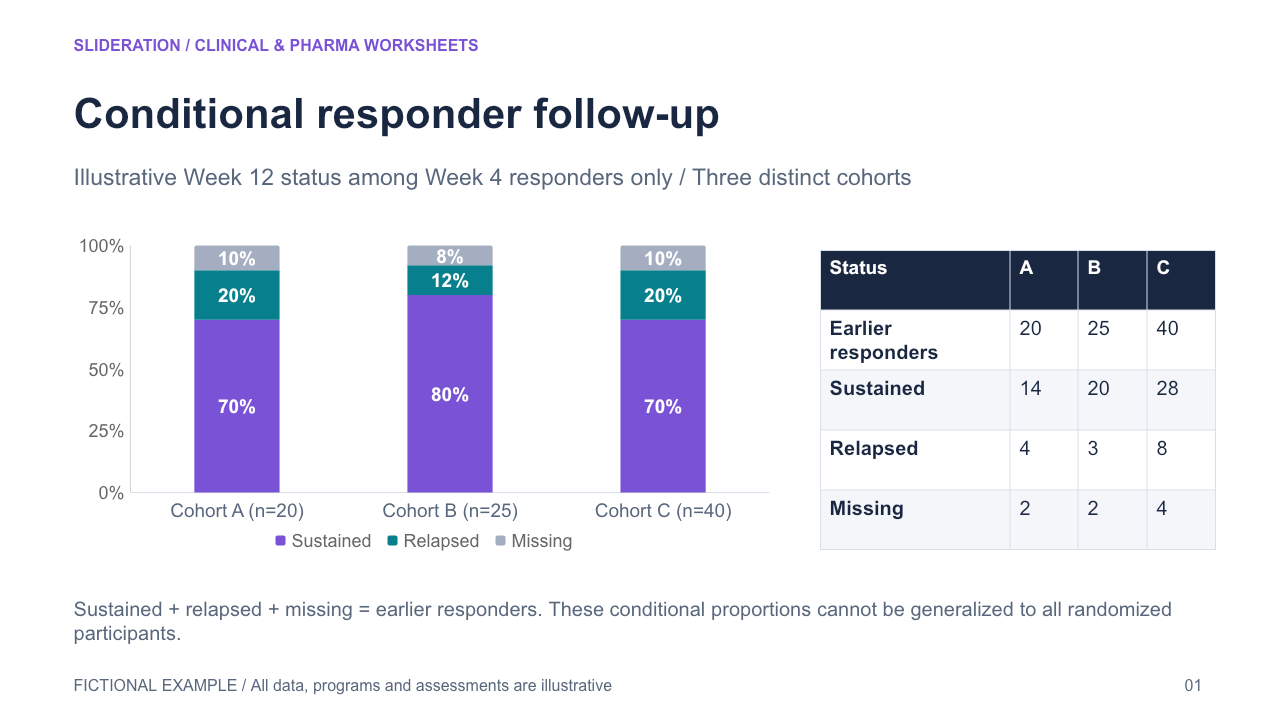
Conditional responder follow-up — Sustained, relapsed and missing outcomes partition the earlier responder cohort
2 slides · 1 credit
Check inputs & editing effort →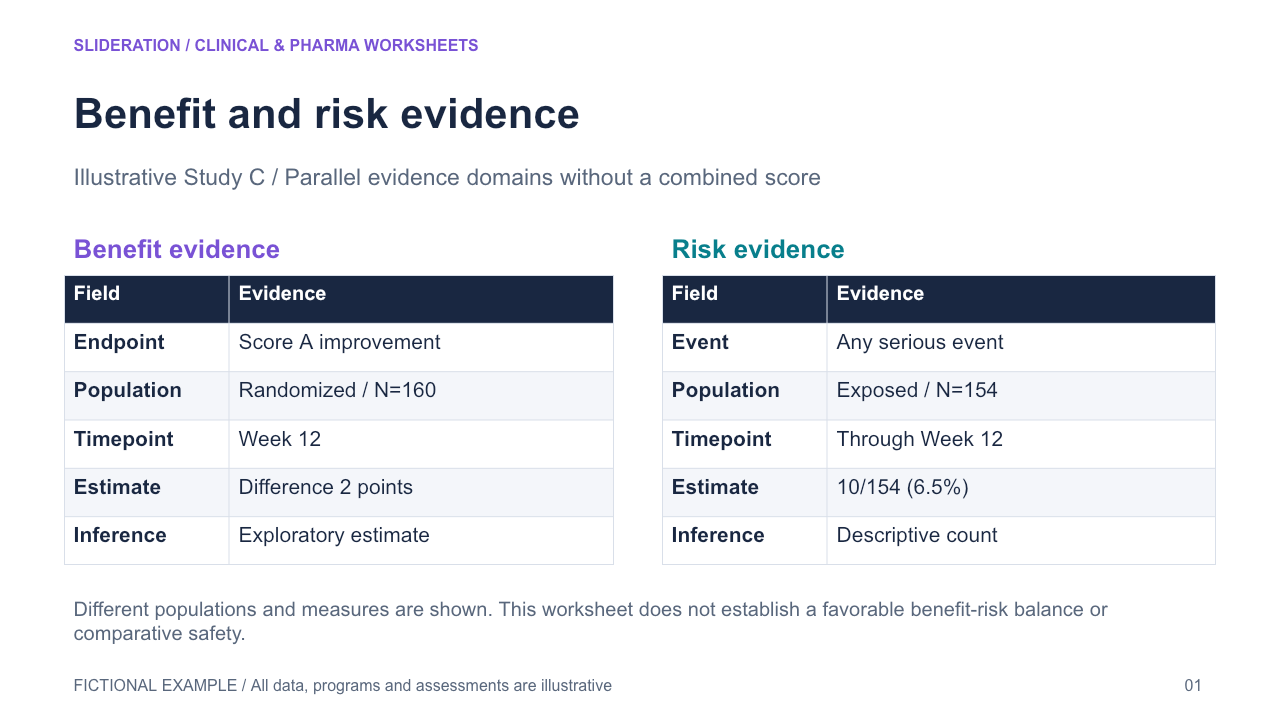
Benefit and risk evidence — Parallel evidence rows retain definition, denominator, timepoint and inference status
2 slides · 1 credit
Check inputs & editing effort →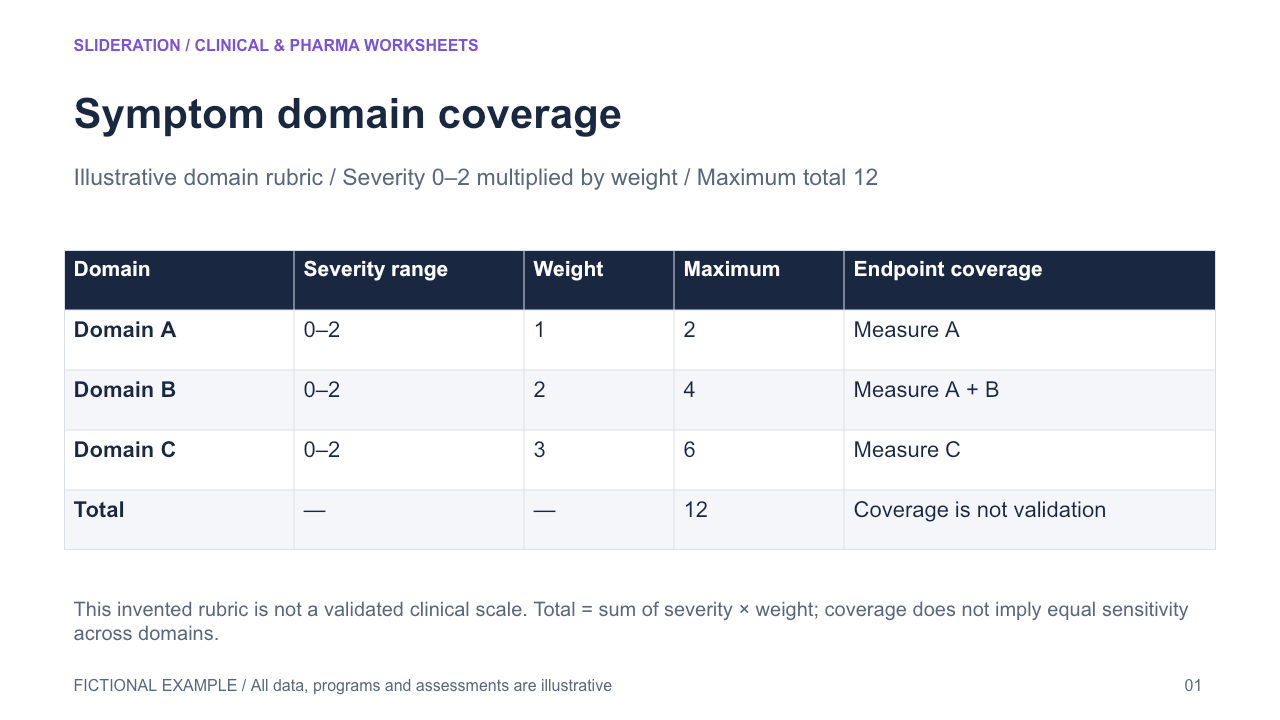
Symptom domain coverage — Domains link severity range, weight and endpoint coverage with explicit scoring rule
2 slides · 1 credit
Check inputs & editing effort →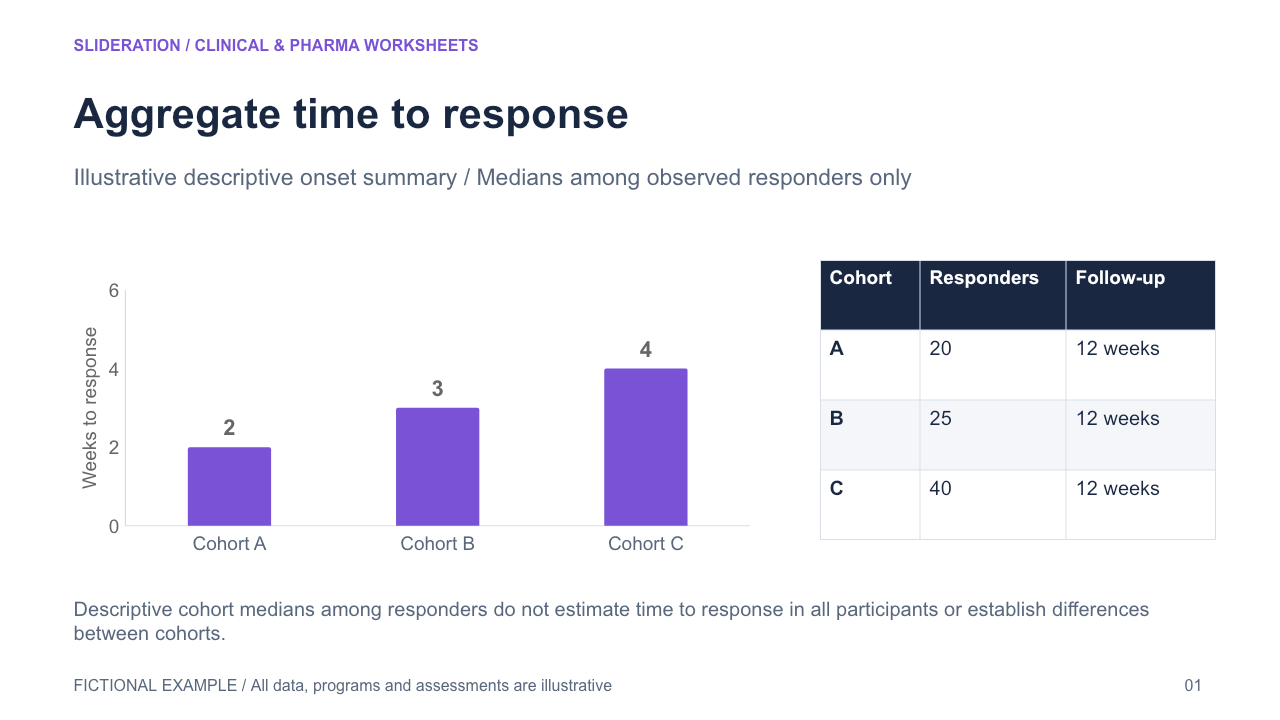
Aggregate time to response — Cohort-level response onset summary retains responder denominator and follow-up
2 slides · 1 credit
Check inputs & editing effort →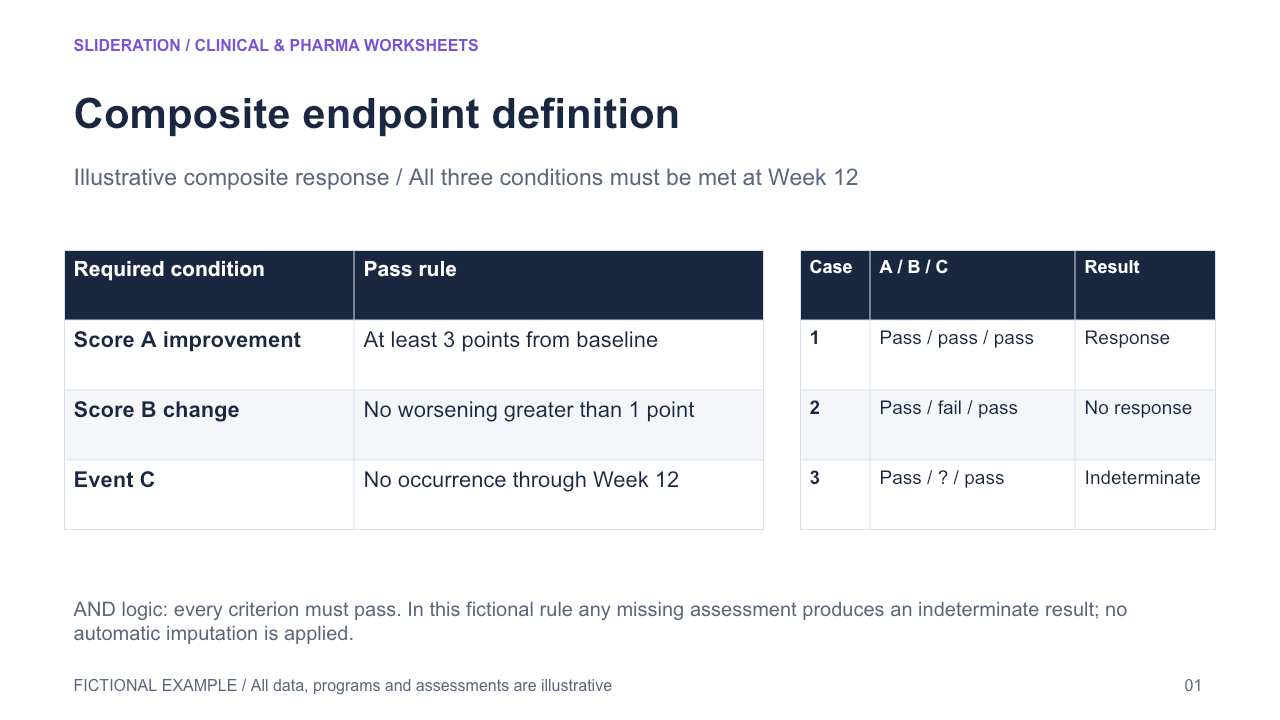
Composite endpoint definition — All required conditions combine with AND logic and explicit handling of missing assessments
2 slides · 1 credit
Check inputs & editing effort →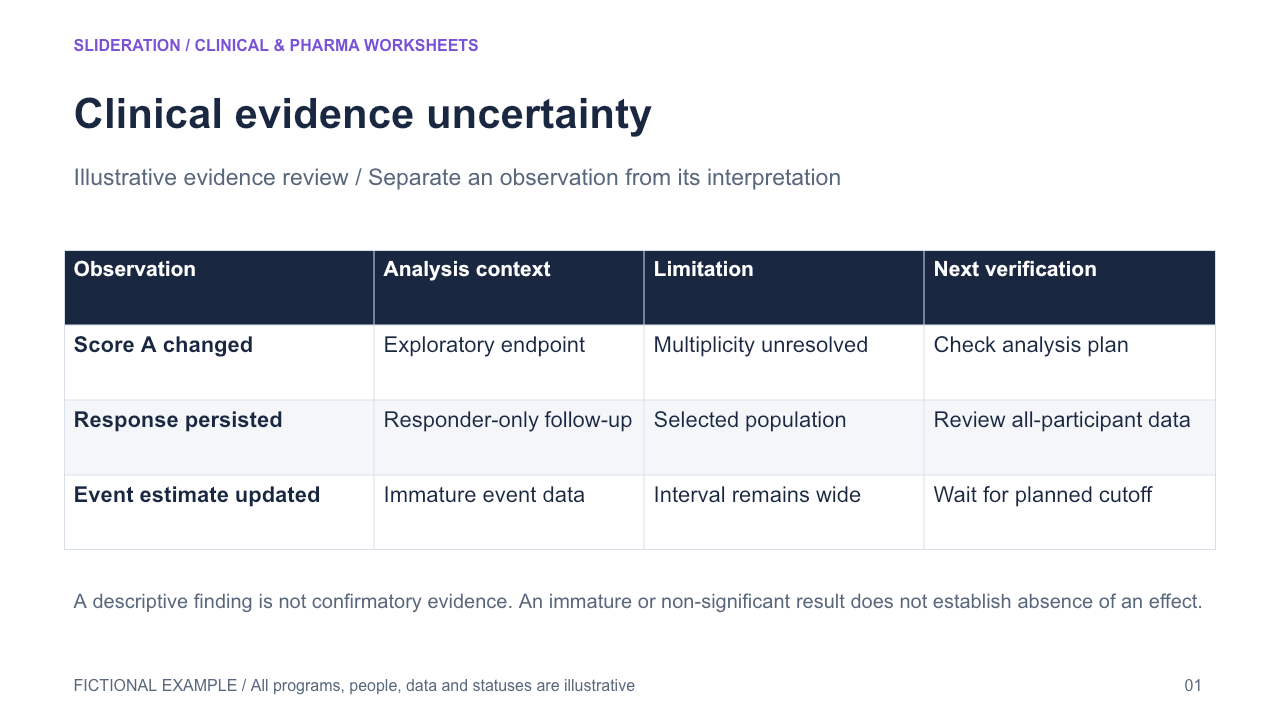
Clinical evidence uncertainty — Claim, analysis context, limitation and next verification stay linked
2 slides · 1 credit
Check inputs & editing effort →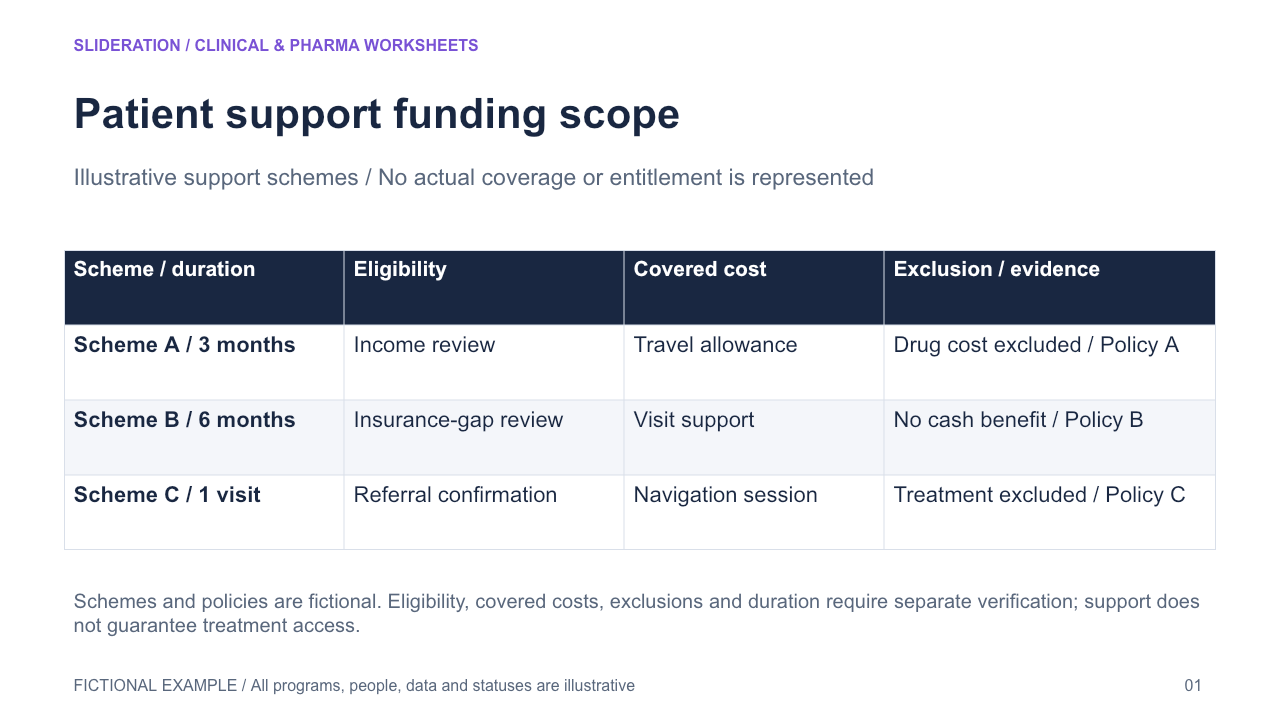
Patient support funding scope — Support scheme links eligibility, covered cost, exclusion, duration and evidence
2 slides · 1 credit
Check inputs & editing effort →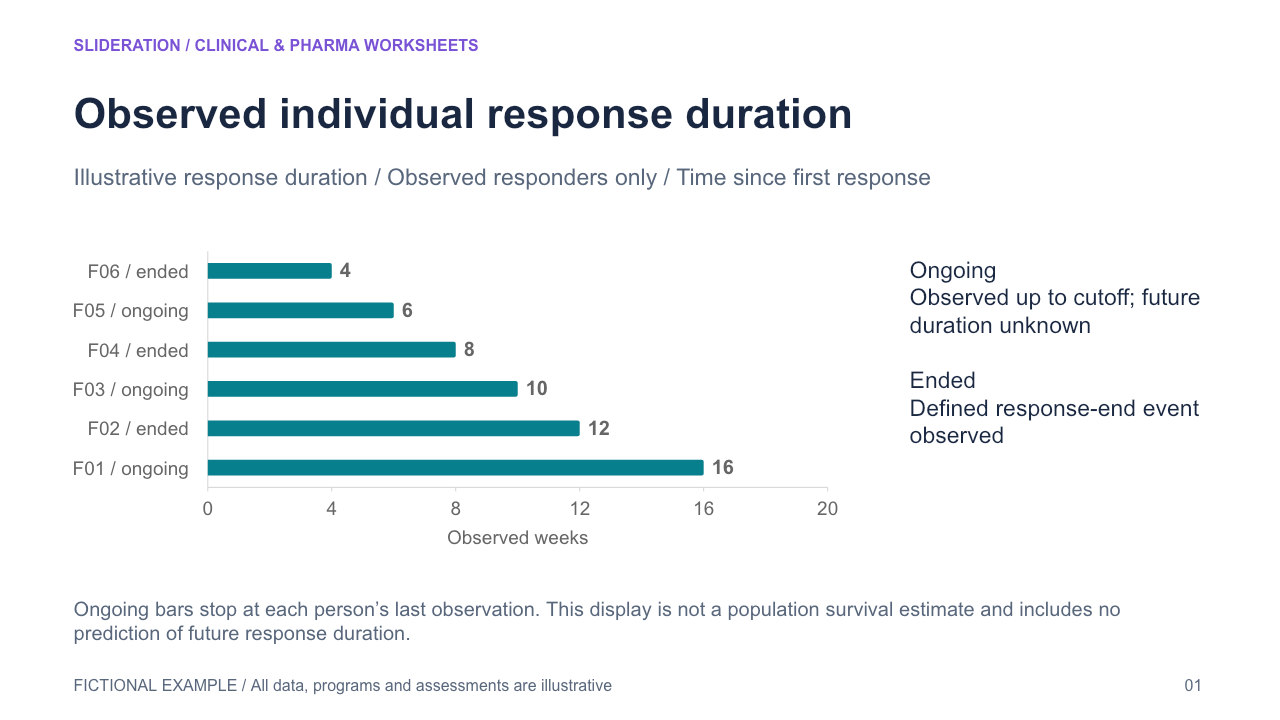
Observed individual response duration — One respondent per row links observed duration, event status and observation cutoff
2 slides · 1 credit
Check inputs & editing effort →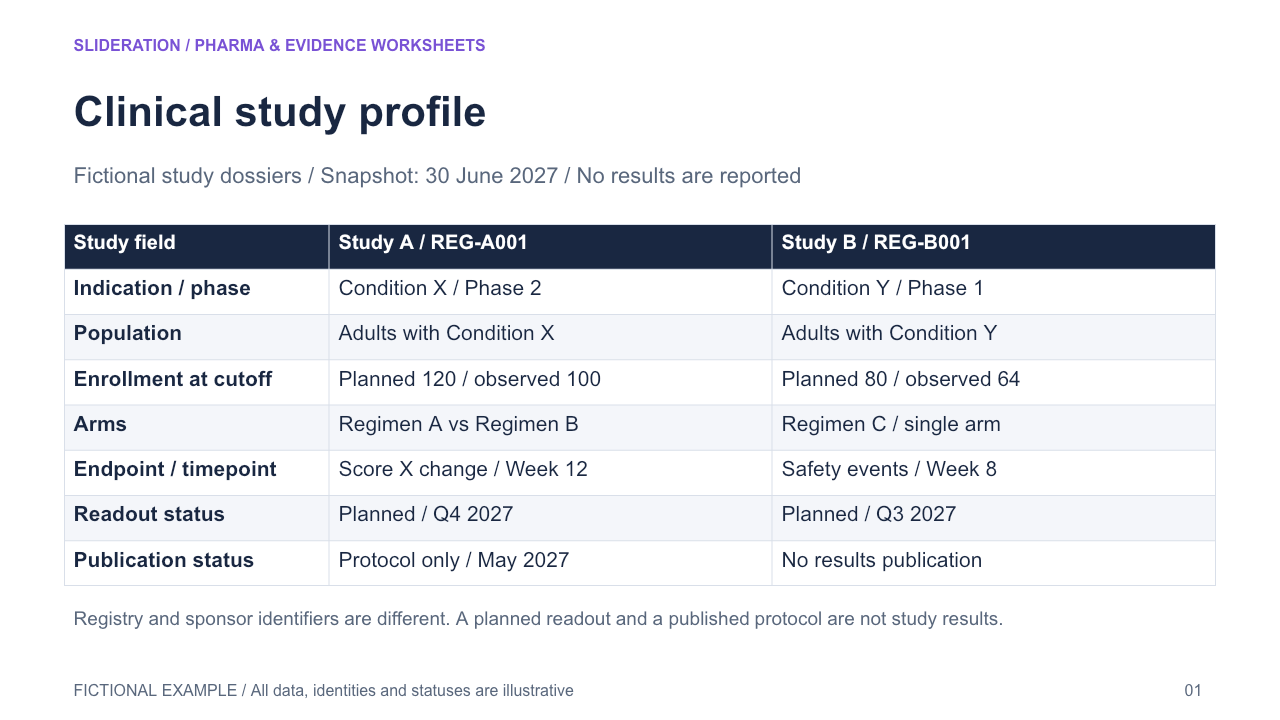
Clinical study profile — Stable study identity connects planned versus observed enrollment, indication, population, arms, endpoint timing and separate readout/publication status. Two aligned field cards replace a design timeline without implying outcomes.
2 slides · 1 credit
Check inputs & editing effort →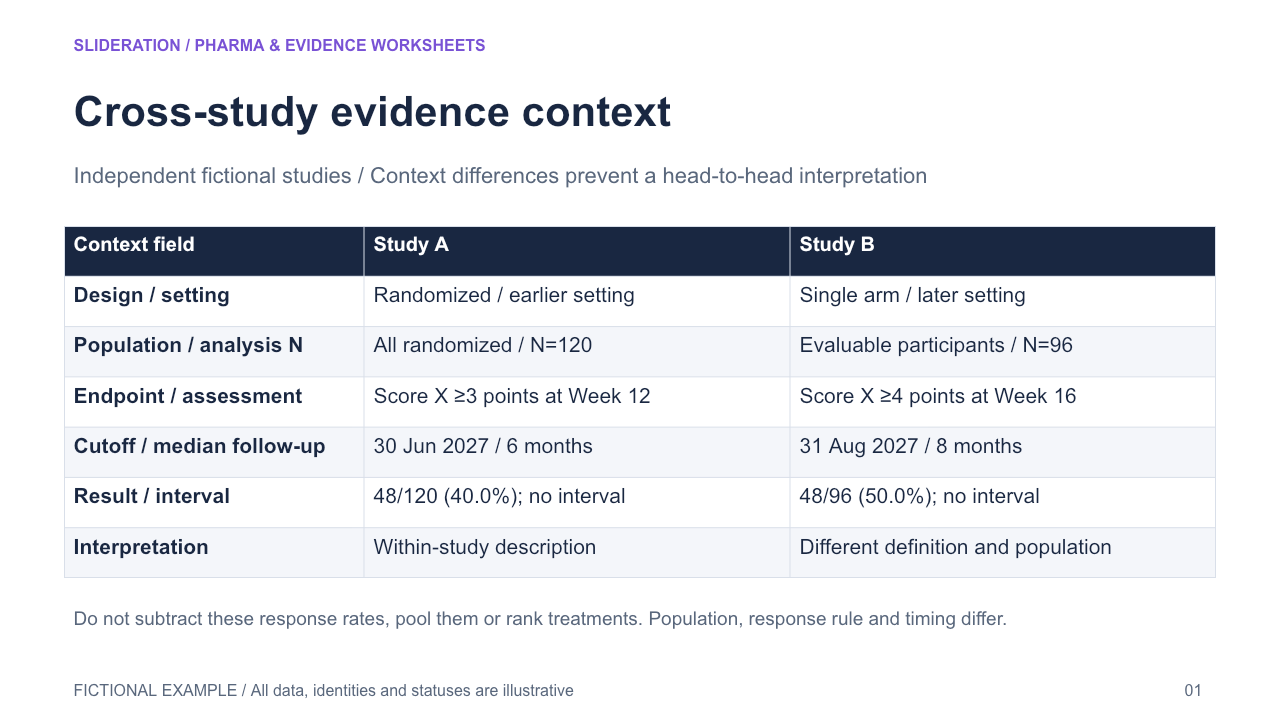
Cross-study evidence context — Distinct studies retain separate population, outcome definition, denominator, follow-up, analysis set and evidence limitations. Context differences remain visible beside descriptive results; no head-to-head ranking.
2 slides · 1 credit
Check inputs & editing effort →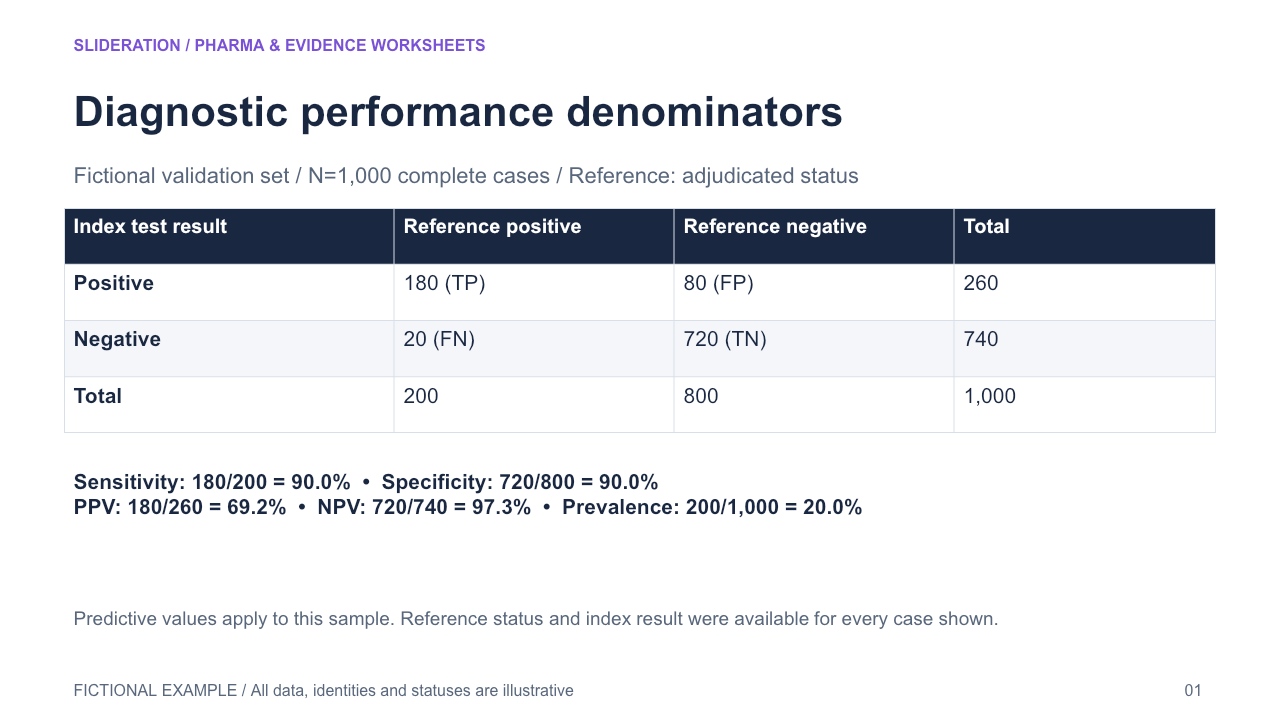
Diagnostic performance denominators — A reference-standard 2x2 count matrix links test result and condition status to sensitivity, specificity, predictive values and prevalence, with each denominator visible.
2 slides · 1 credit
Check inputs & editing effort →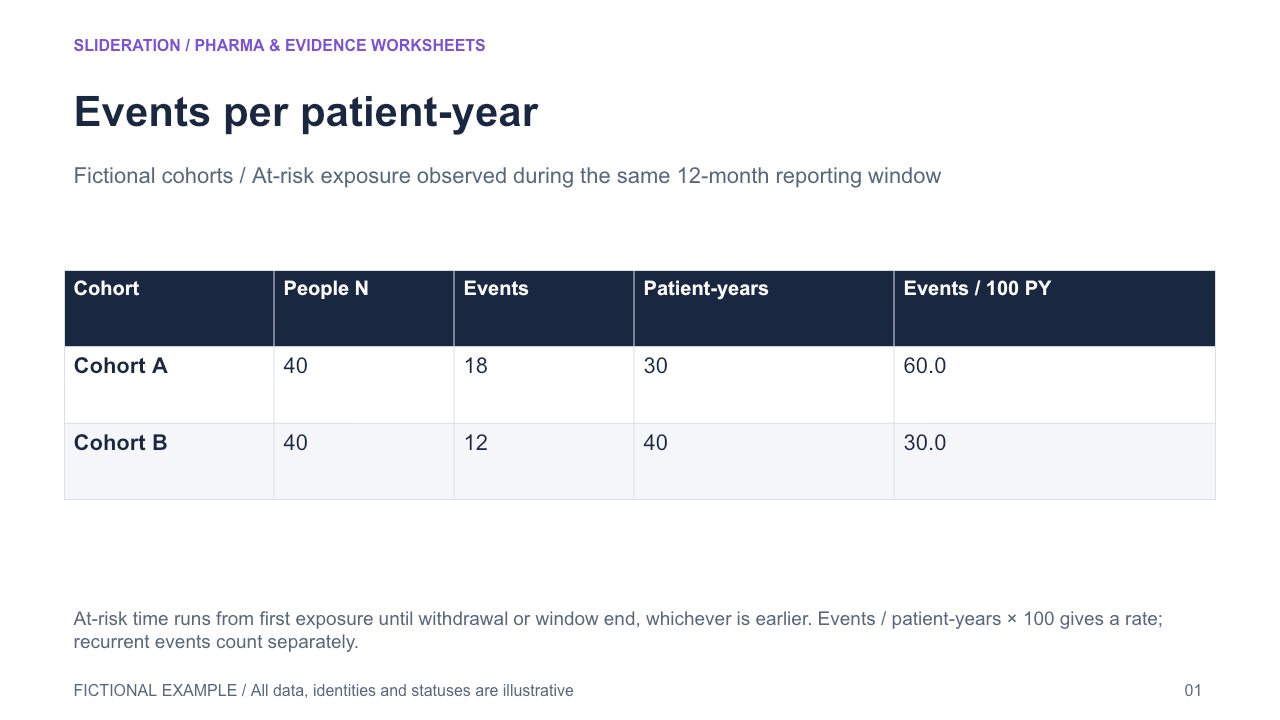
Events per patient-year — Cohort N, recurrent event count, total observed patient-years, observation window and events per 100 patient-years remain linked. Rate is not a proportion of unique people.
2 slides · 1 credit
Check inputs & editing effort →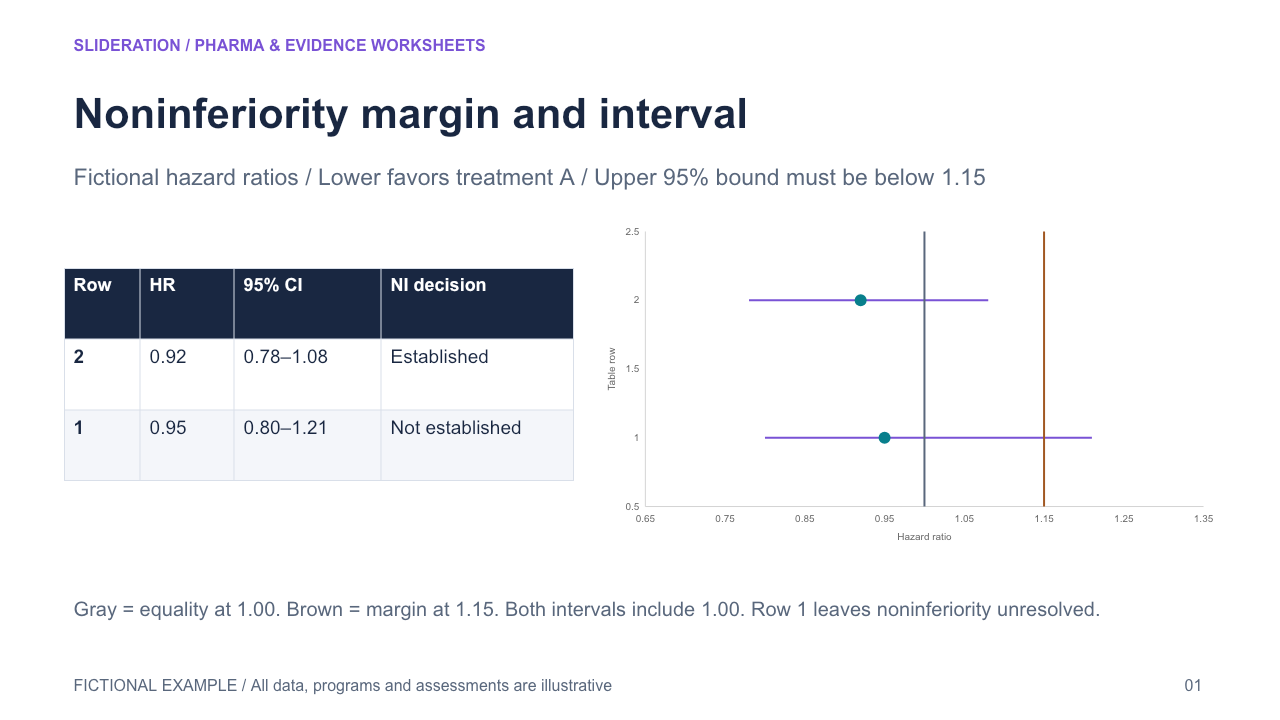
Noninferiority margin and interval — A prespecified effect-scale margin and no-effect reference sit beside the estimate and interval, with endpoint direction, analysis population and decision rule explicit. Noninferiority and superiority remain separate questions.
2 slides · 1 credit
Check inputs & editing effort →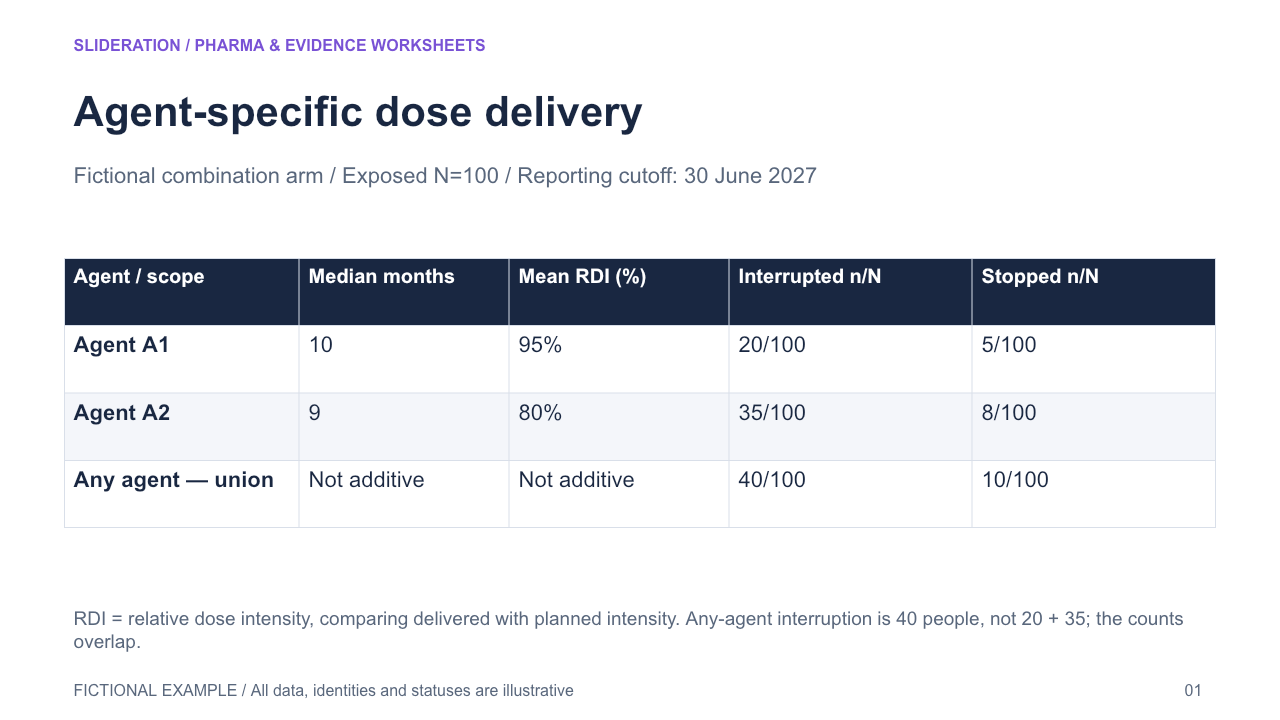
Agent-specific dose delivery — An arm contains multiple agents; duration, relative dose intensity and interruption/discontinuation retain agent identity, while arm-level any-agent counts are separately reported.
2 slides · 1 credit
Check inputs & editing effort →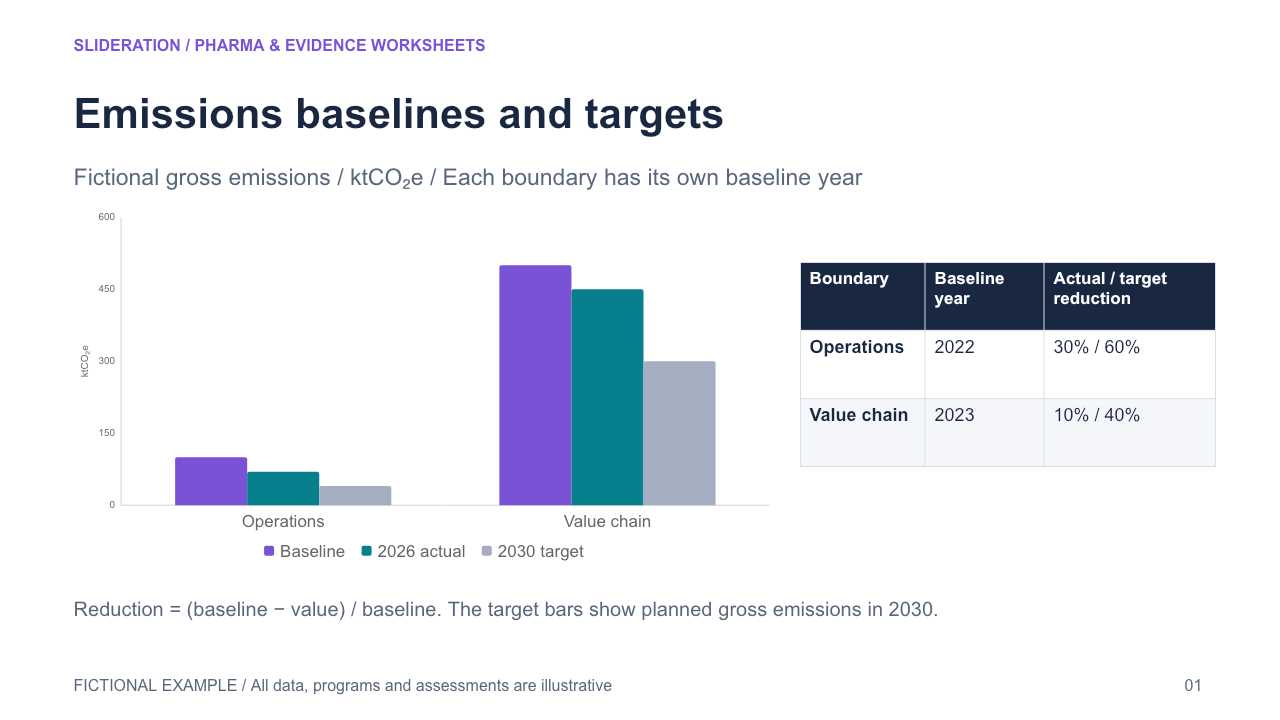
Emissions baselines and targets — Each emissions boundary retains its own baseline year/value, actual cutoff/value and target year/value, with within-boundary reduction arithmetic. Different baselines are not silently pooled.
2 slides · 1 credit
Check inputs & editing effort →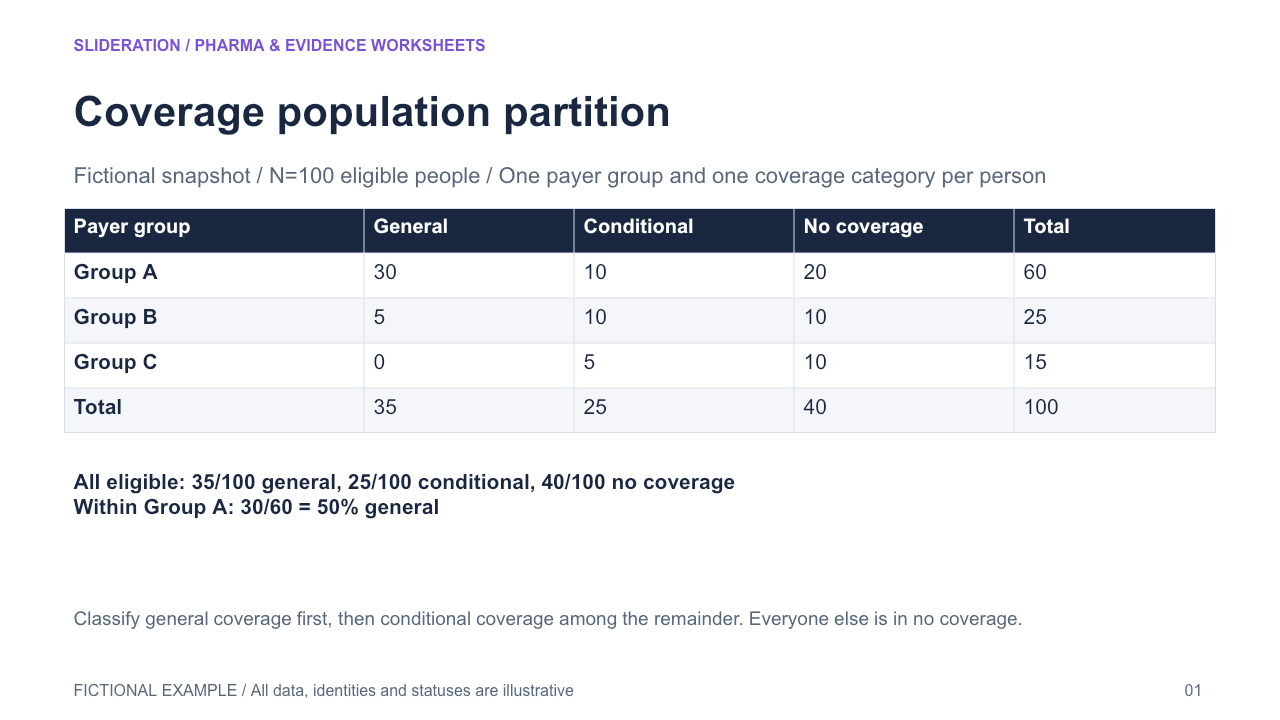
Coverage population partition — A joint payer-by-coverage table preserves the total-population denominator, disjoint coverage rules and payer subtotals. Marginal payer and coverage summaries derive from the same cell counts.
2 slides · 1 credit
Check inputs & editing effort →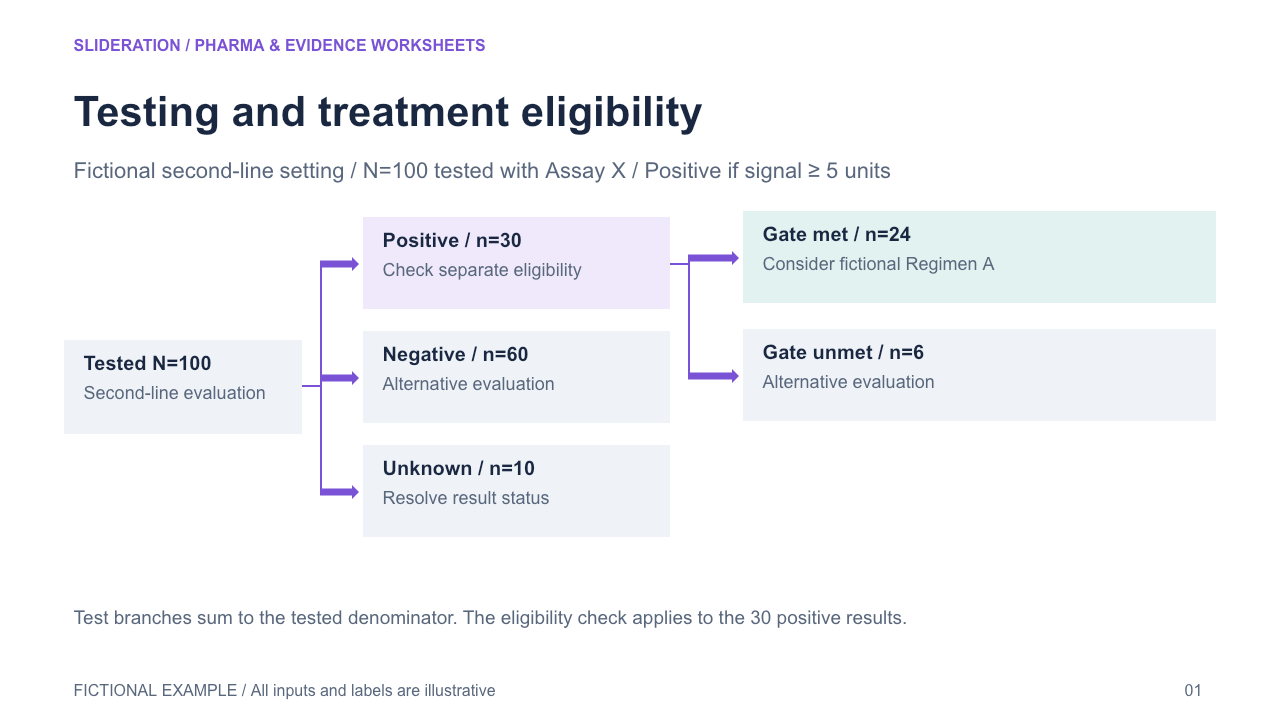
Testing and treatment eligibility — Prior research setting, a testing step, positive/negative/unknown results and additional eligibility review are separate gates before a fictional treatment-study consideration.
2 slides · 1 credit
Check inputs & editing effort →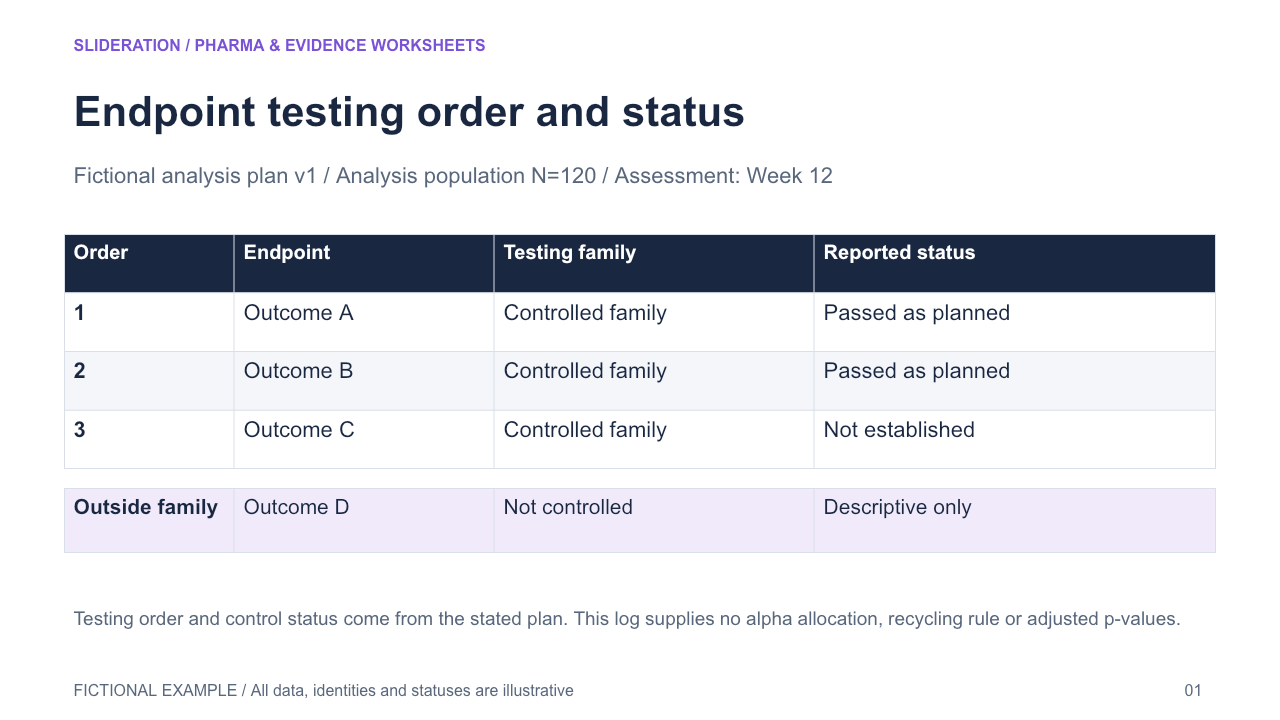
Endpoint testing order and status — Prespecified ordered endpoint rows retain multiplicity-control status, analysis population/timepoint and claim status; additional nominal analyses are visibly outside the ordered family.
2 slides · 1 credit
Check inputs & editing effort →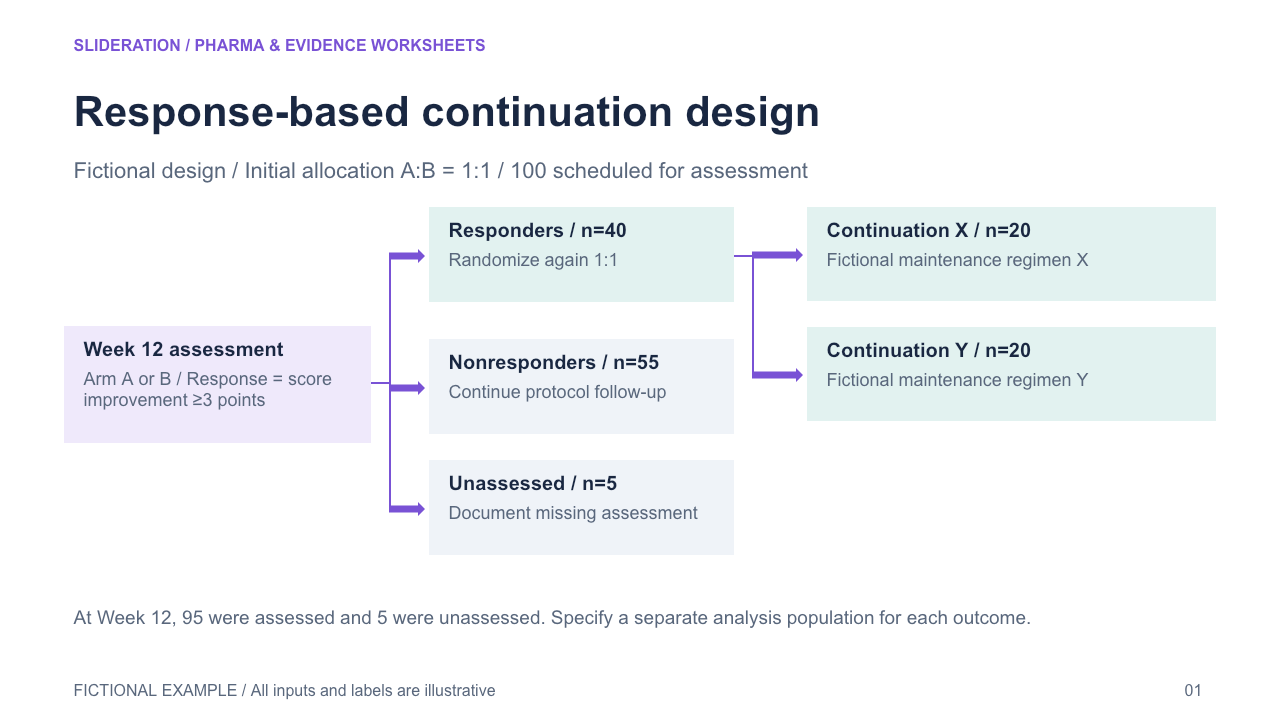
Response-based continuation design — An initial assignment leads to a timed response assessment; responders and nonresponders follow different continuation paths, and a second randomization is explicitly confined to the eligible response subgroup.
2 slides · 1 credit
Check inputs & editing effort →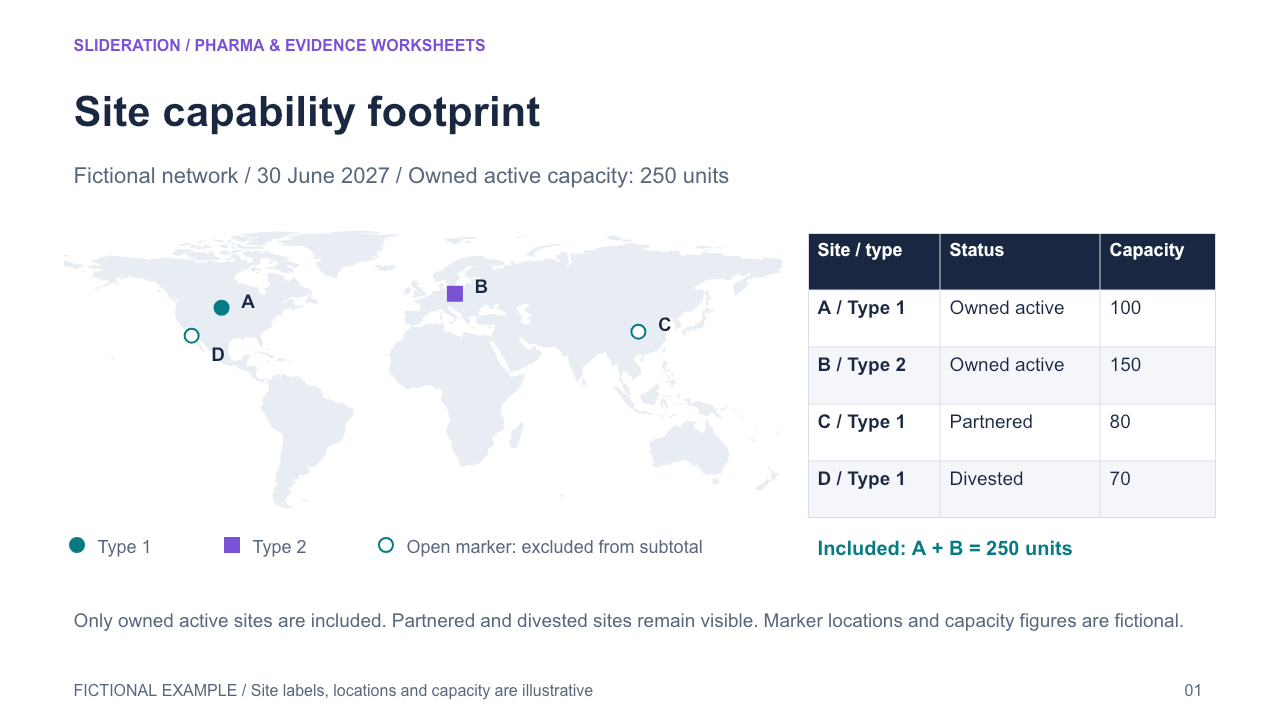
Site capability footprint — Geographically located sites retain capability category, operational status and inclusion in a declared capacity subtotal. A divested/partnered site is marked separately from owned active capacity.
2 slides · 1 credit
Check inputs & editing effort →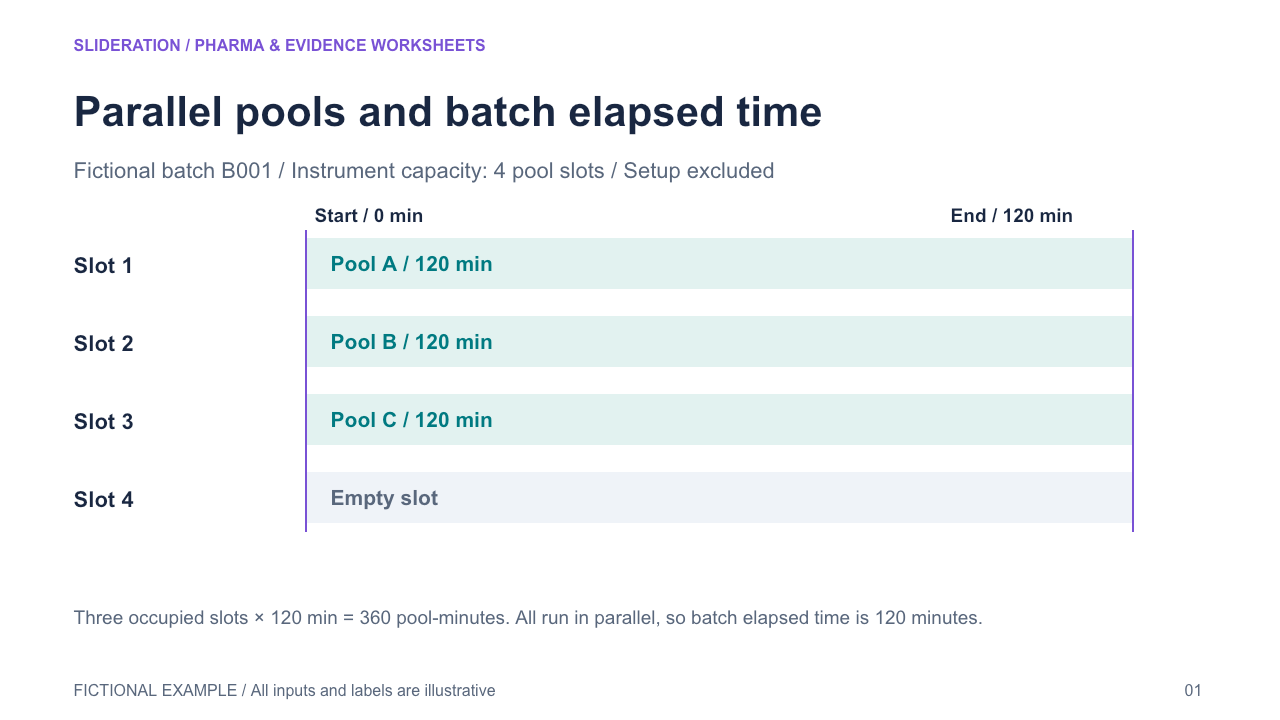
Parallel pools and batch elapsed time — One instrument batch contains independently identified pool slots running concurrently; batch elapsed time is separate from summed pool-minutes, with capacity and empty slots explicit.
2 slides · 1 credit
Check inputs & editing effort →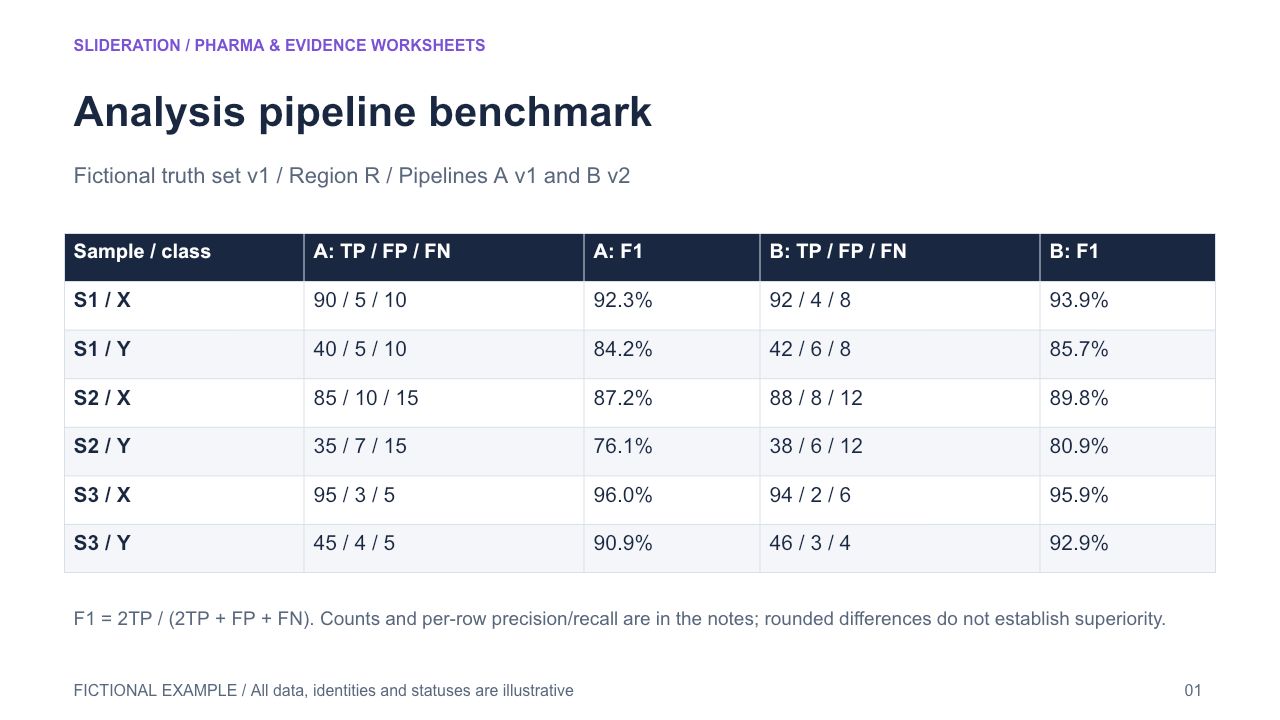
Analysis pipeline benchmark — Same reference samples and variant classes are evaluated by two pipelines; per-sample/class TP/FP/FN counts generate paired precision/recall/F1 with a declared reference-region/evaluation scope.
2 slides · 1 credit
Check inputs & editing effort →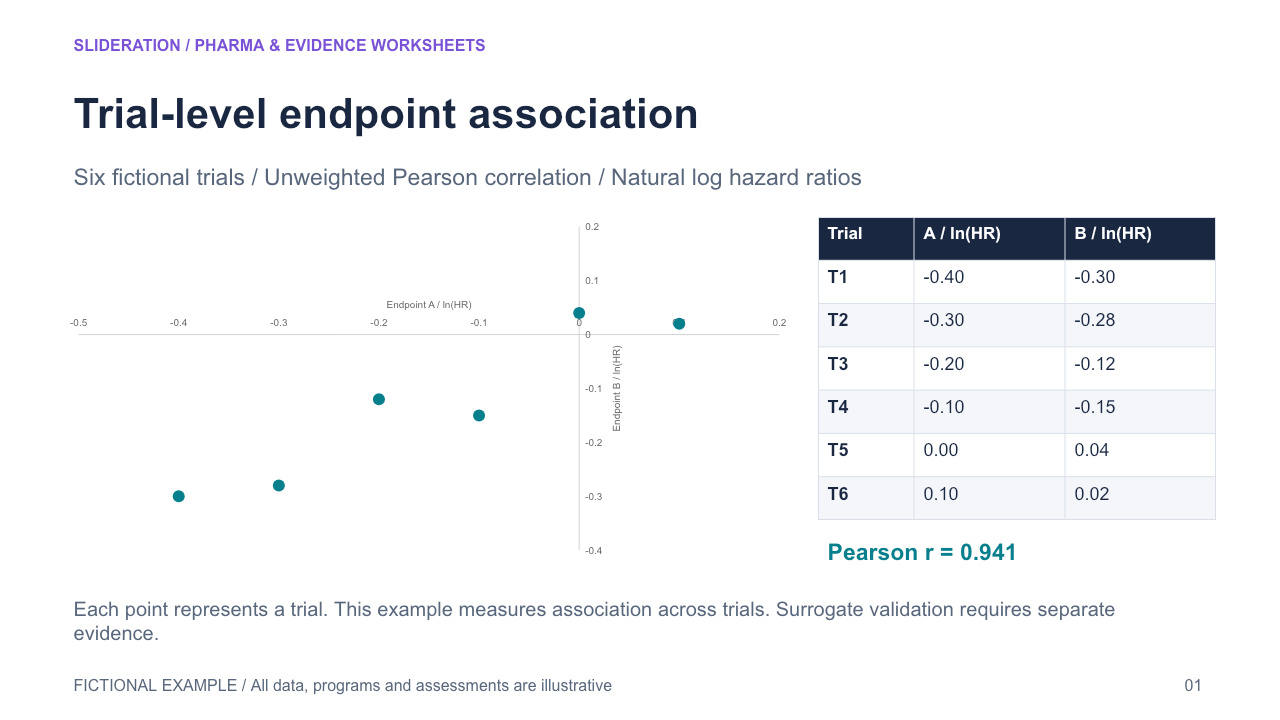
Trial-level endpoint association — Each plotted point is one trial with paired log-effect estimates for two endpoints; the trial count, effect scales and unweighted association statistic retain the aggregate unit of analysis.
2 slides · 1 credit
Check inputs & editing effort →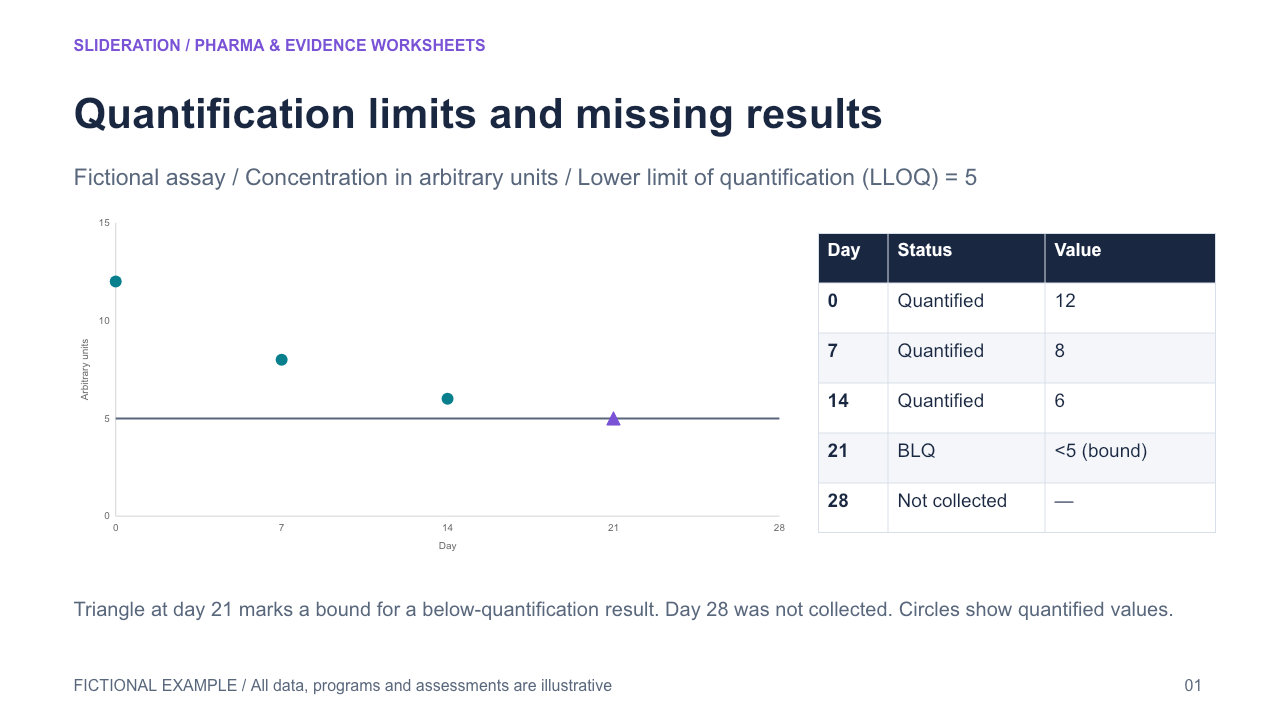
Quantification limits and missing results — Quantified observations, below-quantification-limit results and not-collected measurements have distinct states, units and plot treatment; a known assay limit is not a measured concentration.
2 slides · 1 credit
Check inputs & editing effort →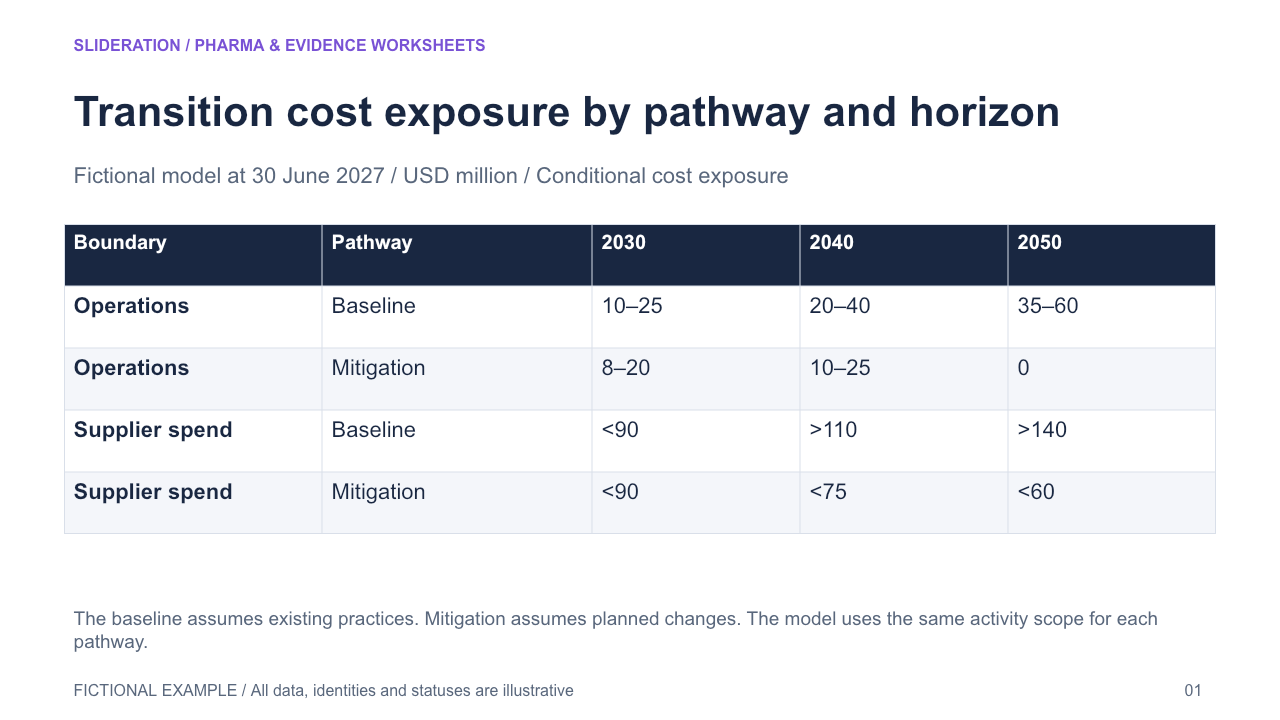
Transition cost exposure by pathway and horizon — Compare modeled cost exposure by operating boundary, baseline or mitigation pathway, and horizon while retaining point, interval and one-sided bounds as different data types.
2 slides · 1 credit
Check inputs & editing effort →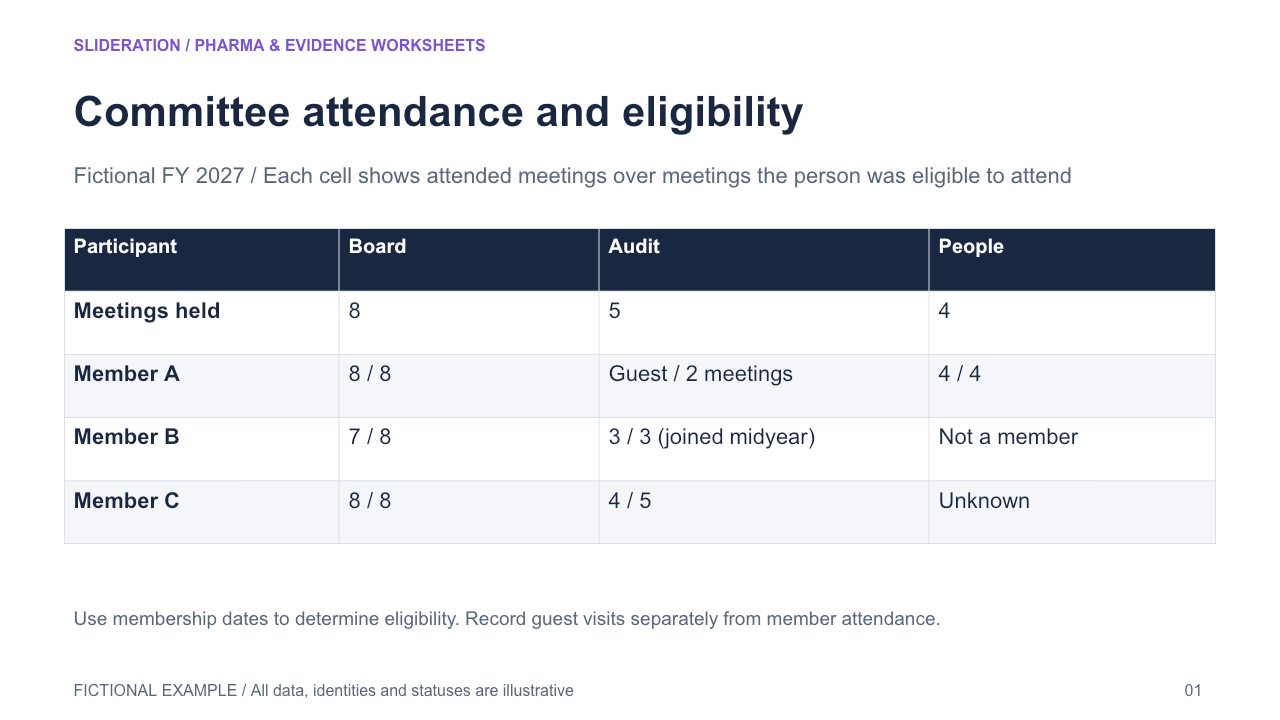
Committee attendance and eligibility — Link scheduled meetings to person-committee eligibility, actual attendance, guest participation and partial-period membership without using a universal denominator for each cell.
2 slides · 1 credit
Check inputs & editing effort →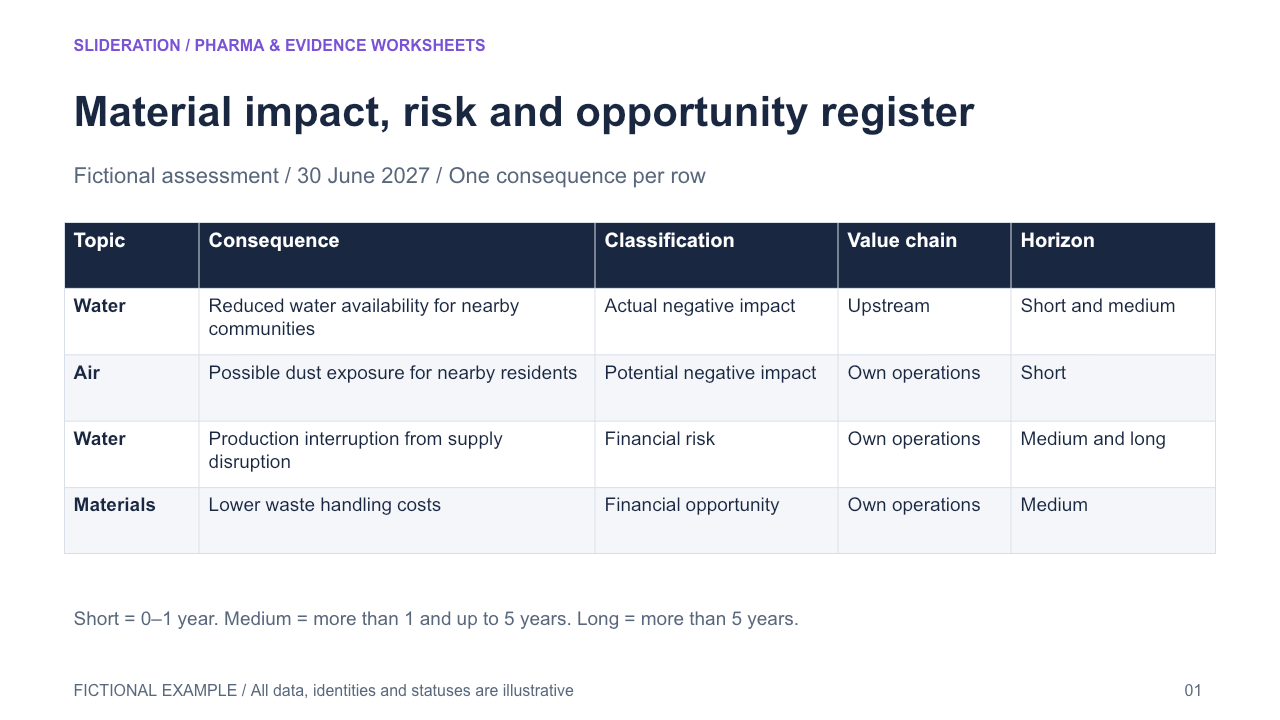
Material impact, risk and opportunity register — Record each material issue by consequence, classification, value-chain boundary and applicable time horizons, with separate environmental or social impacts and financial risks or opportunities.
2 slides · 1 credit
Check inputs & editing effort →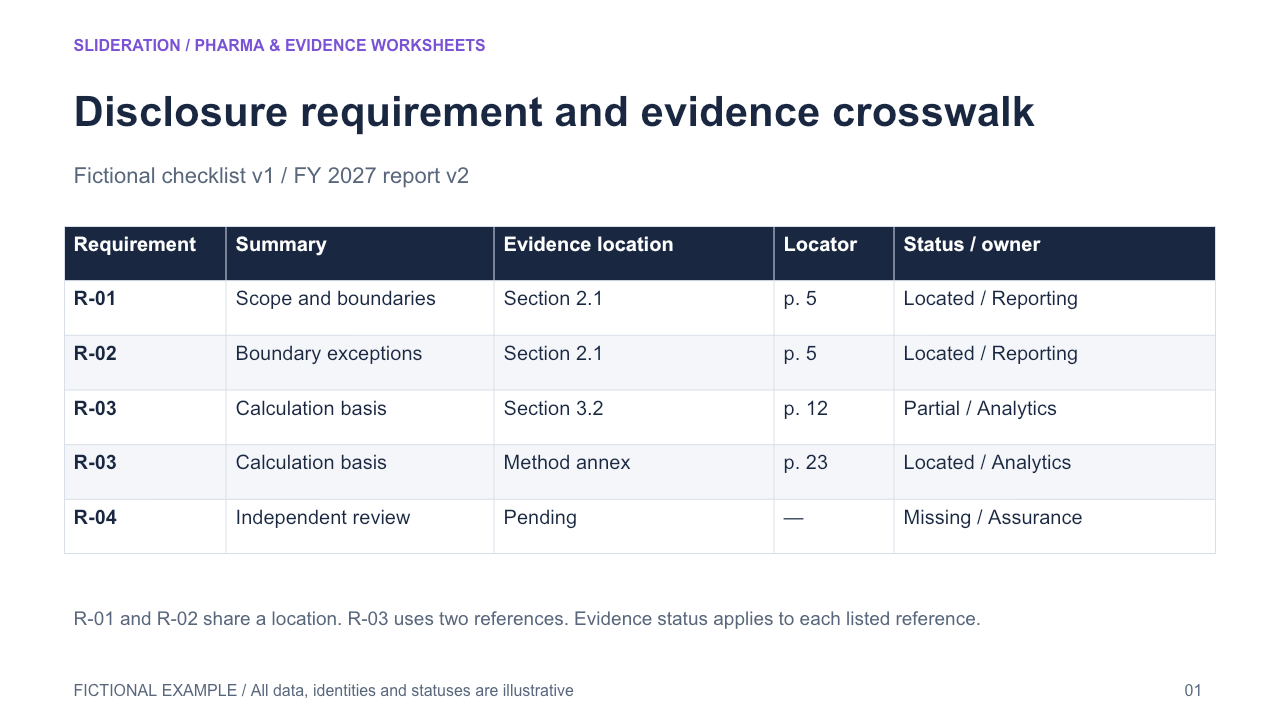
Disclosure requirement and evidence crosswalk — Trace each requirement identifier and scope to a report section, page and evidence status. Several requirements may share a location, while a single requirement may need multiple references.
2 slides · 1 credit
Check inputs & editing effort →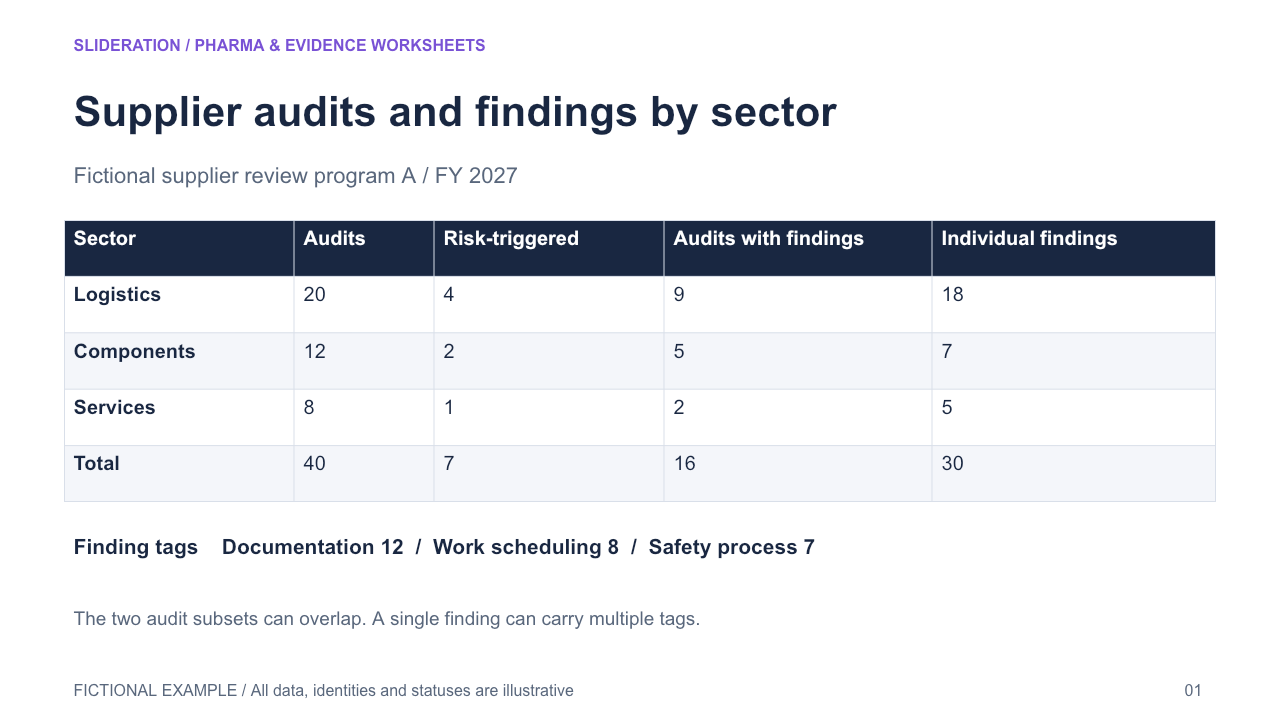
Supplier audits and findings by sector — Reconcile audit events and findings as separate populations by sector. Distinguish risk-triggered audits and audits with findings from individual findings and separately tagged issue types.
2 slides · 1 credit
Check inputs & editing effort →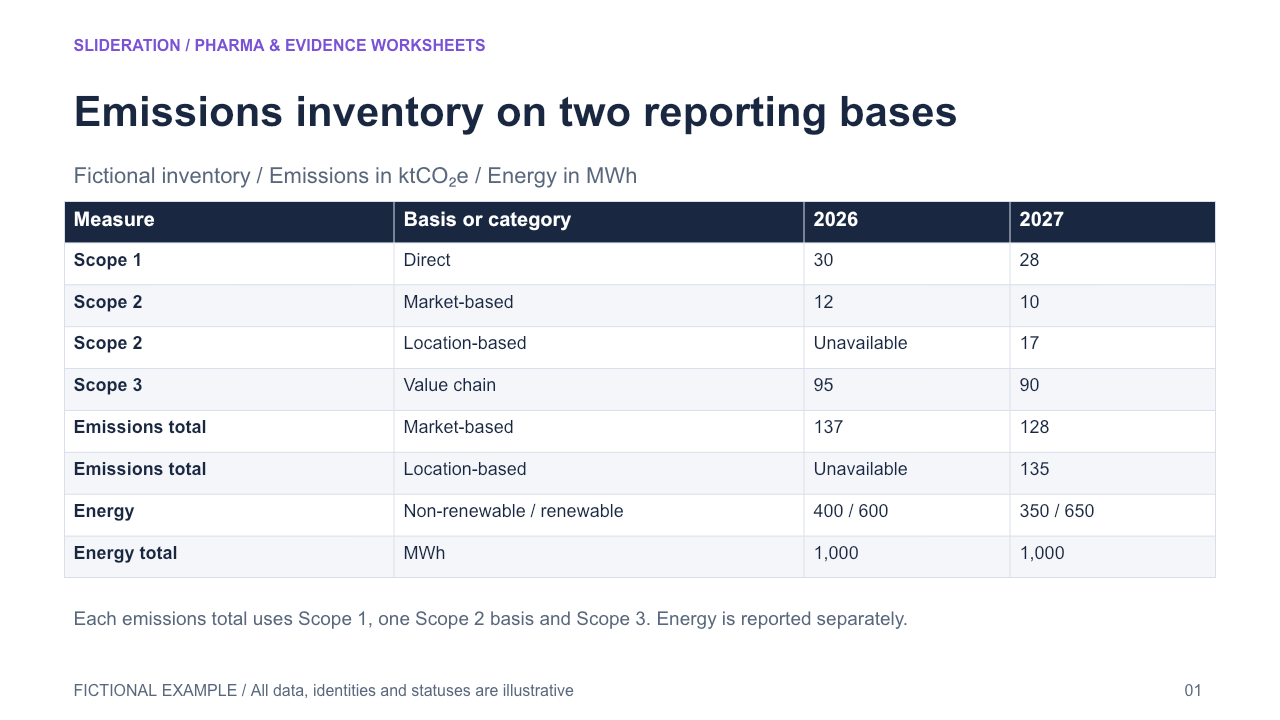
Emissions inventory on two reporting bases — Compare market-based and location-based Scope 2 alternatives by year, share the same Scope 1 and Scope 3 values, and show which annual totals can be calculated. Keep energy quantities in a separate context panel.
2 slides · 1 credit
Check inputs & editing effort →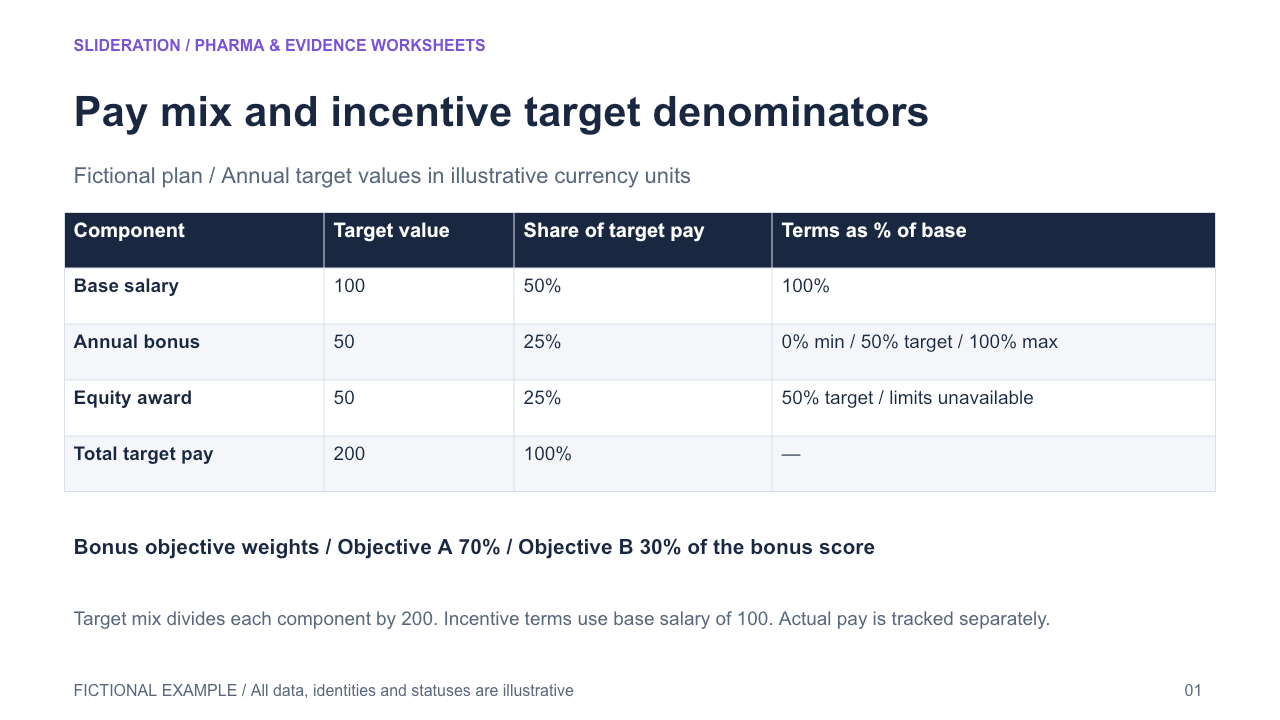
Pay mix and incentive target denominators — Reconcile component share of target total pay separately from component value as a percentage of fixed base pay. Show distinct component minimums, targets and maximums and separate objective weights.
2 slides · 1 credit
Check inputs & editing effort →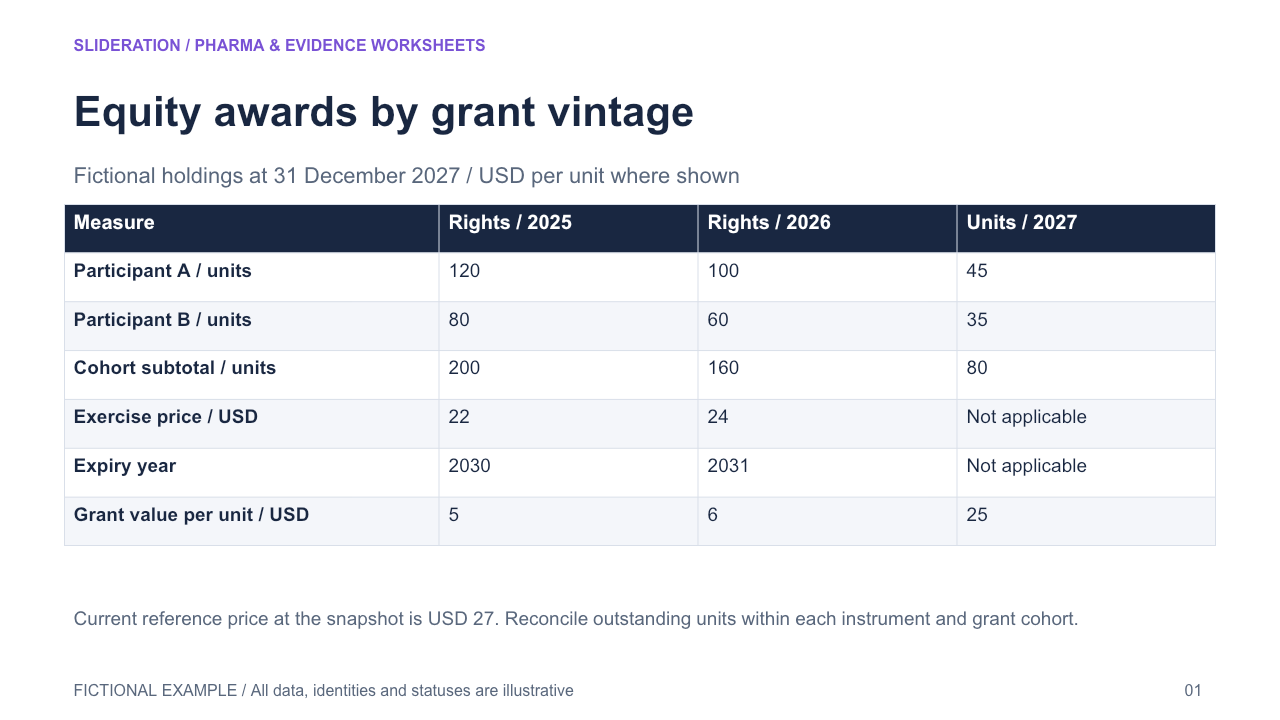
Equity awards by grant vintage — Tie outstanding units per participant to instrument and grant cohort at one observation cutoff, with matching per-unit grant terms and independent current reference price.
2 slides · 1 credit
Check inputs & editing effort →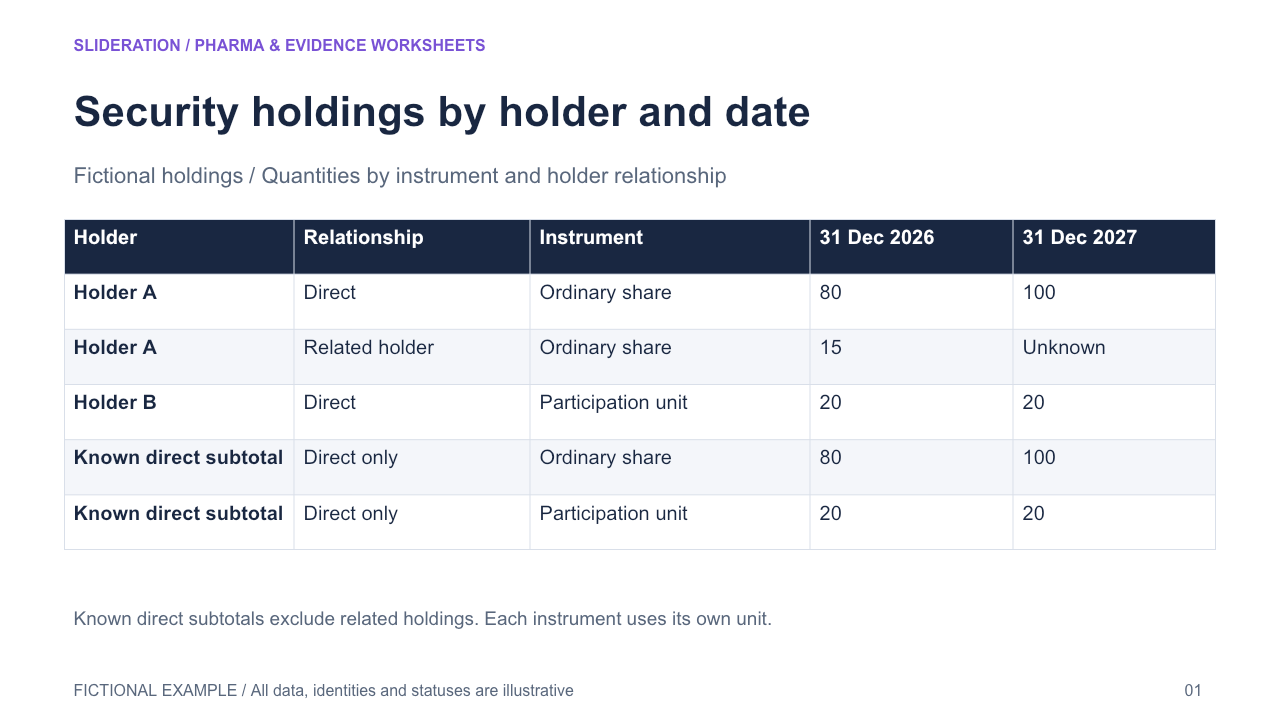
Security holdings by holder and date — Compare security holdings at two observation dates by instrument and holder relationship. Reconcile like units within each snapshot, and keep unknown or undisclosed holdings explicit.
2 slides · 1 credit
Check inputs & editing effort →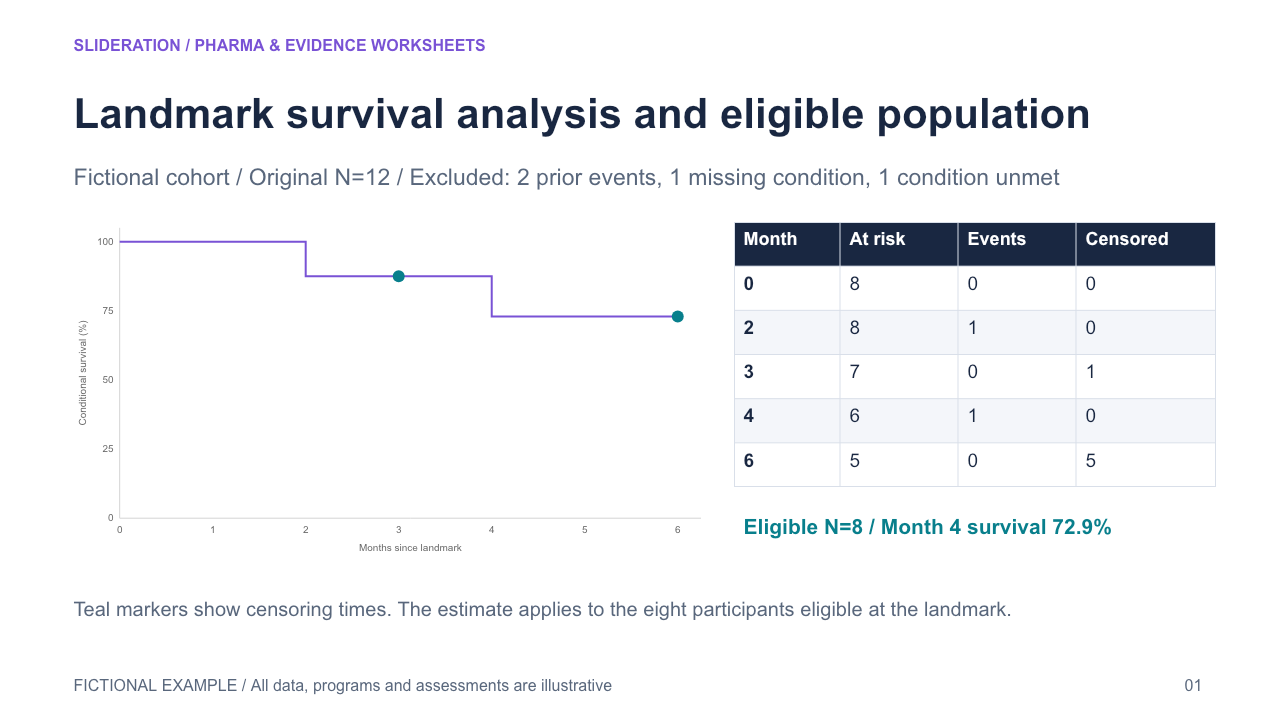
Landmark survival analysis and eligible population — Reconcile the initial cohort with landmark eligibility and condition, then restart the event-time axis at the landmark for the eligible subset. Keep original and conditional populations visible.
2 slides · 1 credit
Check inputs & editing effort →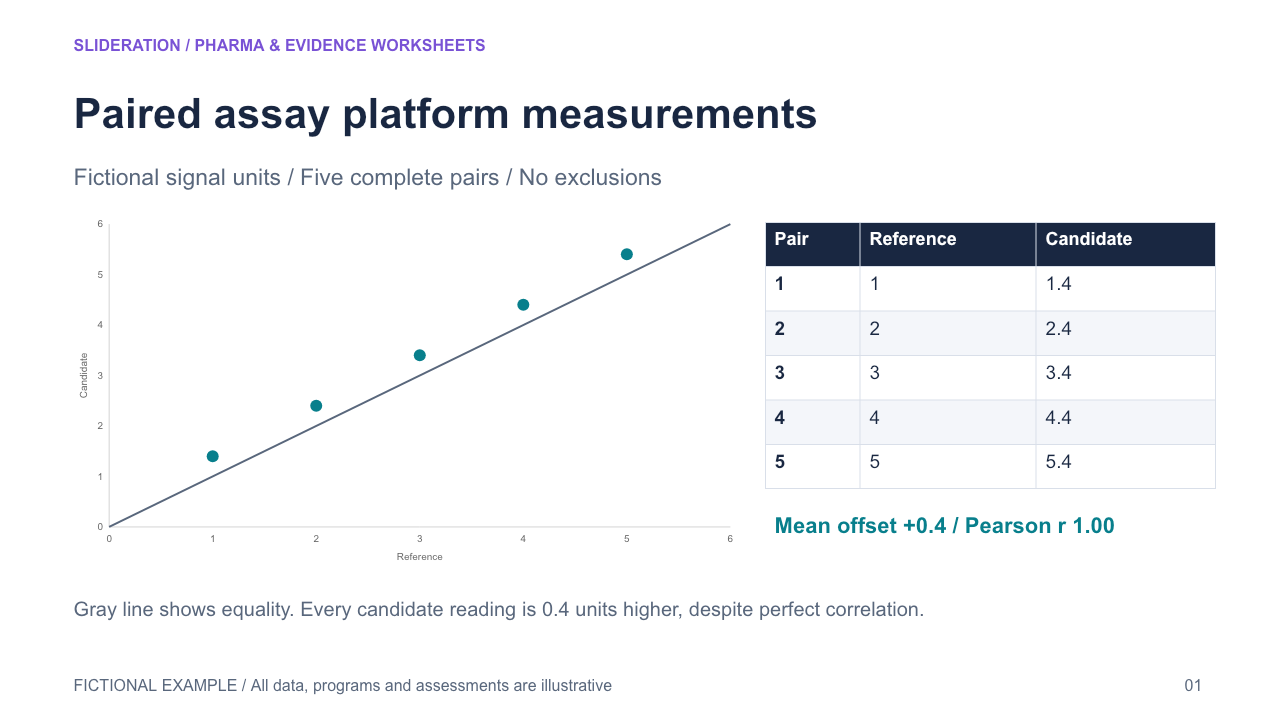
Paired assay platform measurements — Place matched measurements from a reference and candidate platform on the same declared scale, with pair counts, transform, identity guide and per-assay scope. Keep association distinct from agreement.
2 slides · 1 credit
Check inputs & editing effort →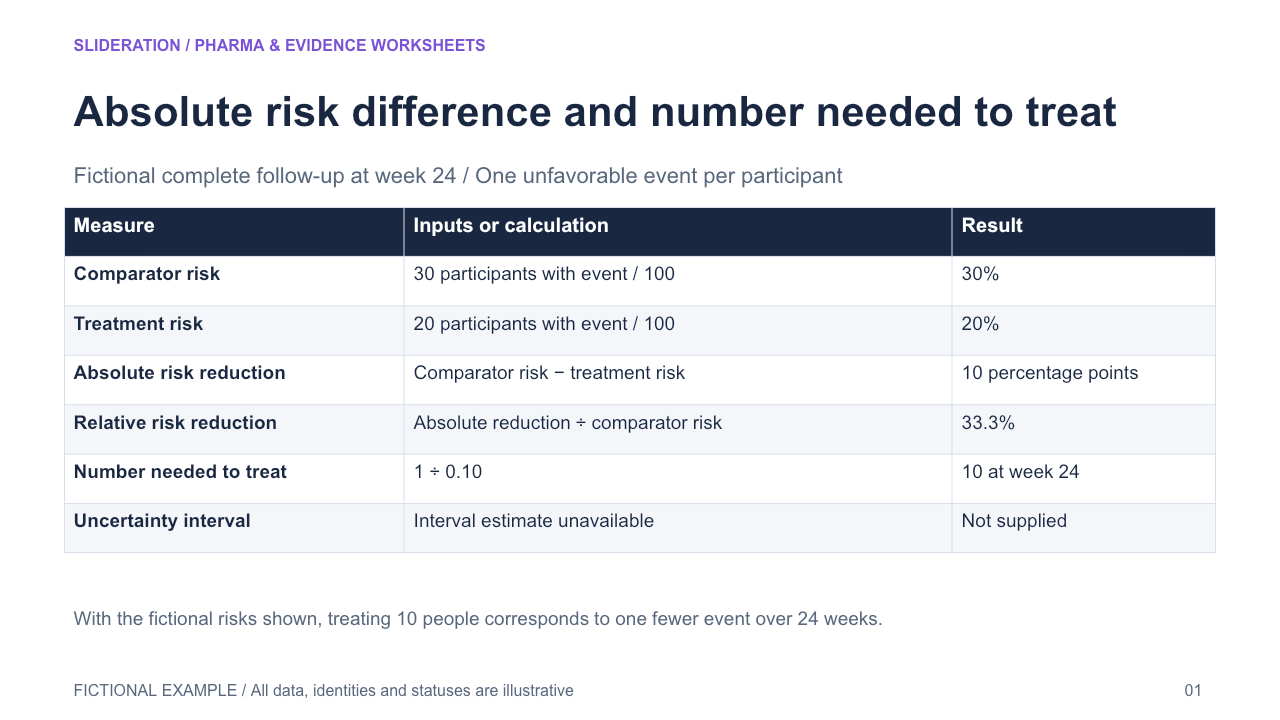
Absolute risk difference and number needed to treat — Tie absolute and relative effect summaries to two fixed-horizon arm risks and show the reciprocal of the absolute risk reduction. Display the endpoint, comparator and uncertainty alongside the calculated values.
2 slides · 1 credit
Check inputs & editing effort →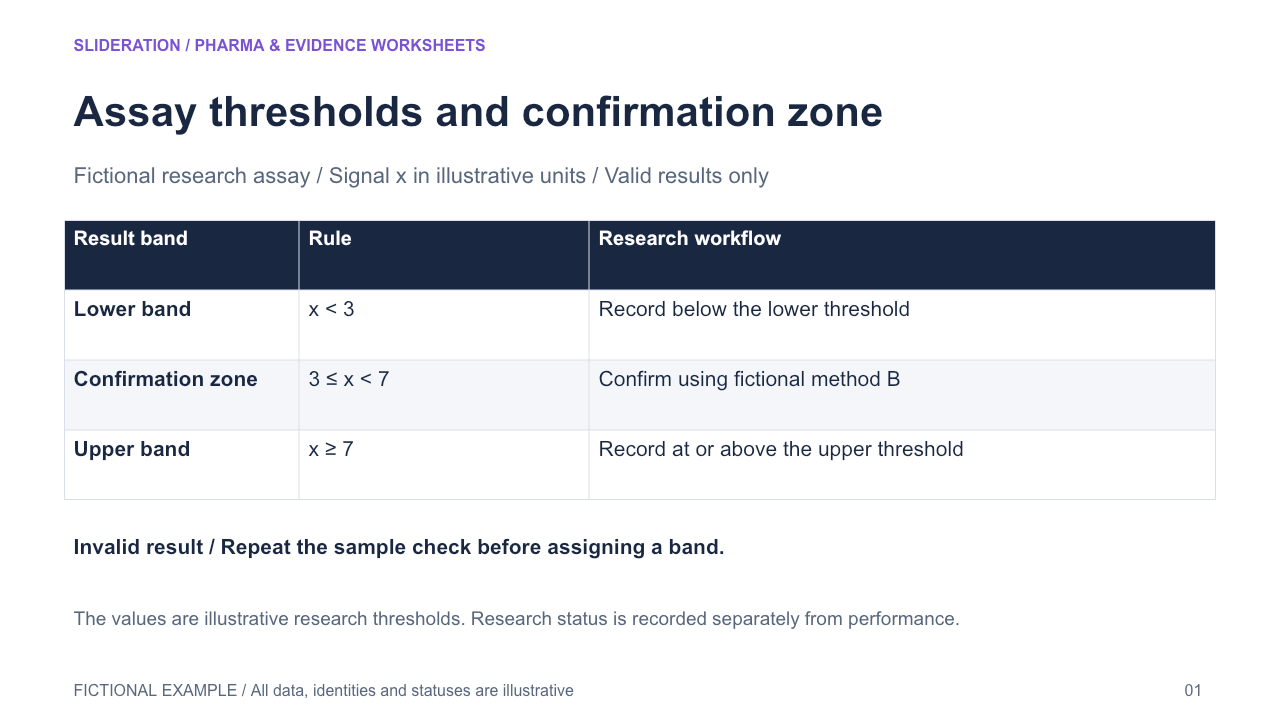
Assay thresholds and confirmation zone — Map one continuous result scale to three mutually exclusive interpretation zones, including an intermediate confirmation band and explicit boundary rules.
2 slides · 1 credit
Check inputs & editing effort →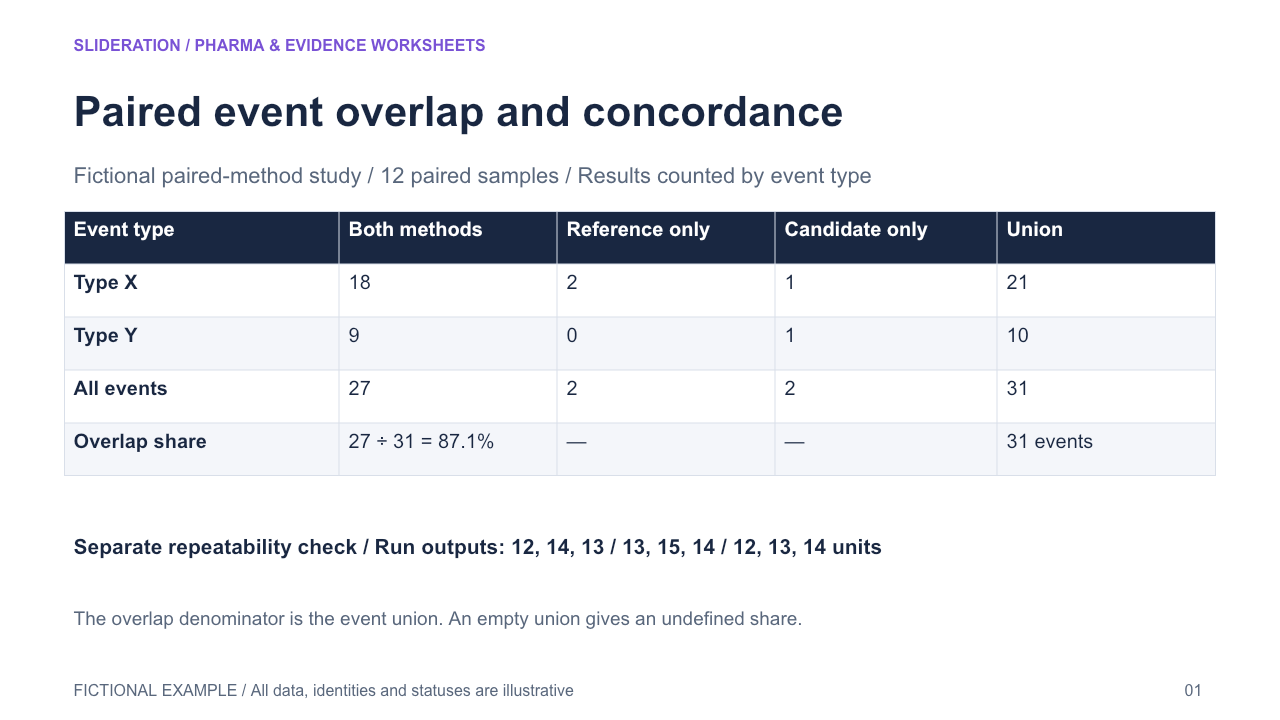
Paired event overlap and concordance — Reconcile shared and method-exclusive detections across event classes under one matching rule, then summarize overlap against the union. Display run repeatability as a distinct panel when relevant.
2 slides · 1 credit
Check inputs & editing effort →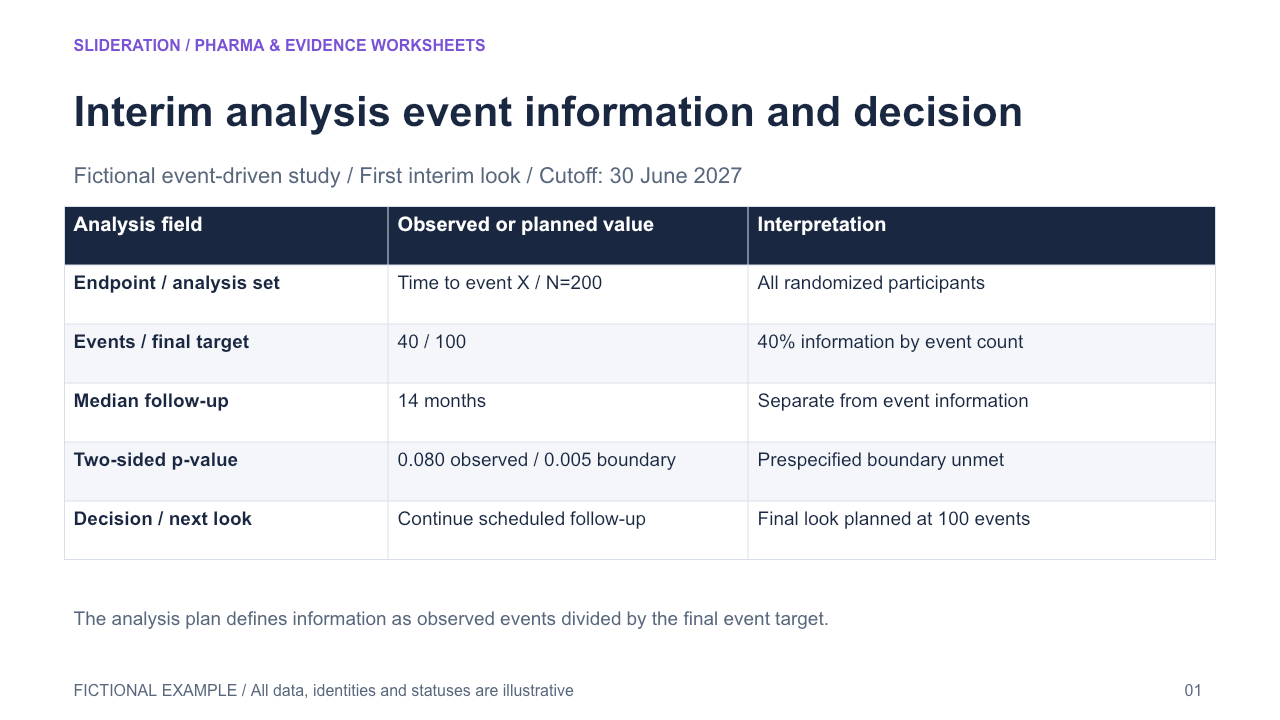
Interim analysis event information and decision — Show a single interim look with observed events versus planned final events, the actual testing boundary and decision, separately from median follow-up and the count at risk.
2 slides · 1 credit
Check inputs & editing effort →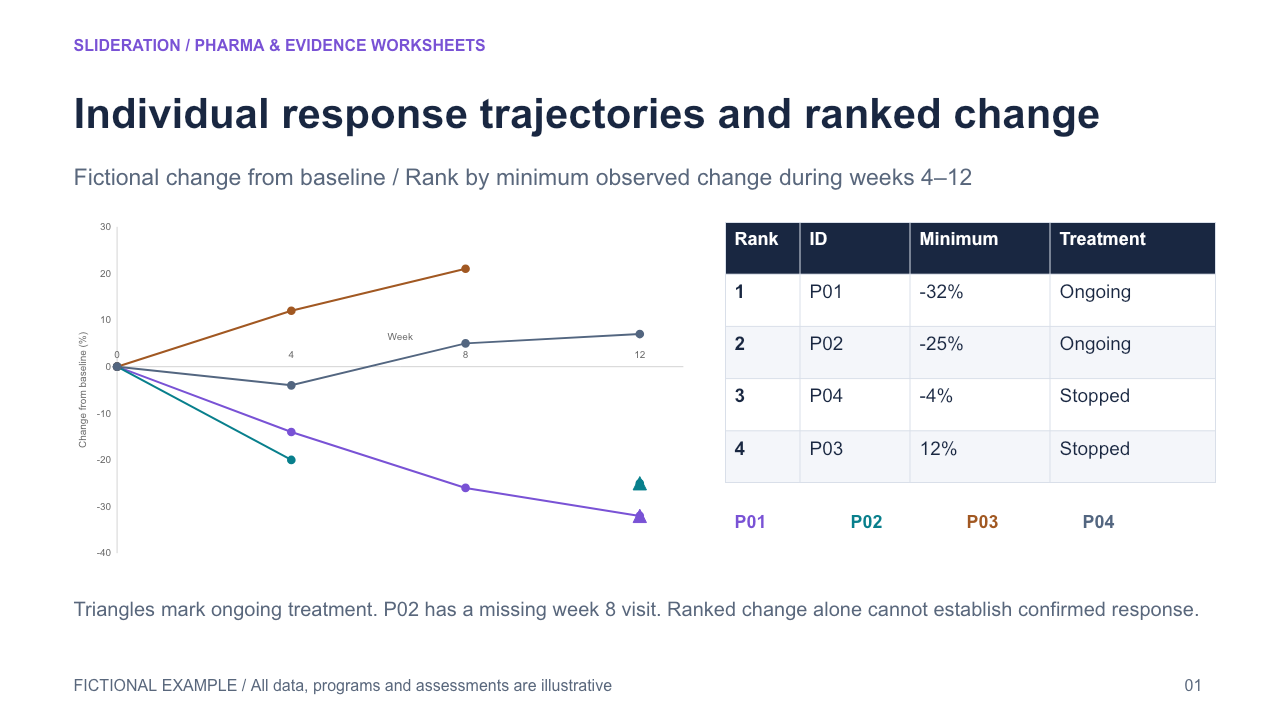
Individual response trajectories and ranked change — Link a ranked per-person change summary and longitudinal observations by the same participant identifiers. Retain timing and treatment status separately from response classification.
2 slides · 1 credit
Check inputs & editing effort →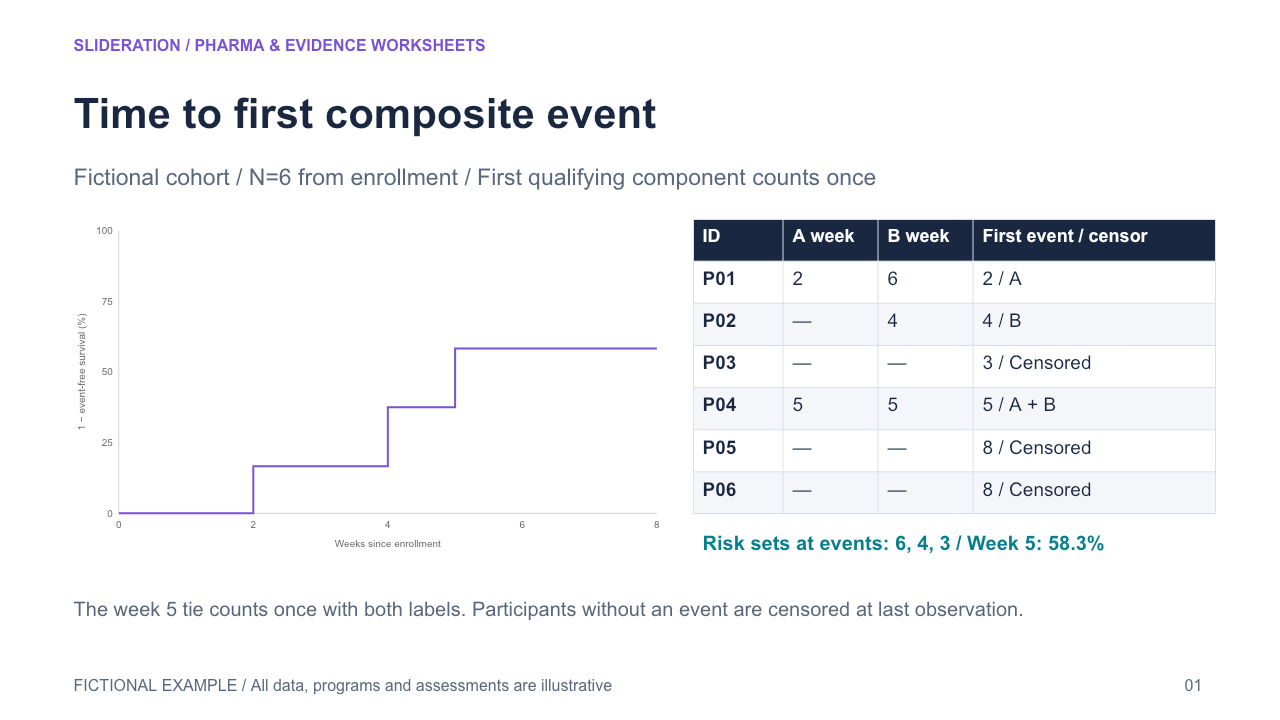
Time to first composite event — Identify the first qualifying event across multiple components for each participant, retain its type, and derive the event curve and risk set from those first-event and censoring times.
2 slides · 1 credit
Check inputs & editing effort →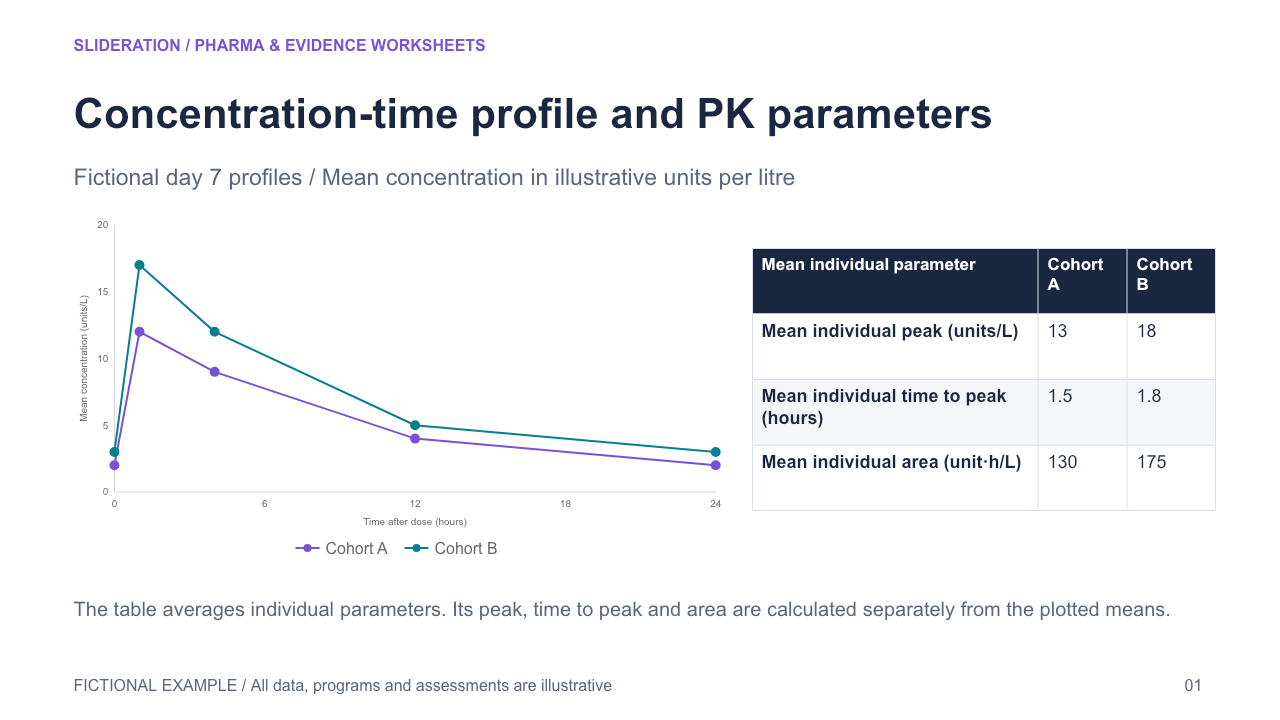
Concentration-time profile and PK parameters — Align a cohort concentration-time profile with separately summarized participant-level exposure parameters. Declare summary method, clock origin, sampling population and each parameter unit.
2 slides · 1 credit
Check inputs & editing effort →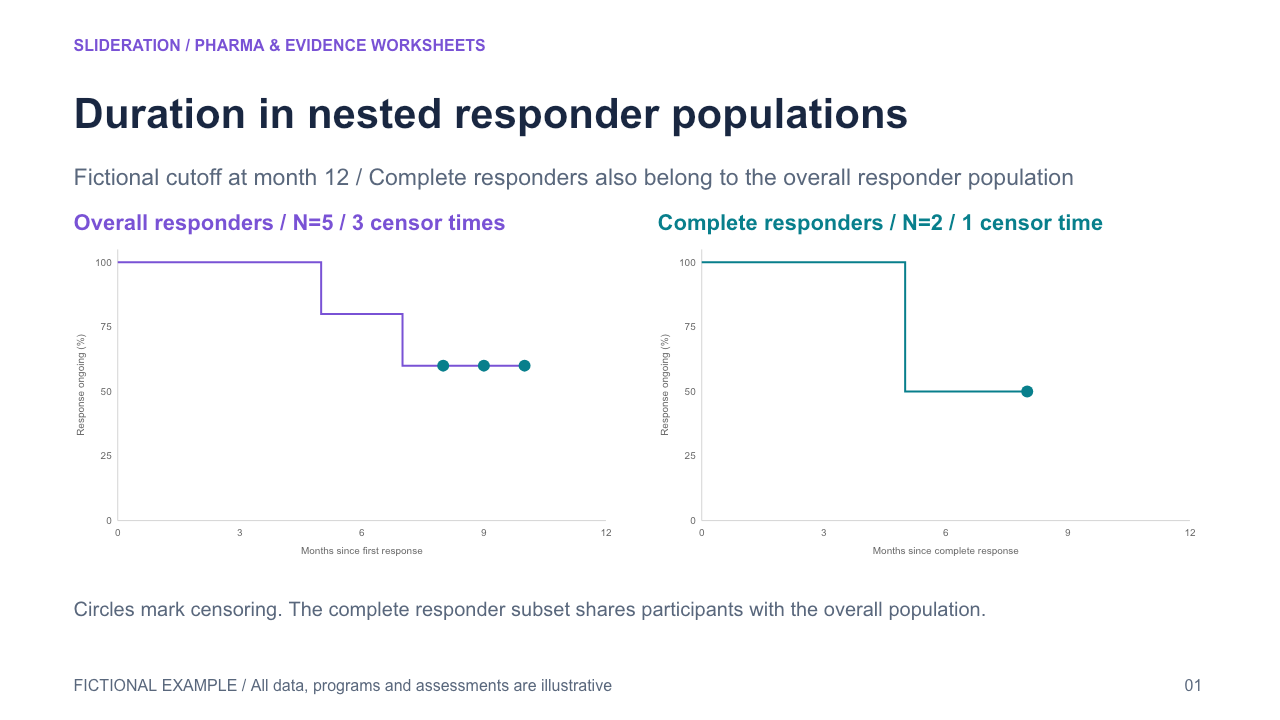
Duration in nested responder populations — Compare duration summaries for an overall responder set and a nested complete-response subset with distinct onset clocks, censoring rules and risk counts.
2 slides · 1 credit
Check inputs & editing effort →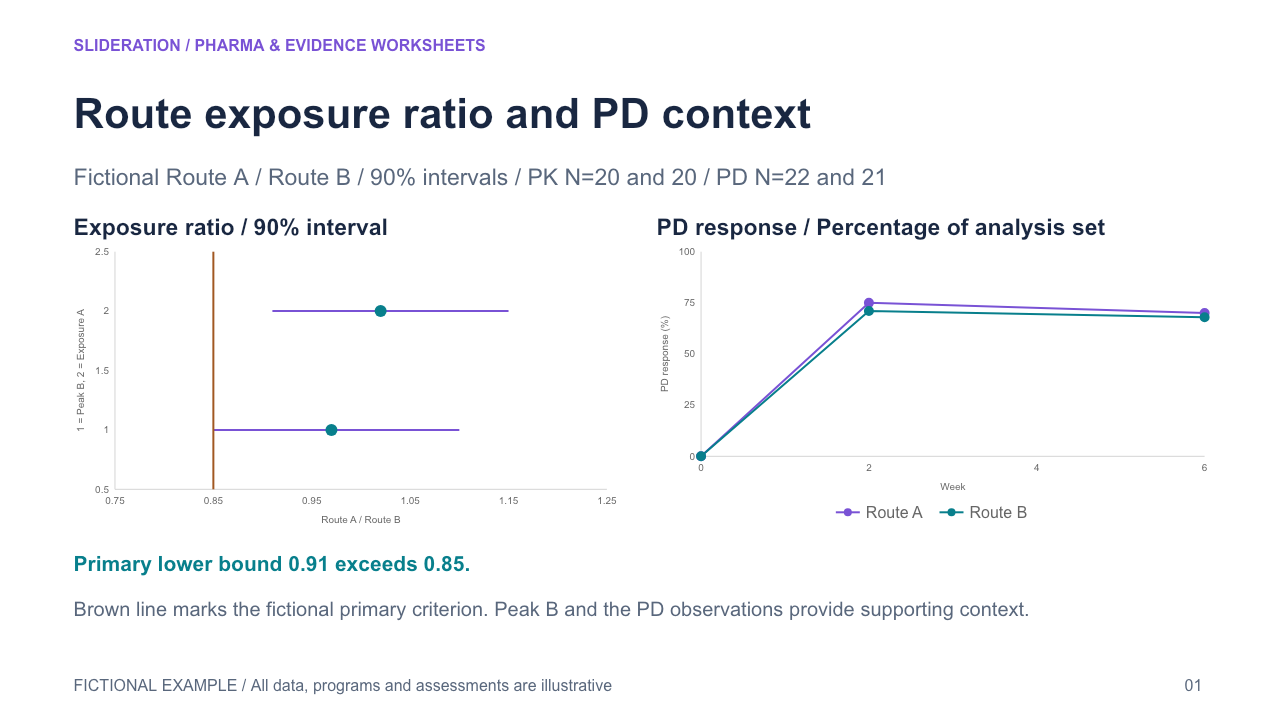
Route exposure ratio and PD context — Compare route-specific exposure metrics and a supplied test/reference ratio interval against its declared criterion, while displaying pharmacodynamic observations with a separate population and interpretation.
2 slides · 1 credit
Check inputs & editing effort →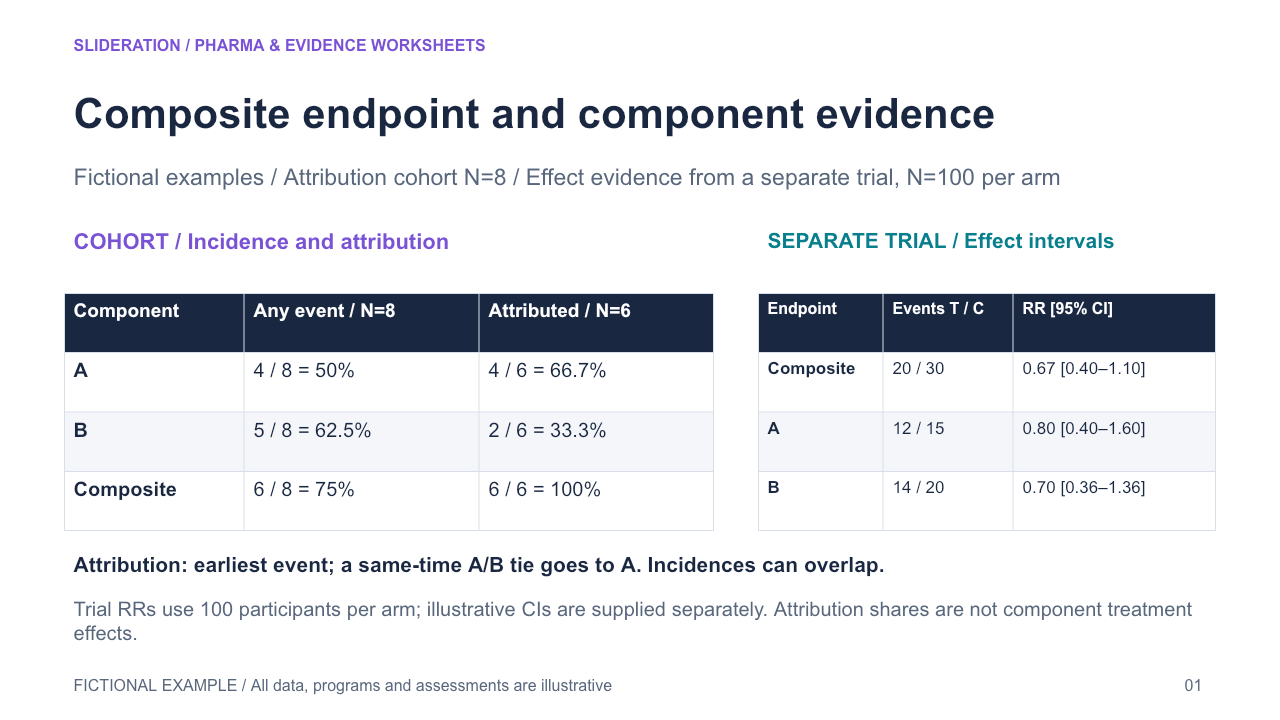
Composite endpoint and component evidence — Separate overlapping component incidences from mutually exclusive first-event attribution, and keep independent trial effects and intervals on their own population basis.
2 slides · 1 credit
Check inputs & editing effort →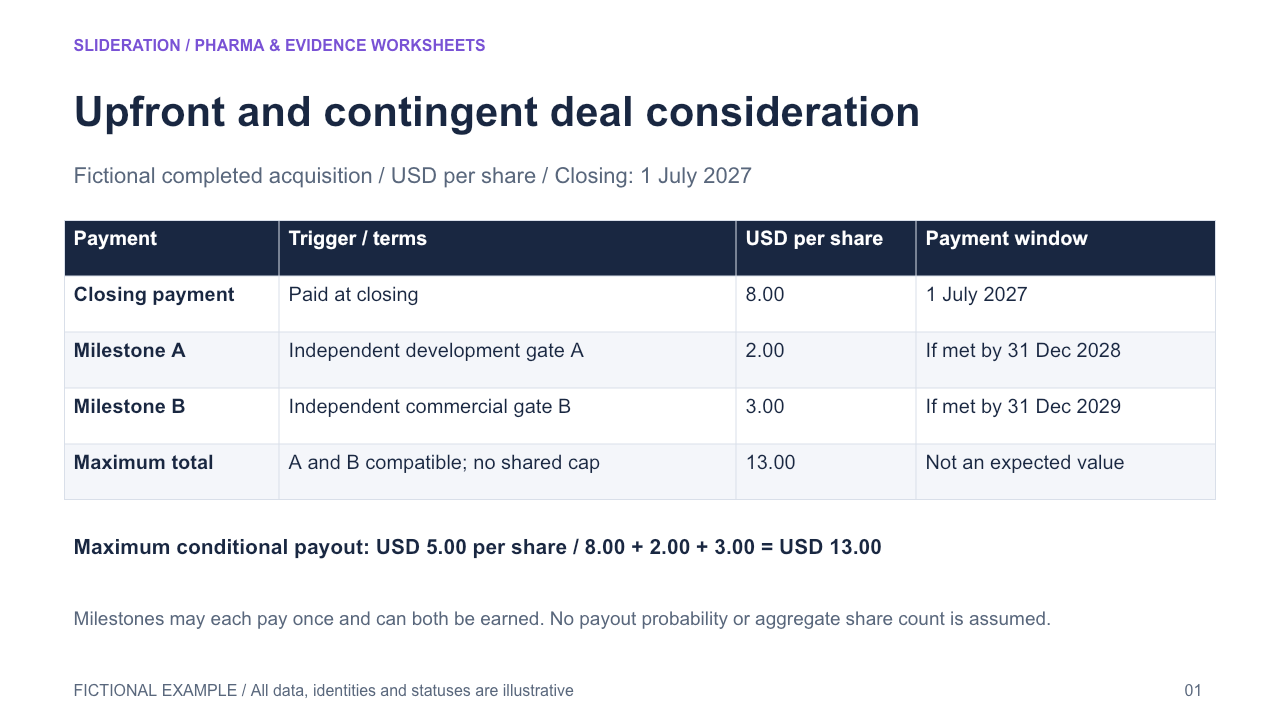
Upfront and contingent deal consideration — Separate closing consideration from individually conditional payouts. Each payout has a named trigger, payout unit and date or deadline when stated. Show the maximum conditional total without treating it as expected value. Deal mix and milestone timelines do not tie amounts to contractual gates.
2 slides · 1 credit
Check inputs & editing effort →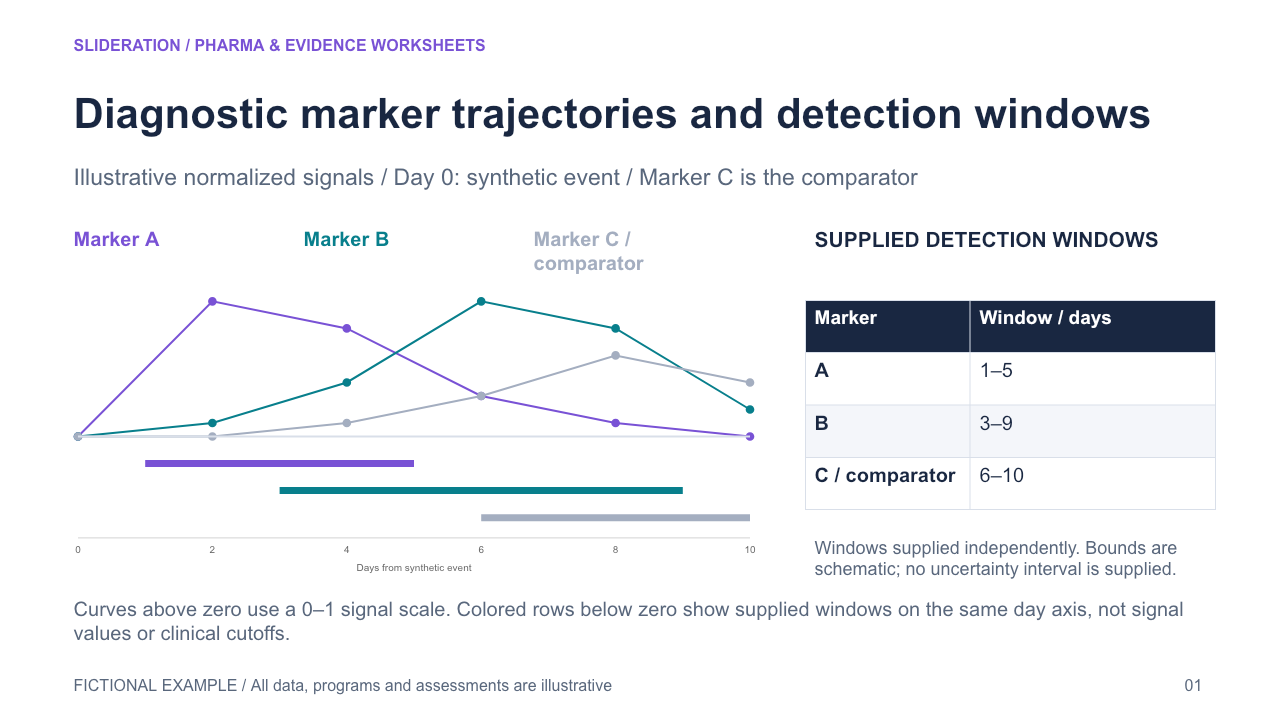
Diagnostic marker trajectories and detection windows — Align biomarker trajectories and test detection windows on a common time axis. Keep the comparator, window definition and uncertainty explicit. Existing threshold zones apply to one result scale, while ordinary line charts do not express marker-specific detection windows.
2 slides · 1 credit
Check inputs & editing effort →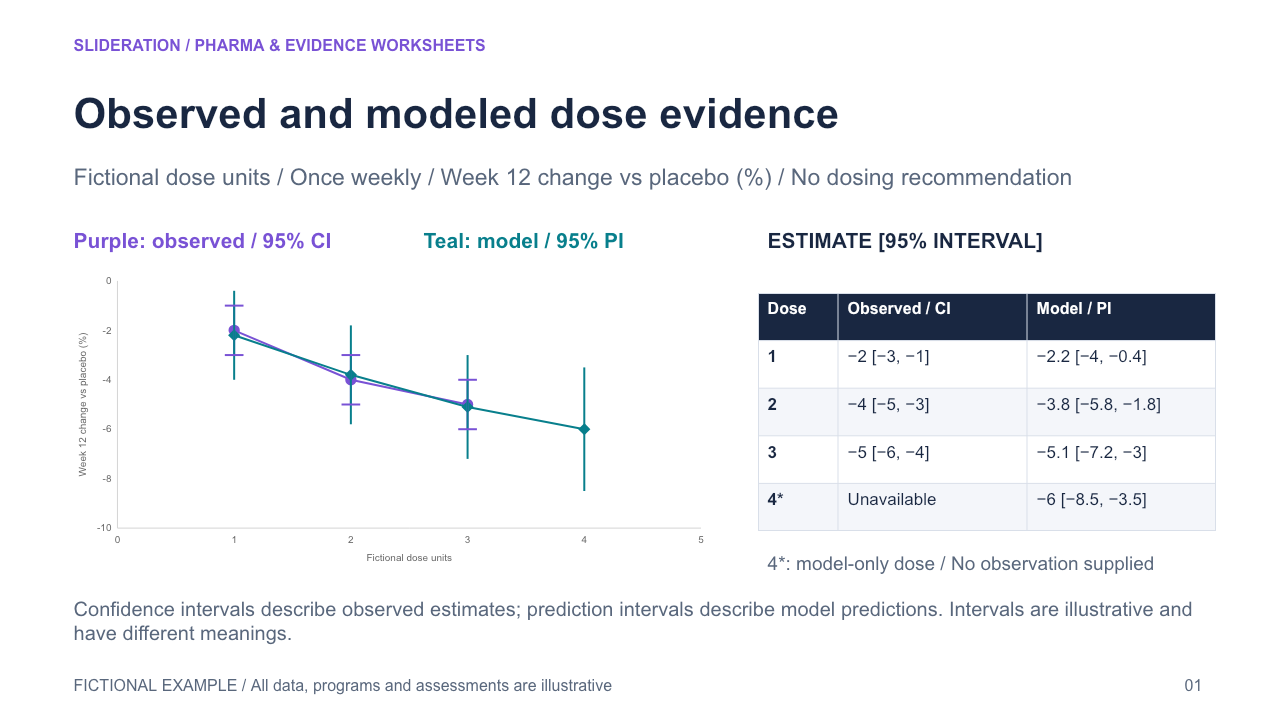
Observed and modeled dose evidence — Align observed and modeled estimates at matched doses, distinguish confidence and prediction intervals, and preserve a separate model-only dose with its evidence status. Existing dose-response readouts cover observed trajectories and do not align a modeled estimate and a distinct uncertainty type against each observed dose.
2 slides · 1 credit
Check inputs & editing effort →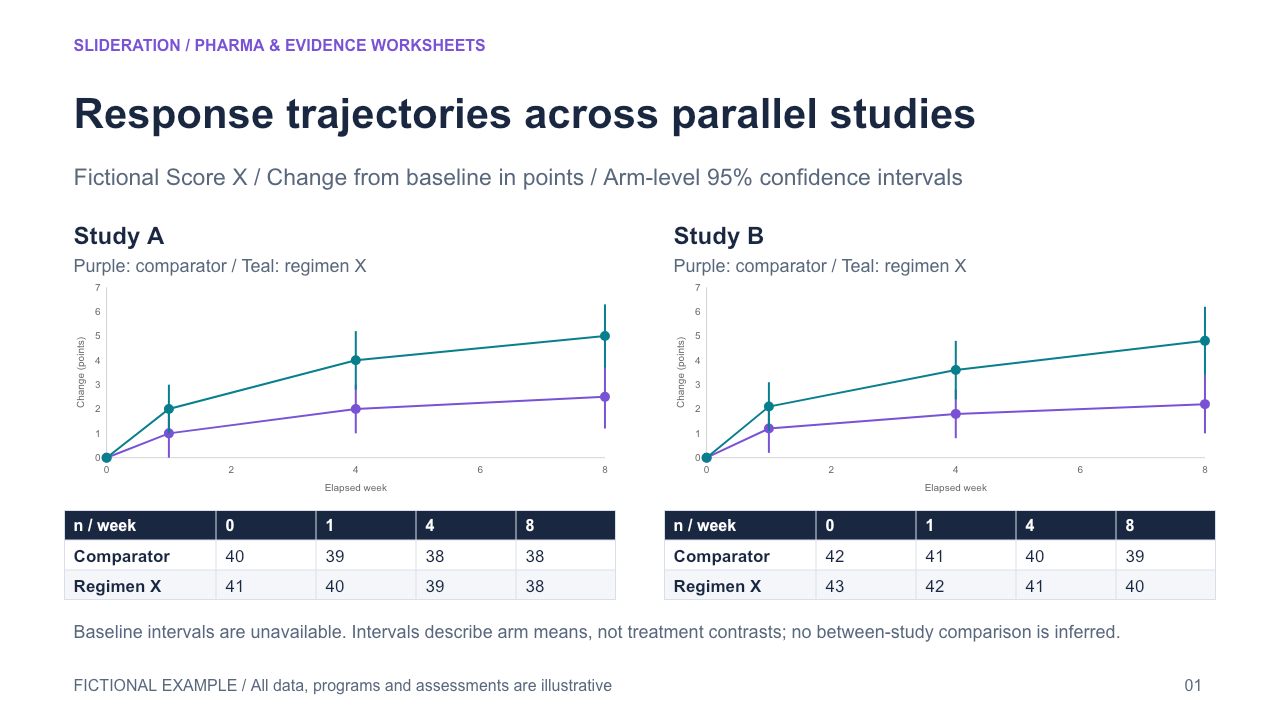
Response trajectories across parallel studies — Present aligned visit-time axes in separate study panels with an editable curve and confidence intervals for each arm. Preserve per-visit sample sizes and study-specific comparison definitions. Existing small multiples do not carry per-visit uncertainty, the dose-response template summarizes intervals at a selected endpoint, and nested duration curves compare overlapping analysis sets.
2 slides · 1 credit
Check inputs & editing effort →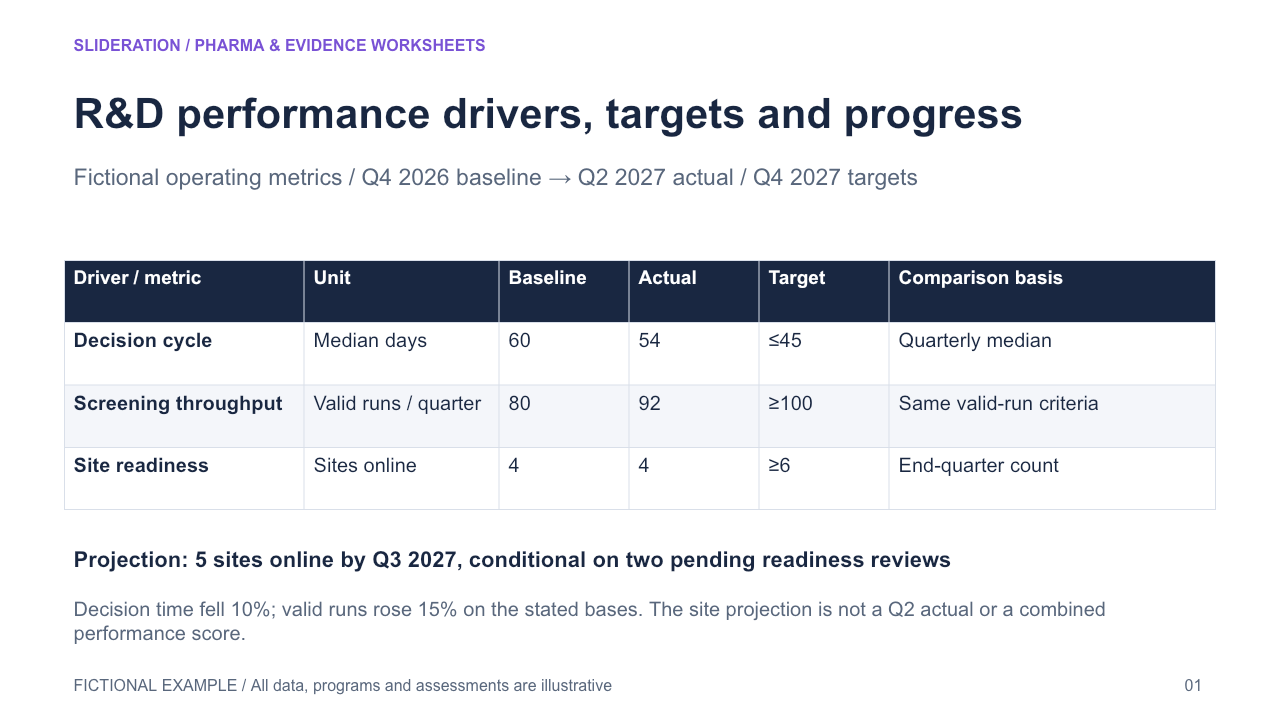
R&D performance drivers, targets and progress — Compare baseline, actual and target values for independent R&D drivers with explicit units and definitions; record conditional projections separately from actual observations.
2 slides · 1 credit
Check inputs & editing effort →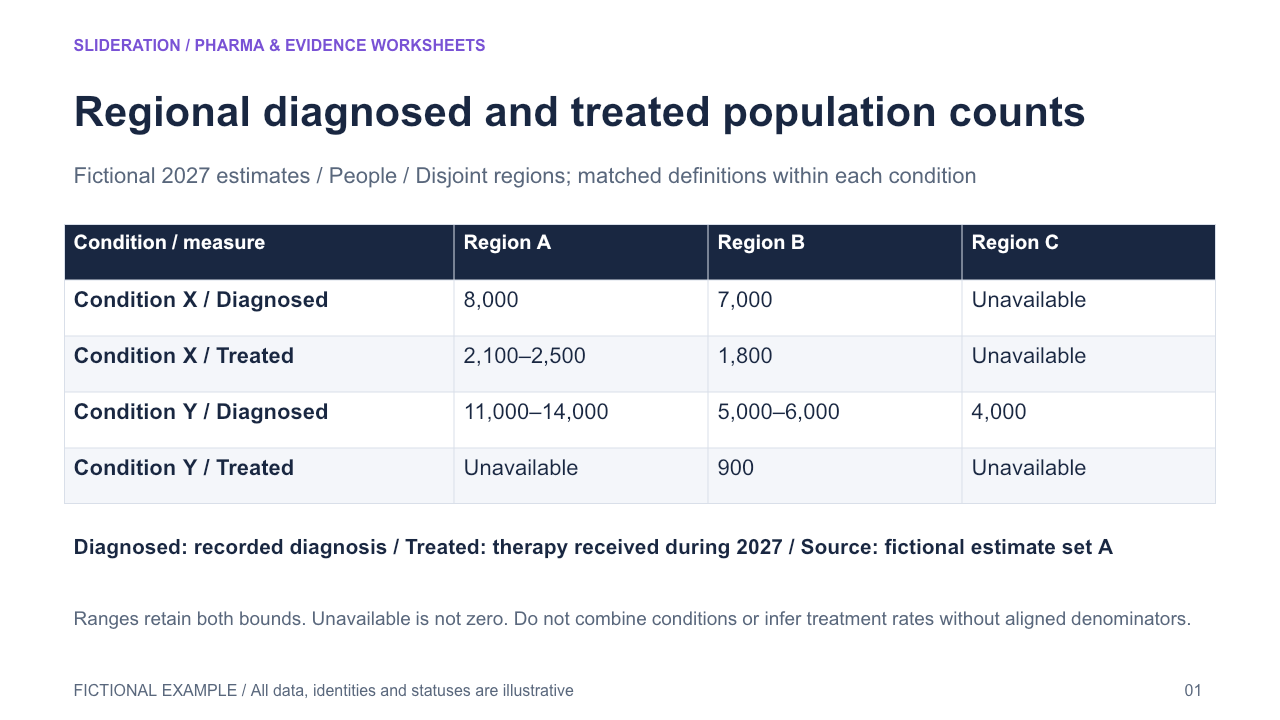
Regional diagnosed and treated population counts — Compare population measures by indication and geography while keeping definitions, vintage, ranges and missing cells adjacent to estimates. Existing geographic grids compare priorities or statuses, stacked charts expect additive values, and diagnostic performance matrices compare a reference-standard classification.
2 slides · 1 credit
Check inputs & editing effort →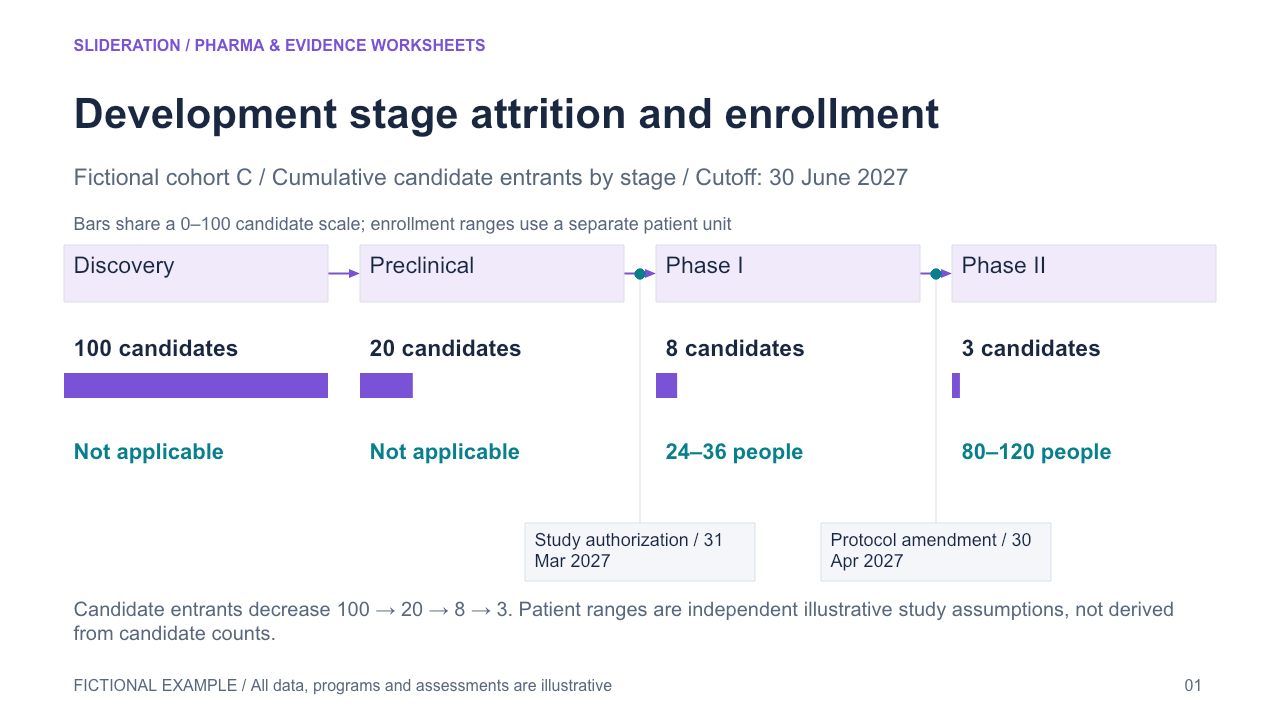
Development stage attrition and enrollment — Align candidate attrition and stage-specific enrollment on the same stage axis while separating their units and populations. Place regulatory checkpoints between the relevant stages. The existing roadmap, funnel and trial-cohort layouts cover these relationships separately.
2 slides · 1 credit
Check inputs & editing effort →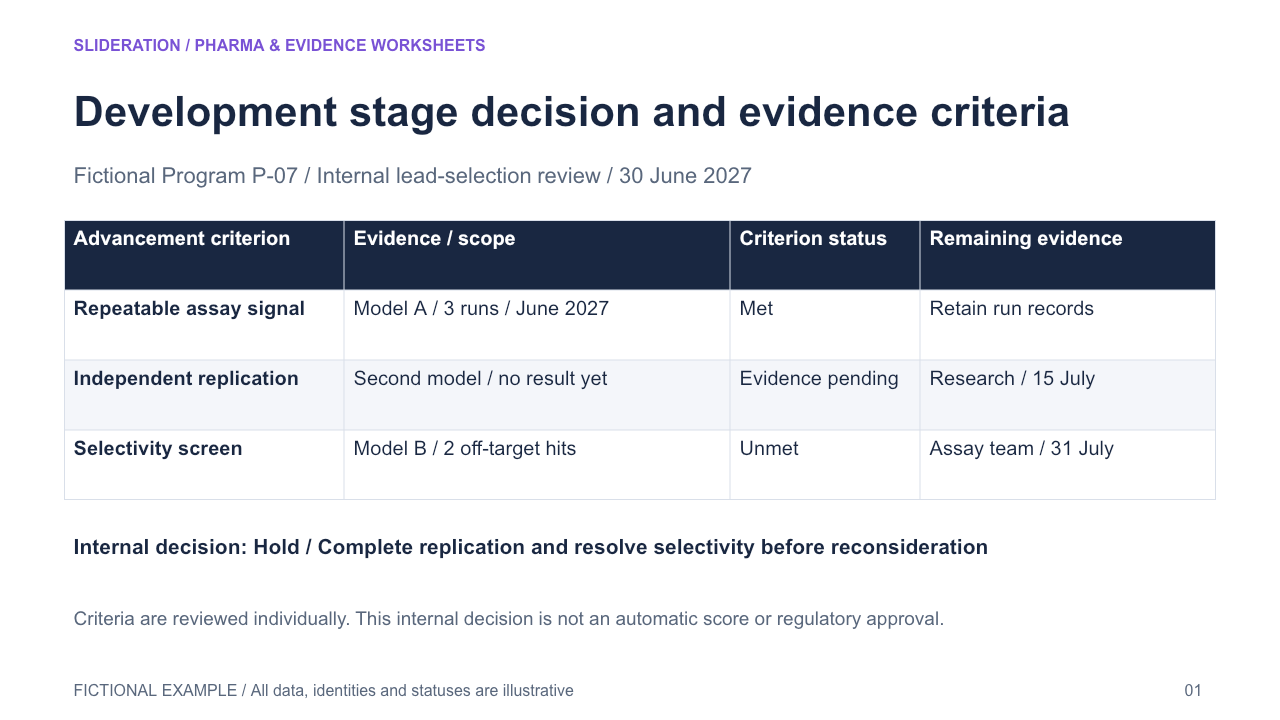
Development stage decision and evidence criteria — Tie each internal advancement criterion to a separate evidence statement and criterion-level status, then record the overall decision and remaining evidence plan. Milestone and uncertainty templates cover timing or limitations without recording criterion-by-criterion advancement judgments.
2 slides · 1 credit
Check inputs & editing effort →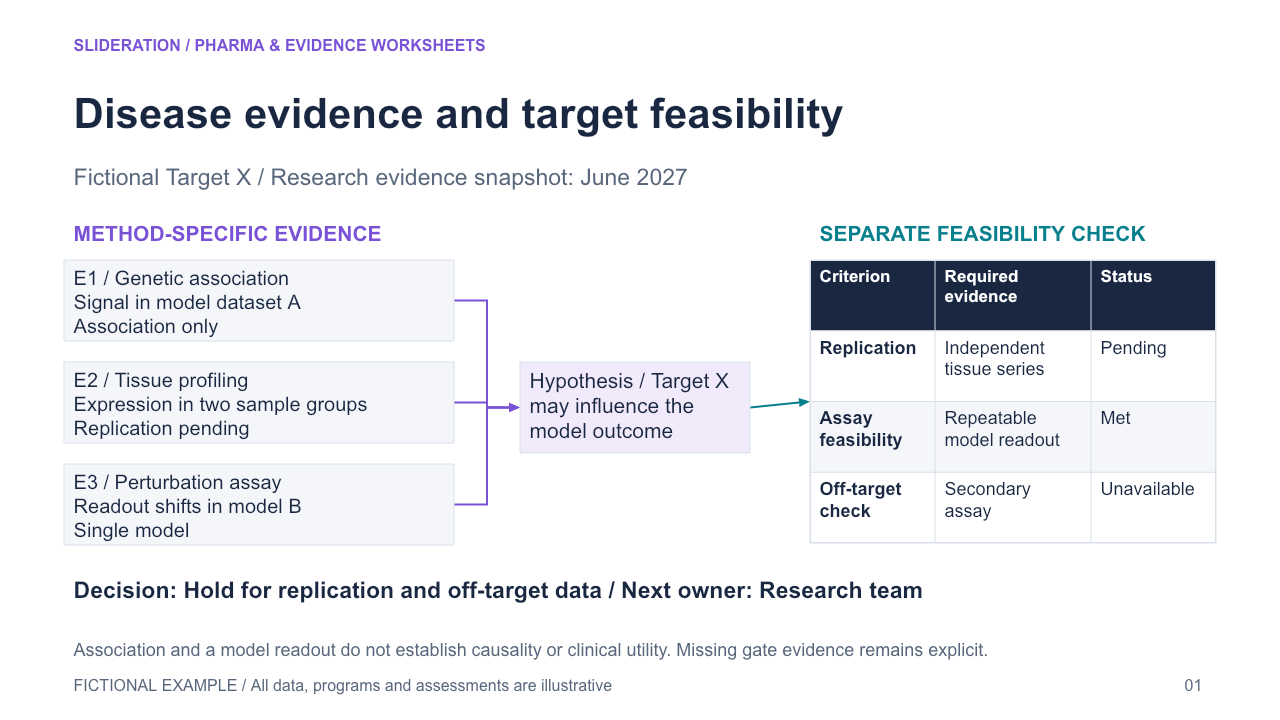
Disease evidence and target feasibility — Connect evidence from distinct methods to a named target hypothesis, then apply a separately evidenced feasibility gate and retain the decision rationale. The mechanism evidence map records readouts and limitations, while the stage roadmap does not retain evidence by method or explicit gate outcomes.
2 slides · 1 credit
Check inputs & editing effort →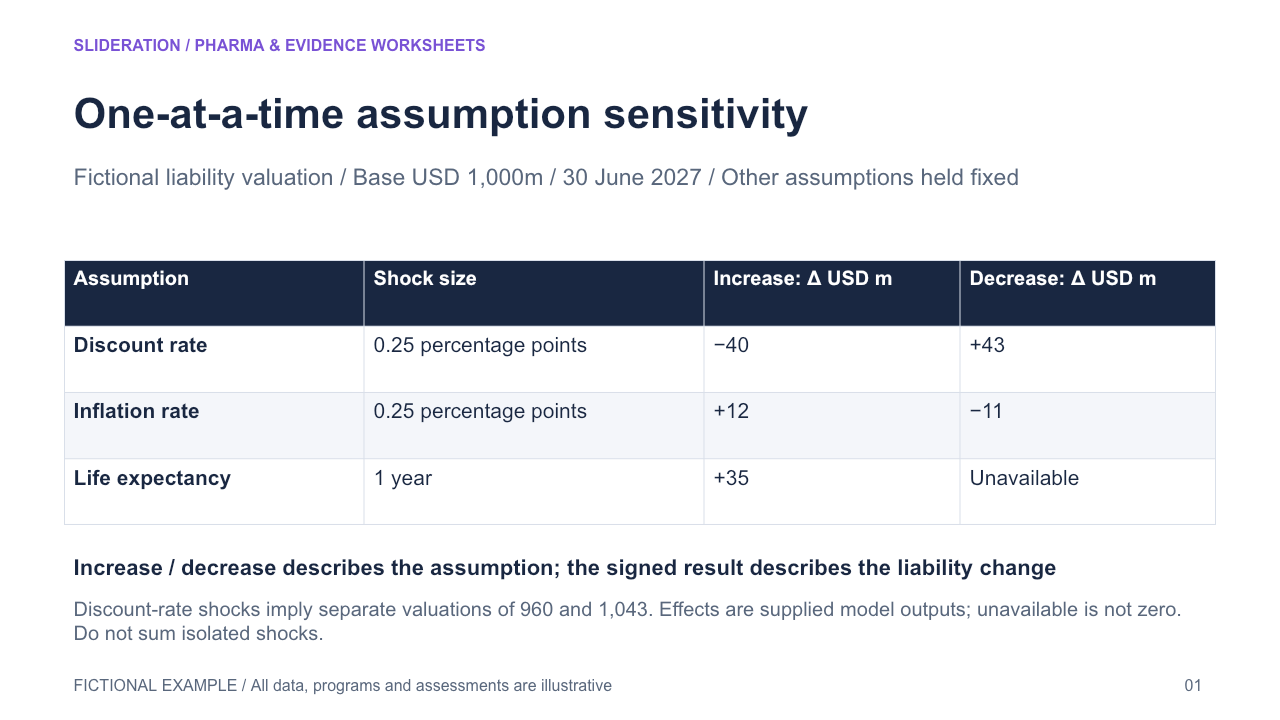
One-at-a-time assumption sensitivity — Keep the valuation baseline and one-assumption-at-a-time method with a shock unit for each assumption and separate increase/decrease responses. Preserve asymmetry and unavailable directions. Paired comparison bars do not identify perturbation sizes; FX scenarios change paths over time; observed/model evidence distinguishes uncertainty rather than isolated input shocks.
2 slides · 1 credit
Check inputs & editing effort →