Disease evidence and target feasibility PowerPoint Template
Editable disease evidence and target feasibility worksheet with a fictional worked example and a fill-in slide. Preview both pages; download the 2-slide PPTX for 1 credit.
View in library · PPTX · 1 credit
Sign in to download. One credit unlocks the complete 2-slide file; repeat downloads are free.
When to use this template
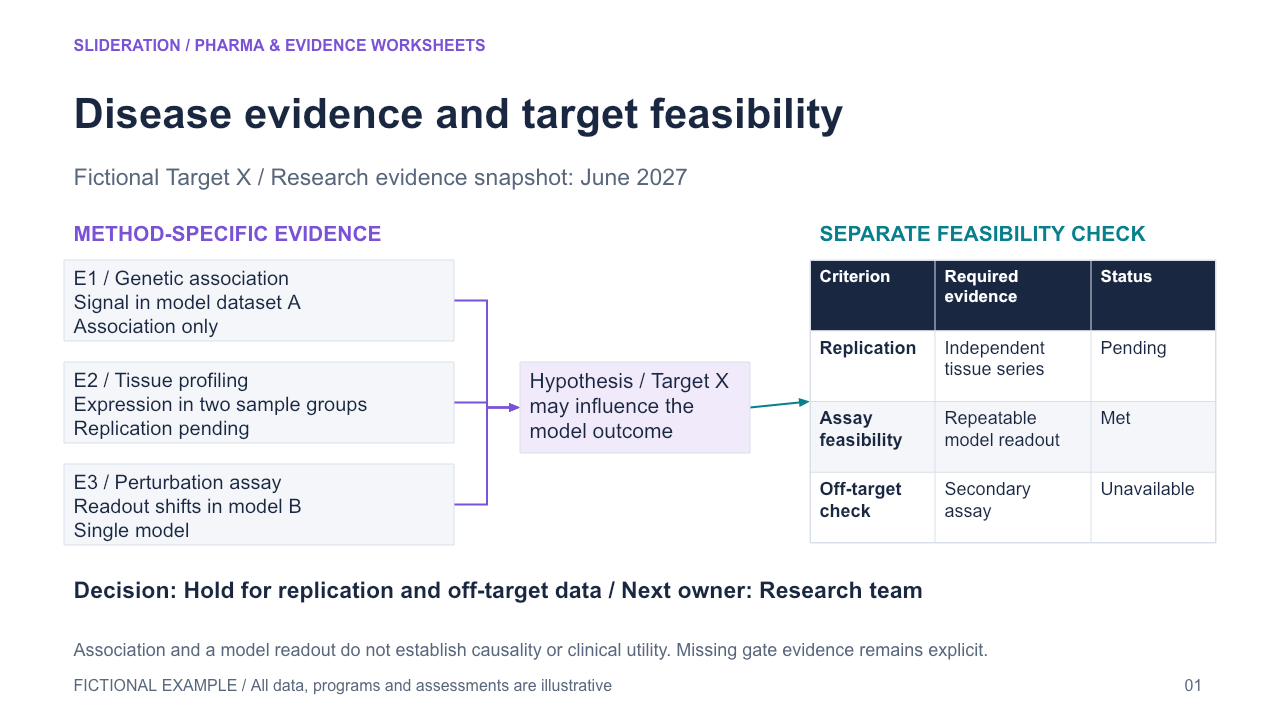
Connect evidence from distinct methods to a named target hypothesis, then apply a separately evidenced feasibility gate and retain the decision rationale. The mechanism evidence map records readouts and limitations, while the stage roadmap does not retain evidence by method or explicit gate outcomes.
What you can edit
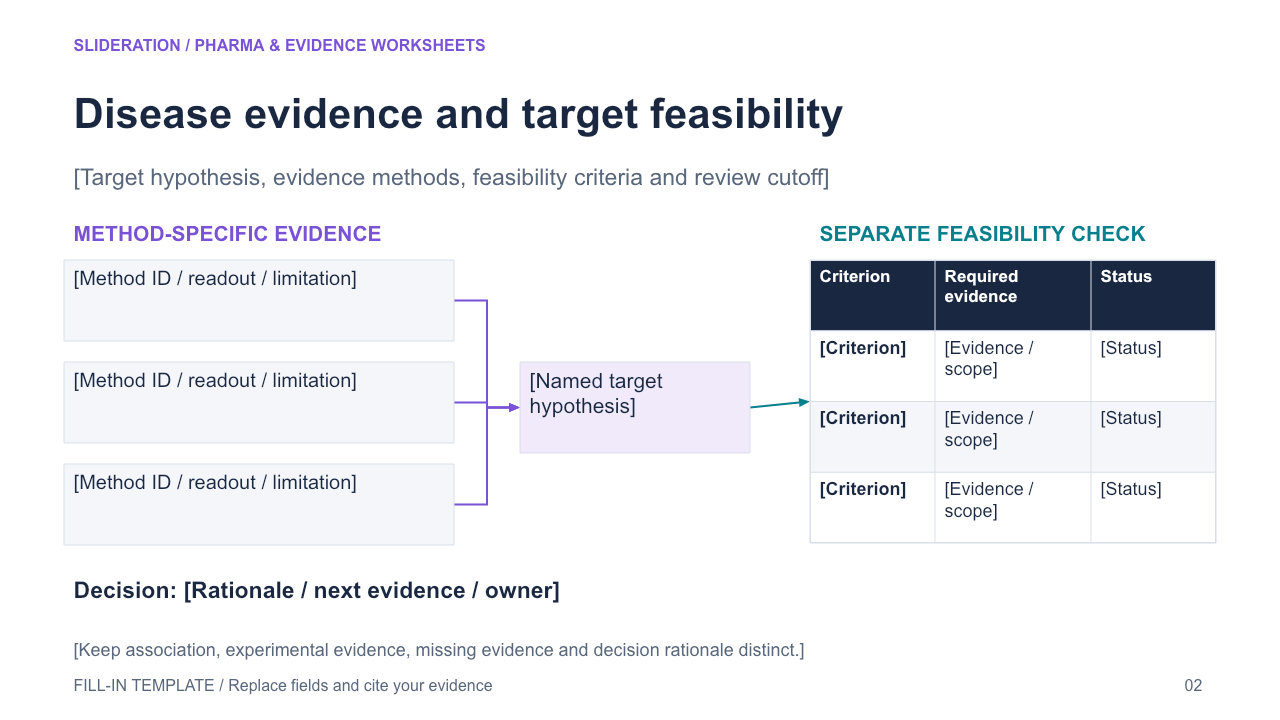
Edit the text, table cells and any native chart data in PowerPoint. The second slide keeps the structure and provides replacement fields. Chart templates use zero seed values on the fill-in slide; replace these together with the associated definitions and tables.
Use the evidence correctly
Use fictional evidence and gate criteria. Keep association, experimental readout, feasibility and the decision distinct. Label missing evidence explicitly and avoid inferring causal validity or clinical utility.
- Define your population, reporting period, measures and evidence sources.
- Duplicate the fill-in slide and replace every bracketed field and chart value.
- Check units, denominators, labels and conclusions against your source before presenting.
View in library · PPTX · 1 credit
Sign in to download. One credit unlocks the complete 2-slide file; repeat downloads are free.
All example content is fictional. Original Slideration template; no company endorsement. Use in your own presentations and client work under our slide licence. Redistribution or resale of template files is not permitted.
Will this fit your material?
- Expression purpose
- Summarise a recommendation · Present evidence and uncertainty
- Structure in this file
- Disease evidence and target feasibility — Connect evidence from distinct methods to a named target hypothesis, then apply a separately evidenced feasibility gate and retain the decision rationale. The mechanism evidence map records readouts and limitations, while the stage roadmap does not retain evidence by method or explicit gate outcomes.
- Prepare before editing
- One proposed action, supporting reasons, evidence and a specific decision request.
- Density and capacity
- Use the preview’s existing number of panels, rows and labels as your starting capacity. For more content, split the story across slides before shrinking text. Table dimensions below describe this file, not a maximum.
- Choose another layout when
- Use fictional evidence and gate criteria. Keep association, experimental readout, feasibility and the decision distinct. Label missing evidence explicitly and avoid inferring causal validity or clinical utility.
- Editing effort
- Use a short headline and supporting points. Separate observed results from assumptions. This is an editable template, not automatic content replacement. You supply and verify the content.
What can I edit?
- Native PowerPoint tables: 4 rows × 3 columns on the first slide, including any header rows. Edit cells directly.
- First-row fields: Criterion / Required evidence / Status. Replace these fields and their associated values together.
- No native chart on the first slide. Chart-like graphics use individual objects; update shapes and labels separately rather than expecting an Excel data sheet.
- Text and shapes remain editable. Check the preview for any illustrative pictures; picture content is replaced as an image.
2 slide(s) in the complete file. Includes a worked example and a fill-in slide.