Rail, an S-curve population chart
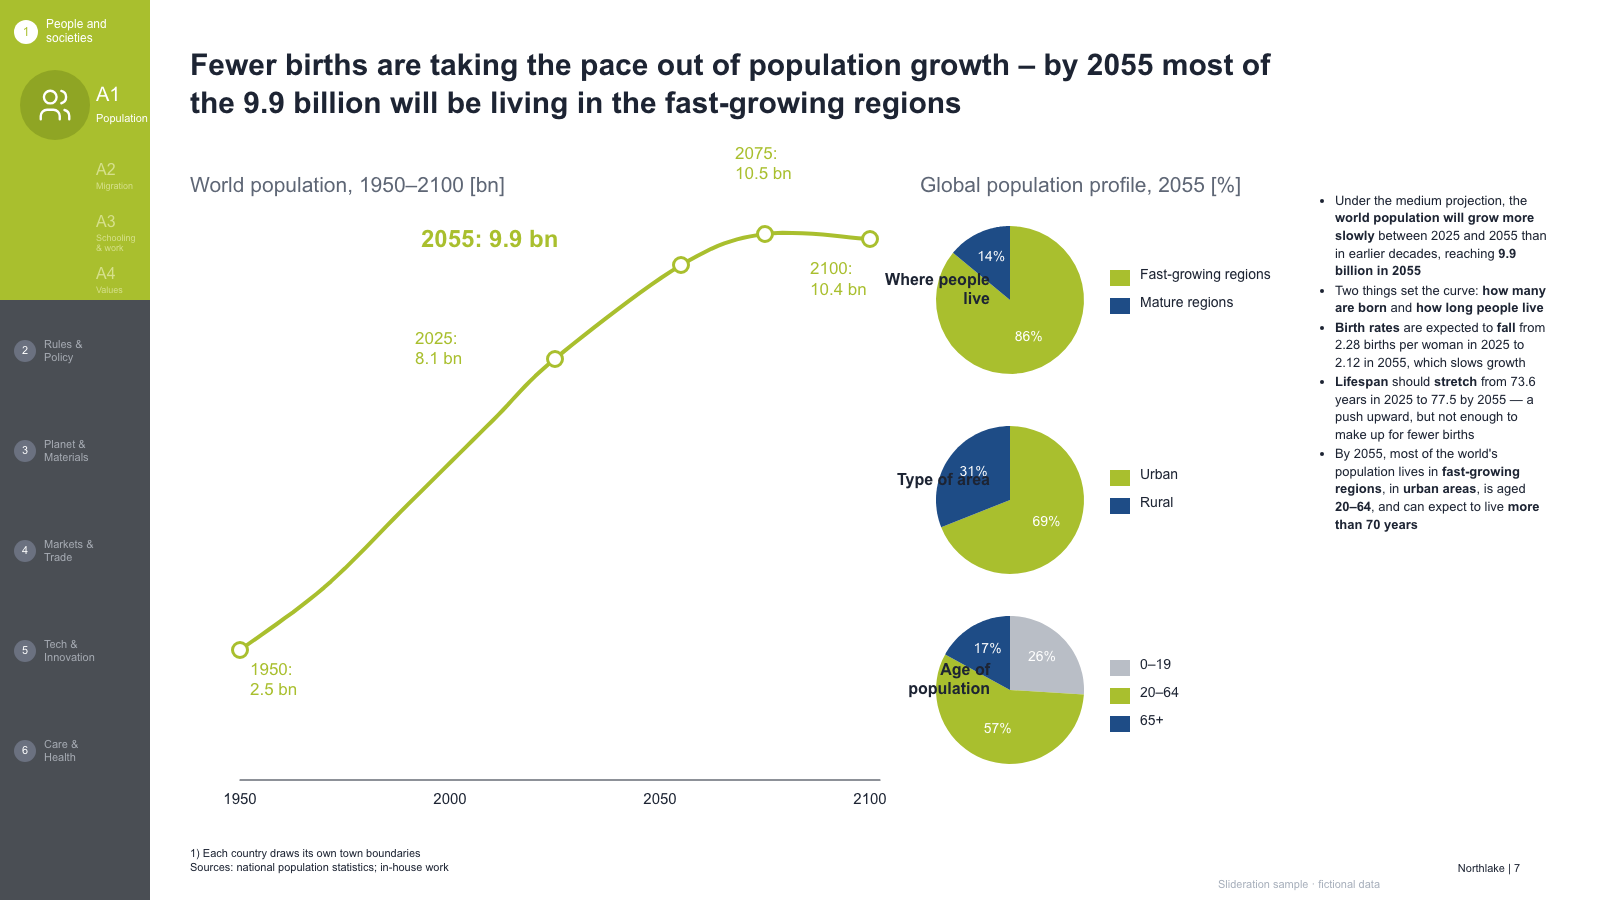
Rail, an S-curve population chart with year callouts, three small pies and a bullet column
Open in library · PPTX · 1 credit
Sign in to unlock this complete file. Repeat downloads are free.
Will this fit your material?
- Expression purpose
- Explain a numerical change
- Structure in this file
- Rail, an S-curve population chart with year callouts, three small pies and a bullet column
- Prepare before editing
- A baseline, an ending value, signed contributions or a consistently defined time series.
- Density and capacity
- Use the preview’s existing number of panels, rows and labels as your starting capacity. For more content, split the story across slides before shrinking text. Table dimensions below describe this file, not a maximum.
- Choose another layout when
- A trend does not establish causation. Do not use a bridge when the components do not reconcile.
- Editing effort
- For a bridge, contributions must reconcile. For a trend, keep the period and unit consistent. This is an editable template, not automatic content replacement. You supply and verify the content.
What can I edit?
- No native chart on the first slide. Chart-like graphics use individual objects; update shapes and labels separately rather than expecting an Excel data sheet.
- Text and shapes remain editable. Check the preview for any illustrative pictures; picture content is replaced as an image.
1 slide(s) in the complete file. A single editable example slide; replace the example content.
Replace the example material with your own verified content. Use licence: own presentations and client work; no template redistribution or resale.