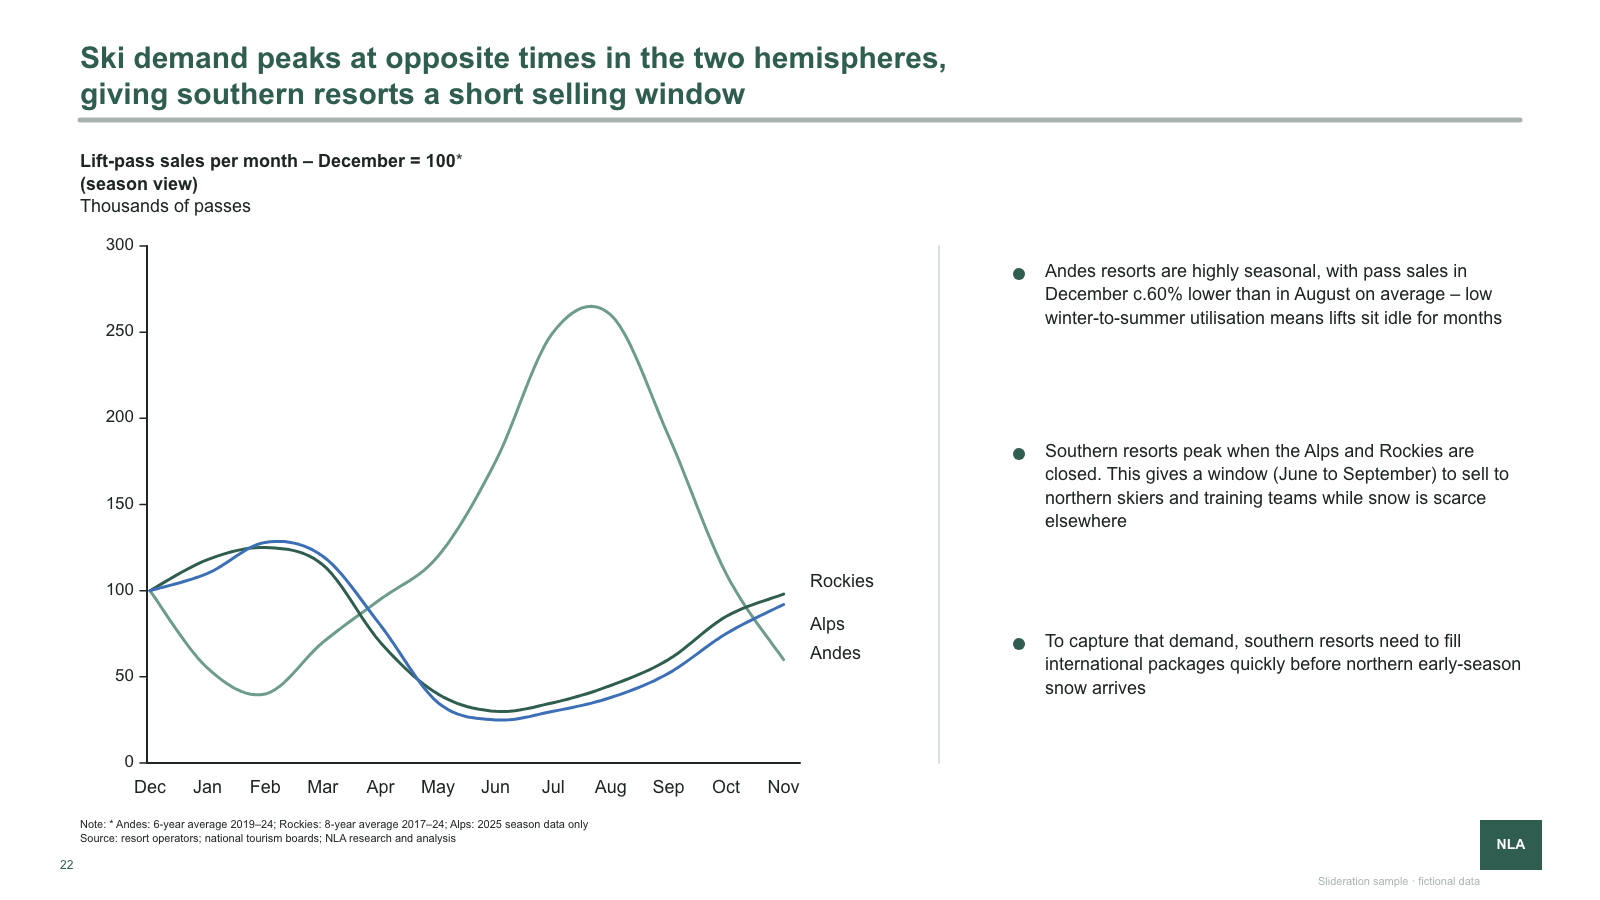
Multi-series monthly line chart
Multi-series monthly line chart with end labels and a right-hand commentary column
1 slides · 1 credit
Check inputs & editing effort →What changed, and what contributed?
Bring: A baseline, an ending value, signed contributions or a consistently defined time series.
Fit check: A trend does not establish causation. Do not use a bridge when the components do not reconcile.
41 editable templates. Open a template to check its structure and editing requirements.
Multi-series monthly line chart with end labels and a right-hand commentary column
1 slides · 1 credit
Check inputs & editing effort →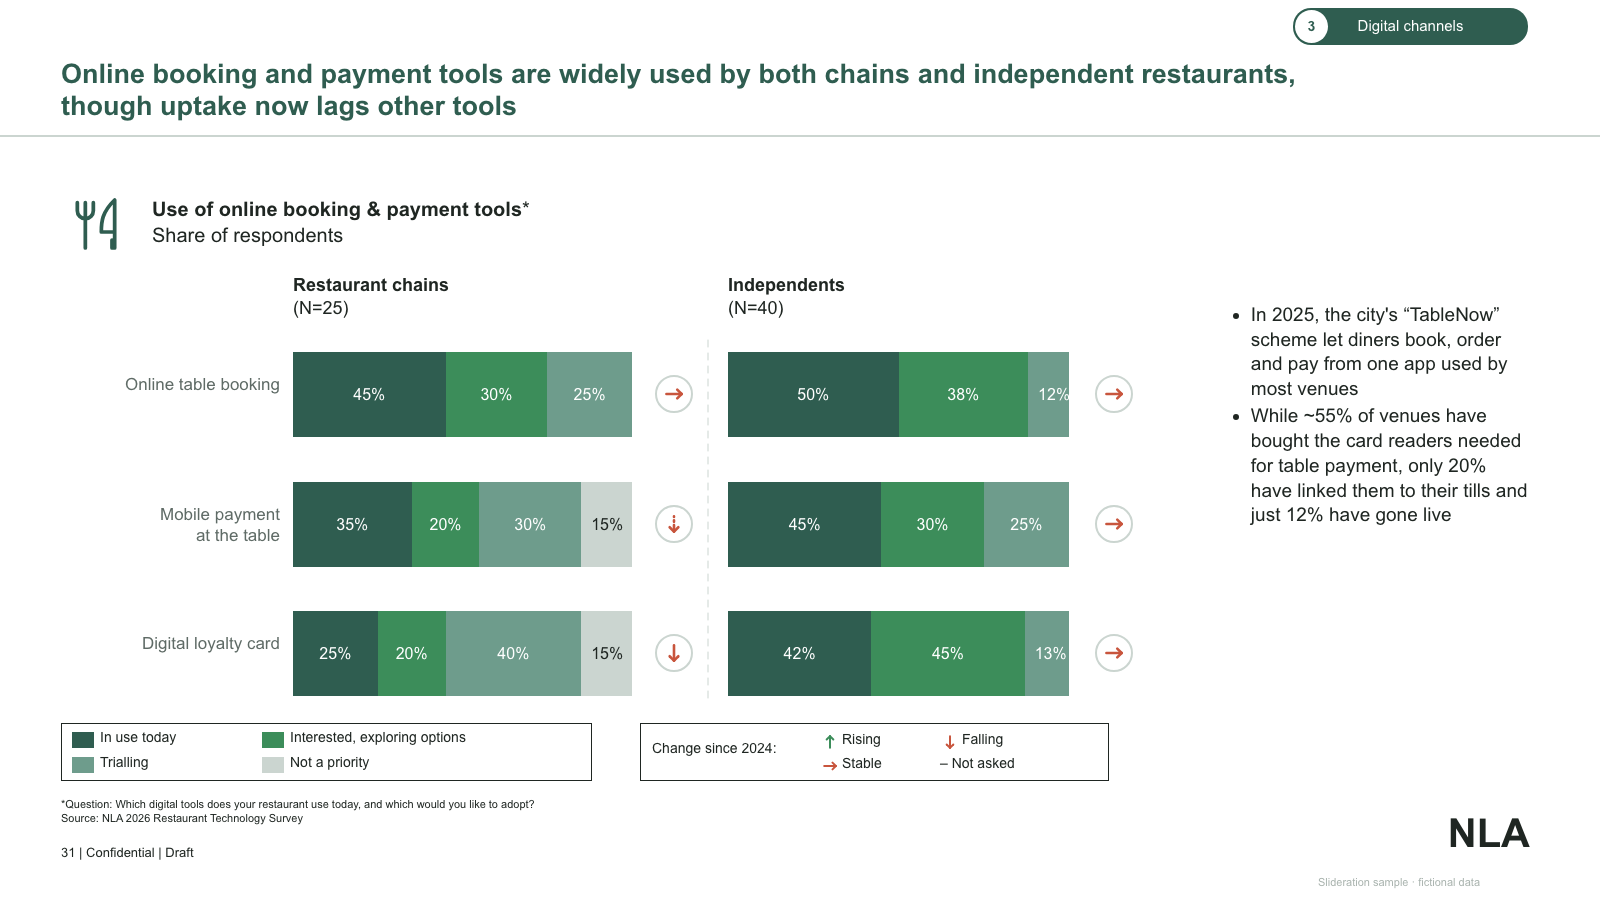
Two groups of 100% stacked horizontal bars with trend arrows, legends and side commentary
1 slides · 1 credit
Check inputs & editing effort →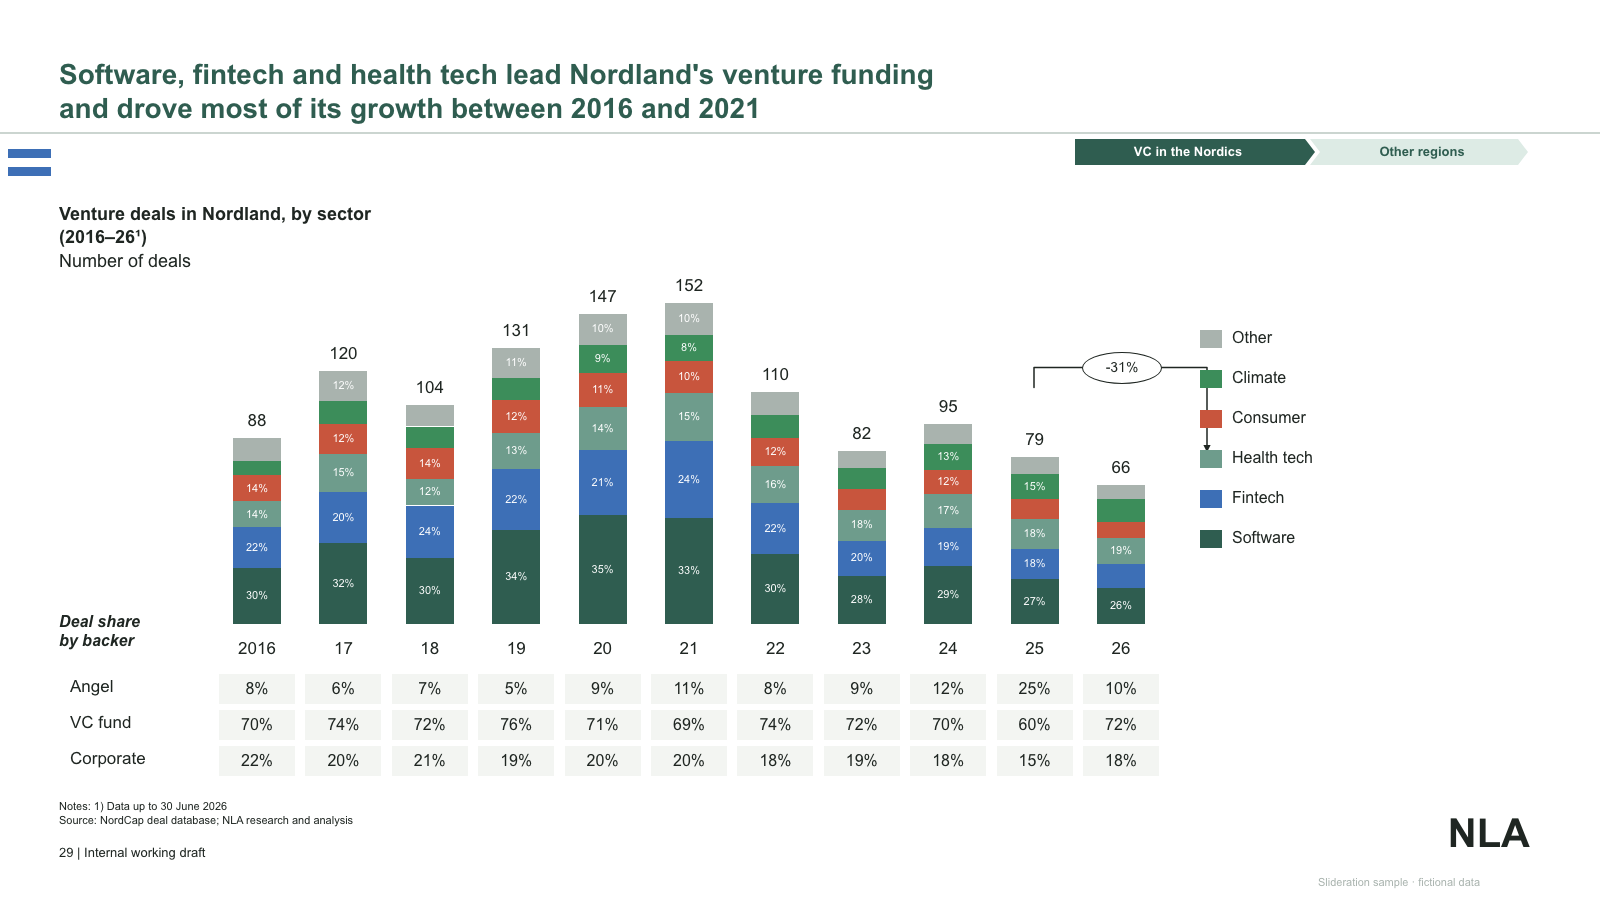
Stacked column chart by year with totals, a change bracket, category legend and investor-mix table
1 slides · 1 credit
Check inputs & editing effort →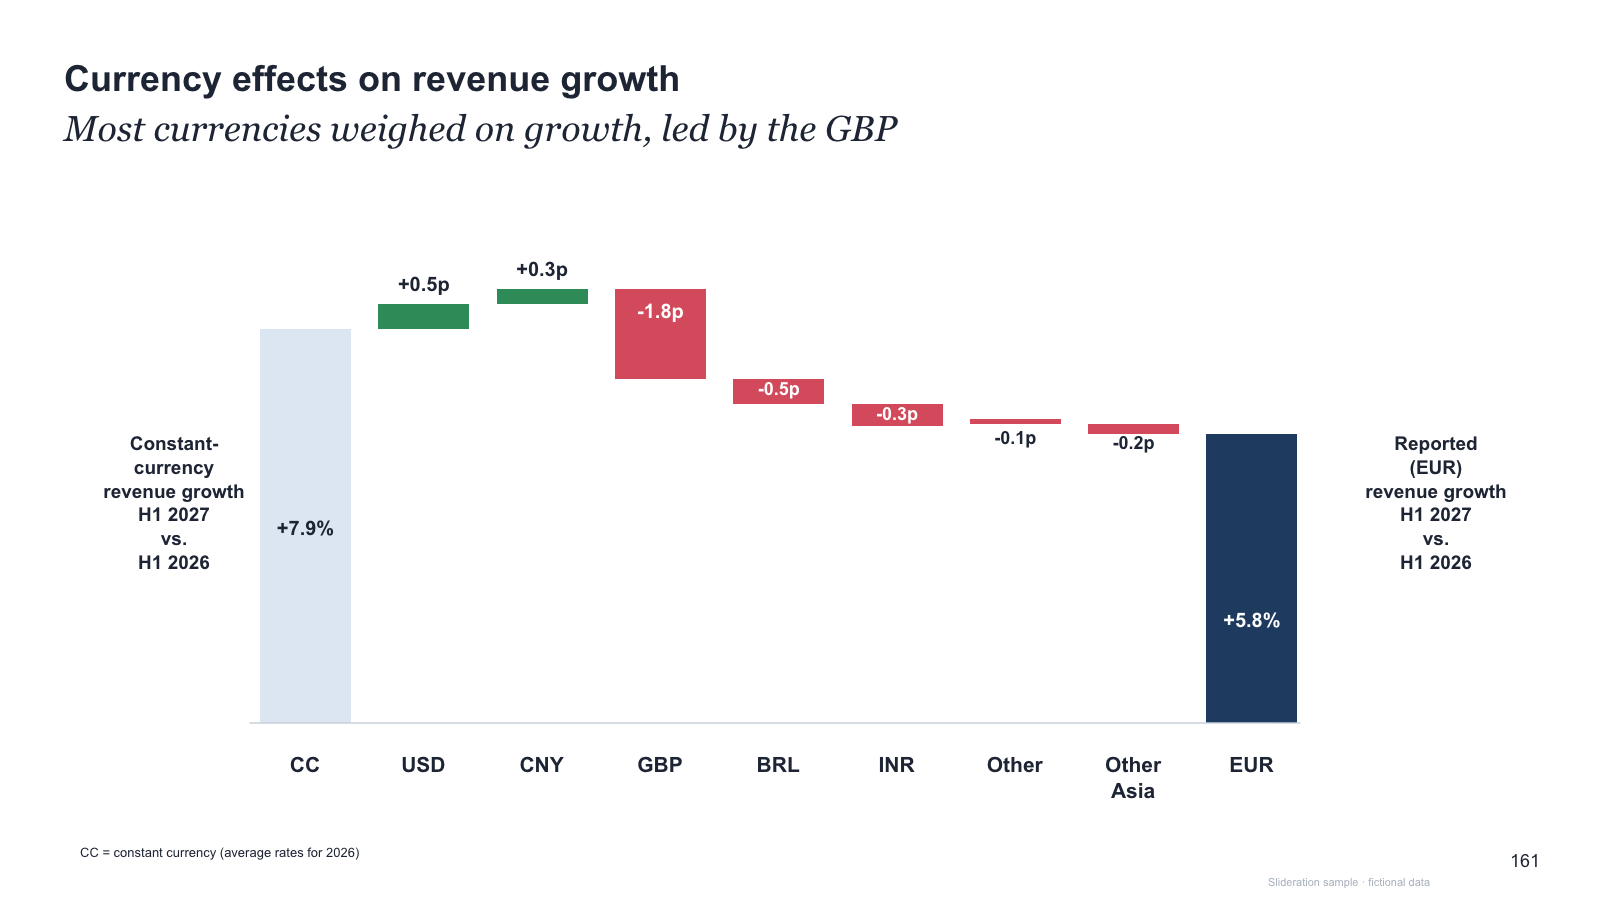
Currency-bridge waterfall with side labels for start and end growth rates
1 slides · 1 credit
Check inputs & editing effort →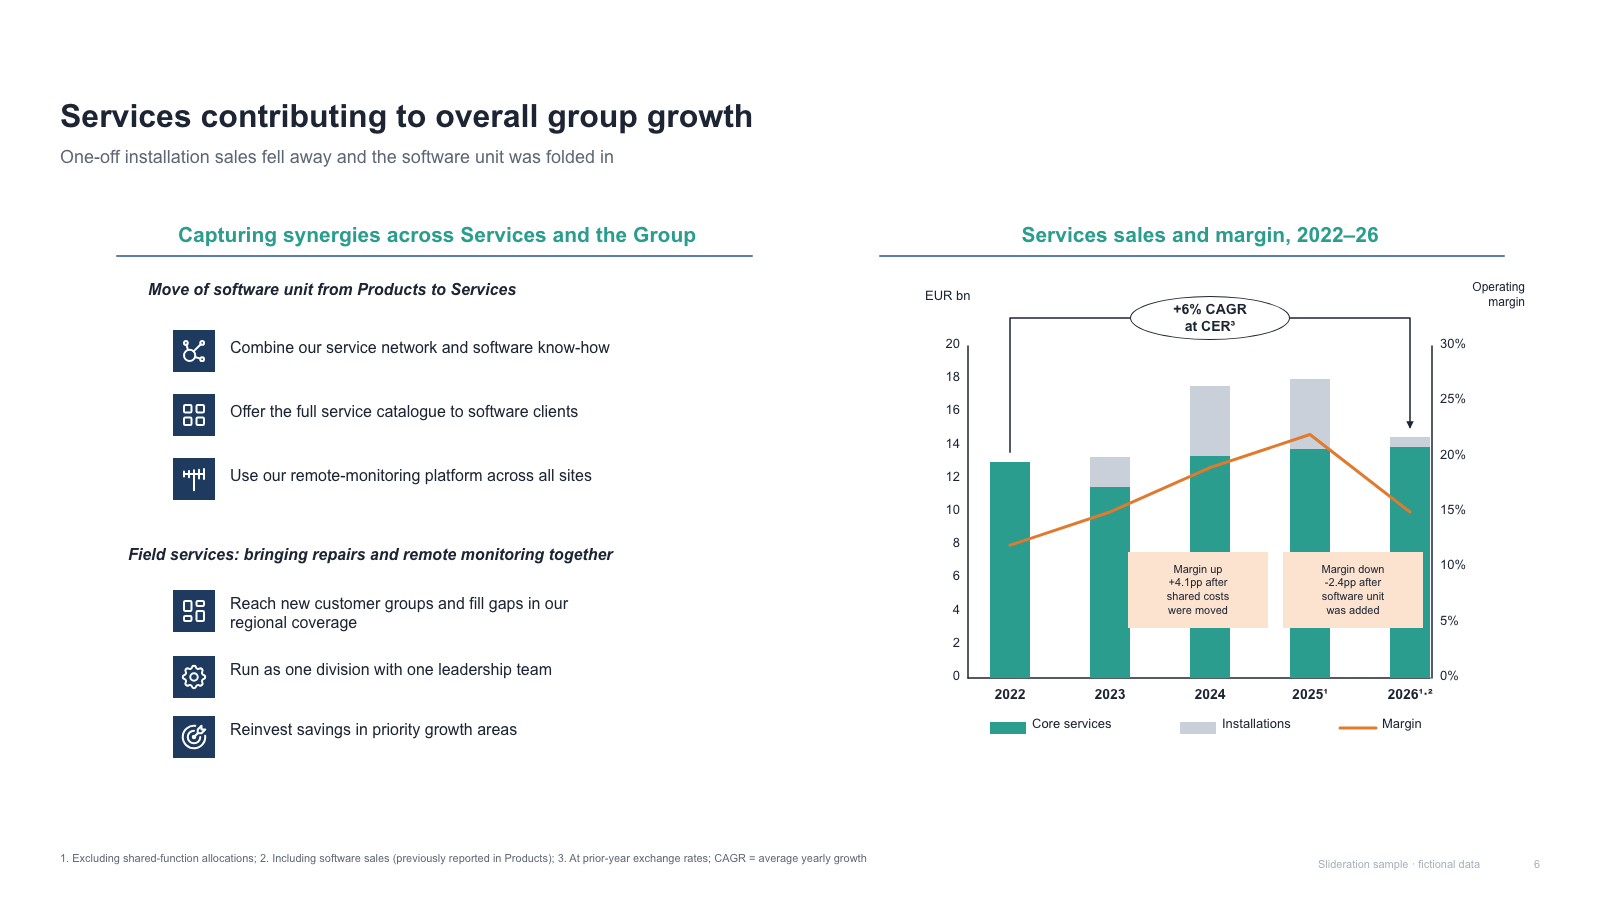
Icon synergy list (two groups) beside a stacked column + margin line chart with CAGR bracket
1 slides · 1 credit
Check inputs & editing effort →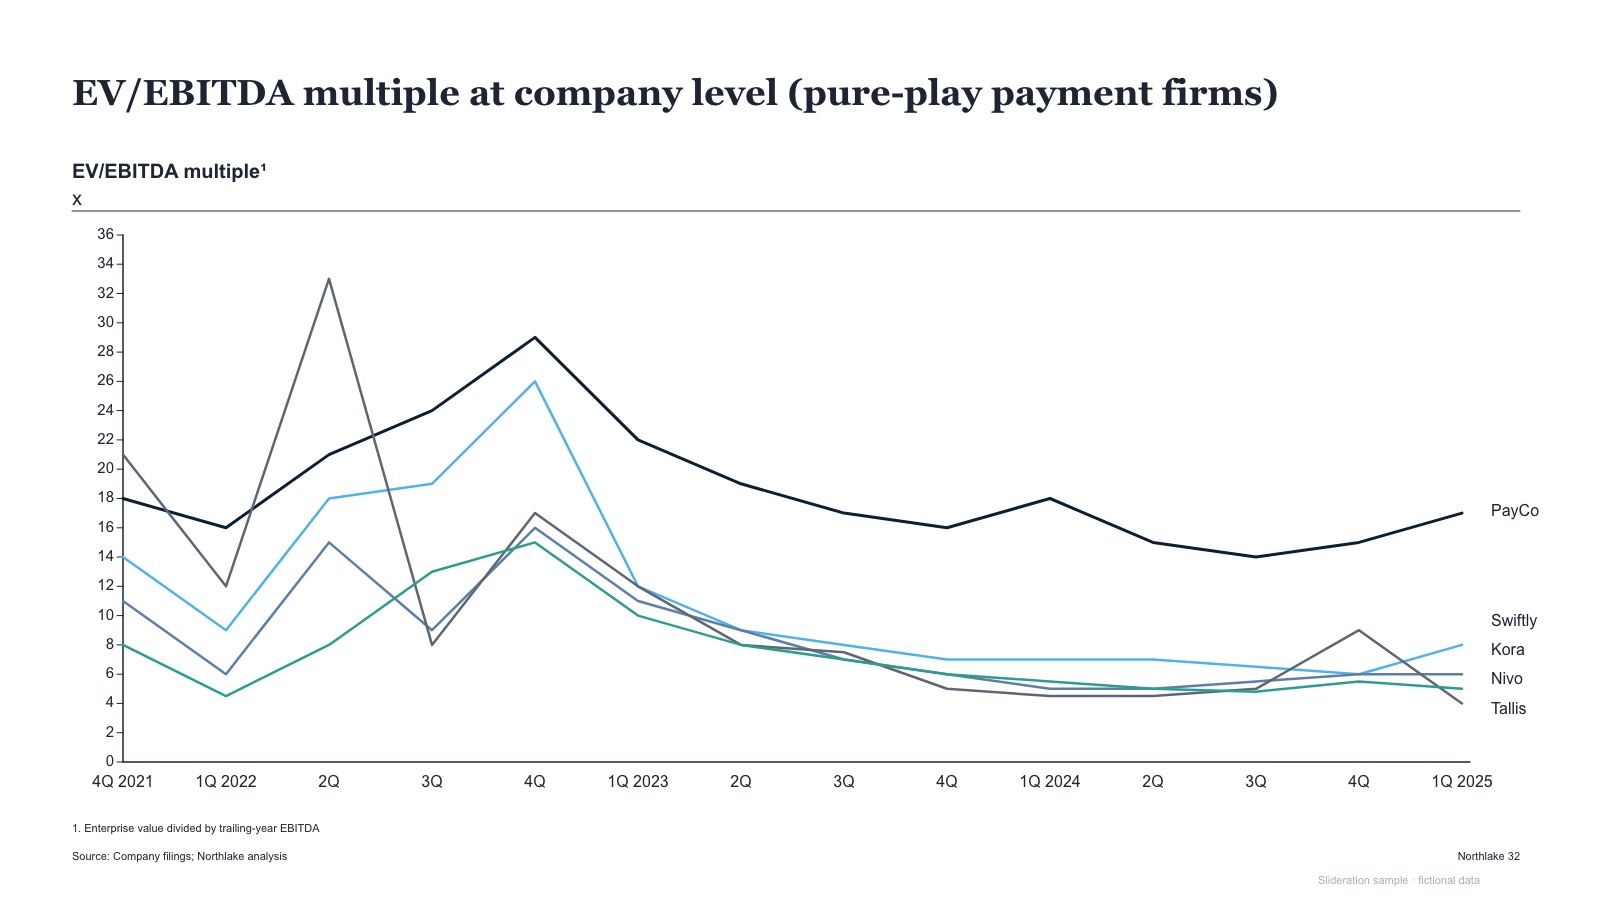
Multi-line quarterly valuation chart with gridded axis and right-side series labels
1 slides · 1 credit
Check inputs & editing effort →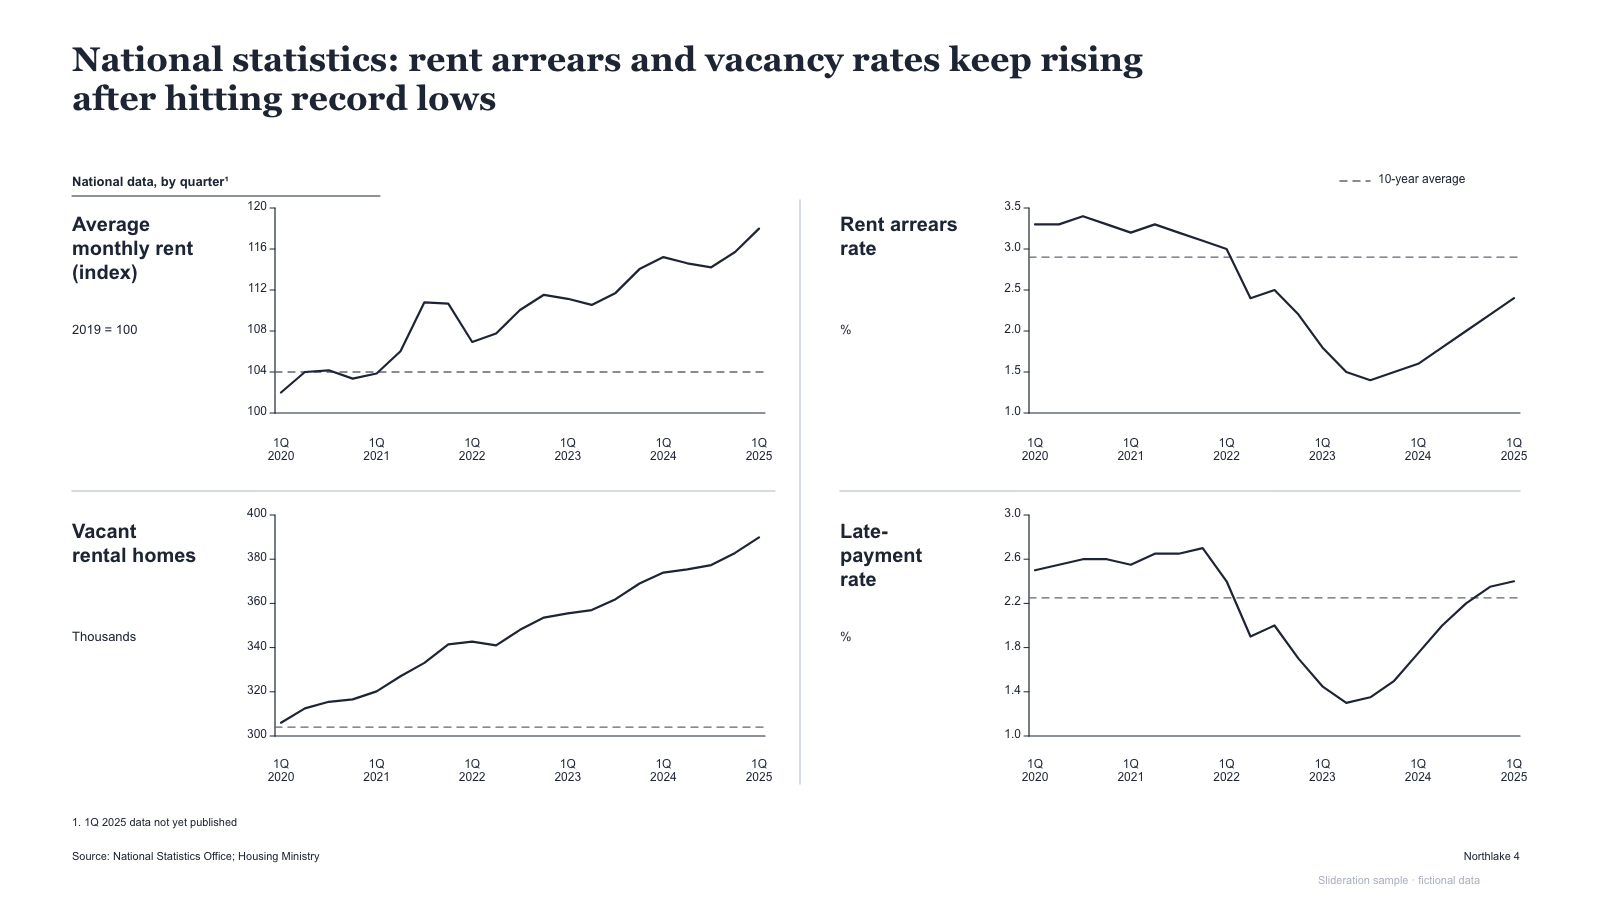
2x2 small-multiple line charts with left-hand labels and dashed long-run averages
1 slides · 1 credit
Check inputs & editing effort →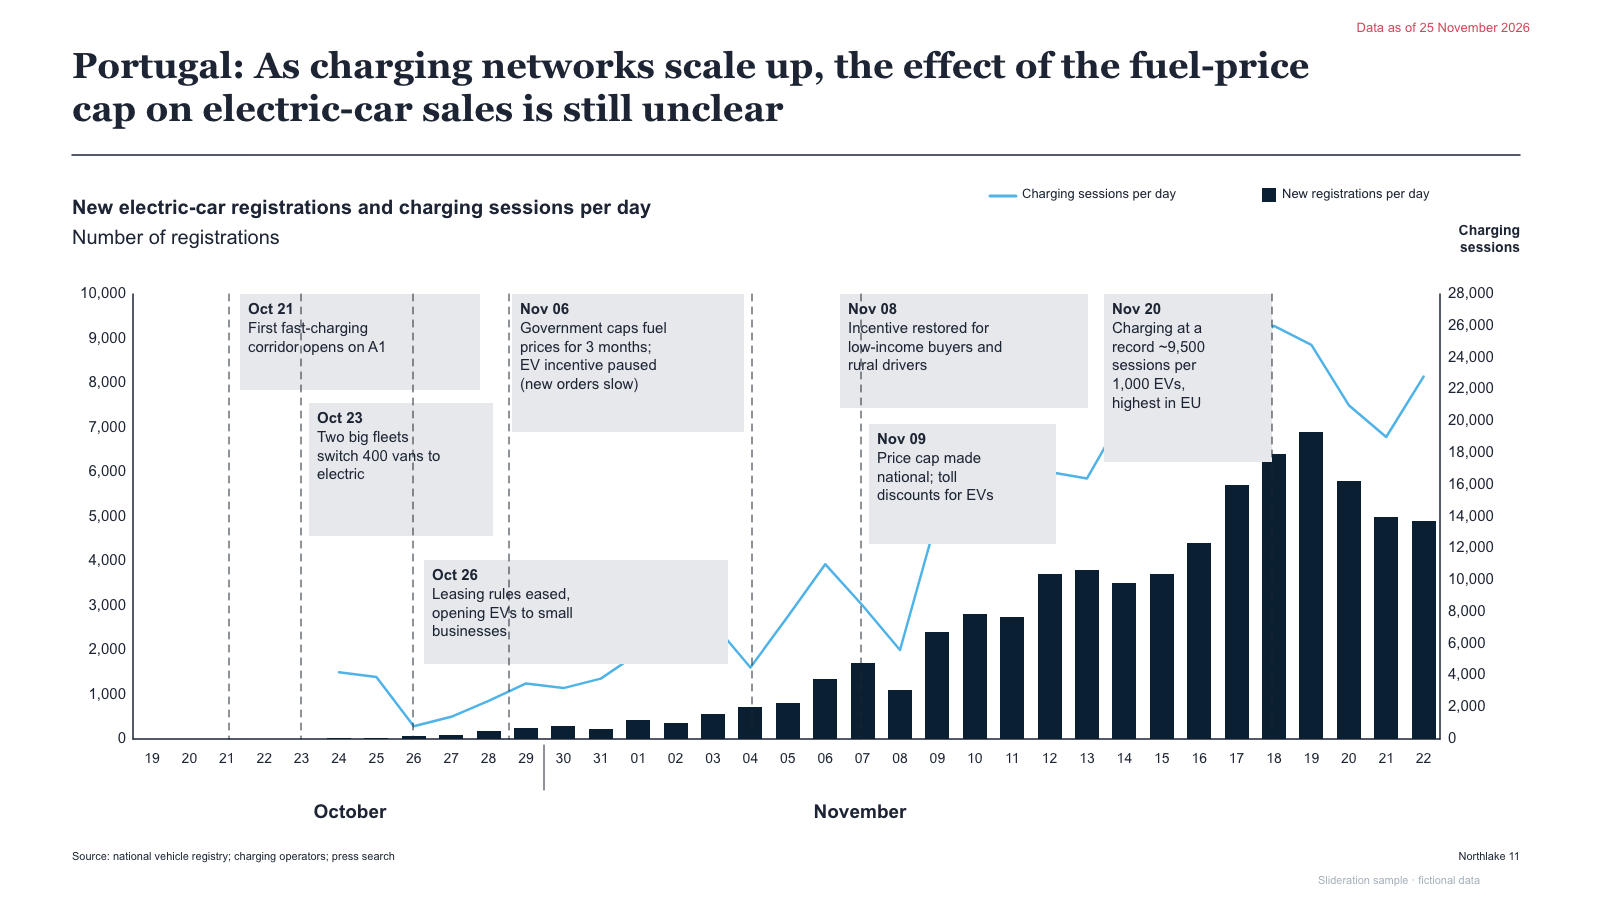
Daily bar + line combo chart on dual axes with dated annotation callouts and dashed markers
1 slides · 1 credit
Check inputs & editing effort →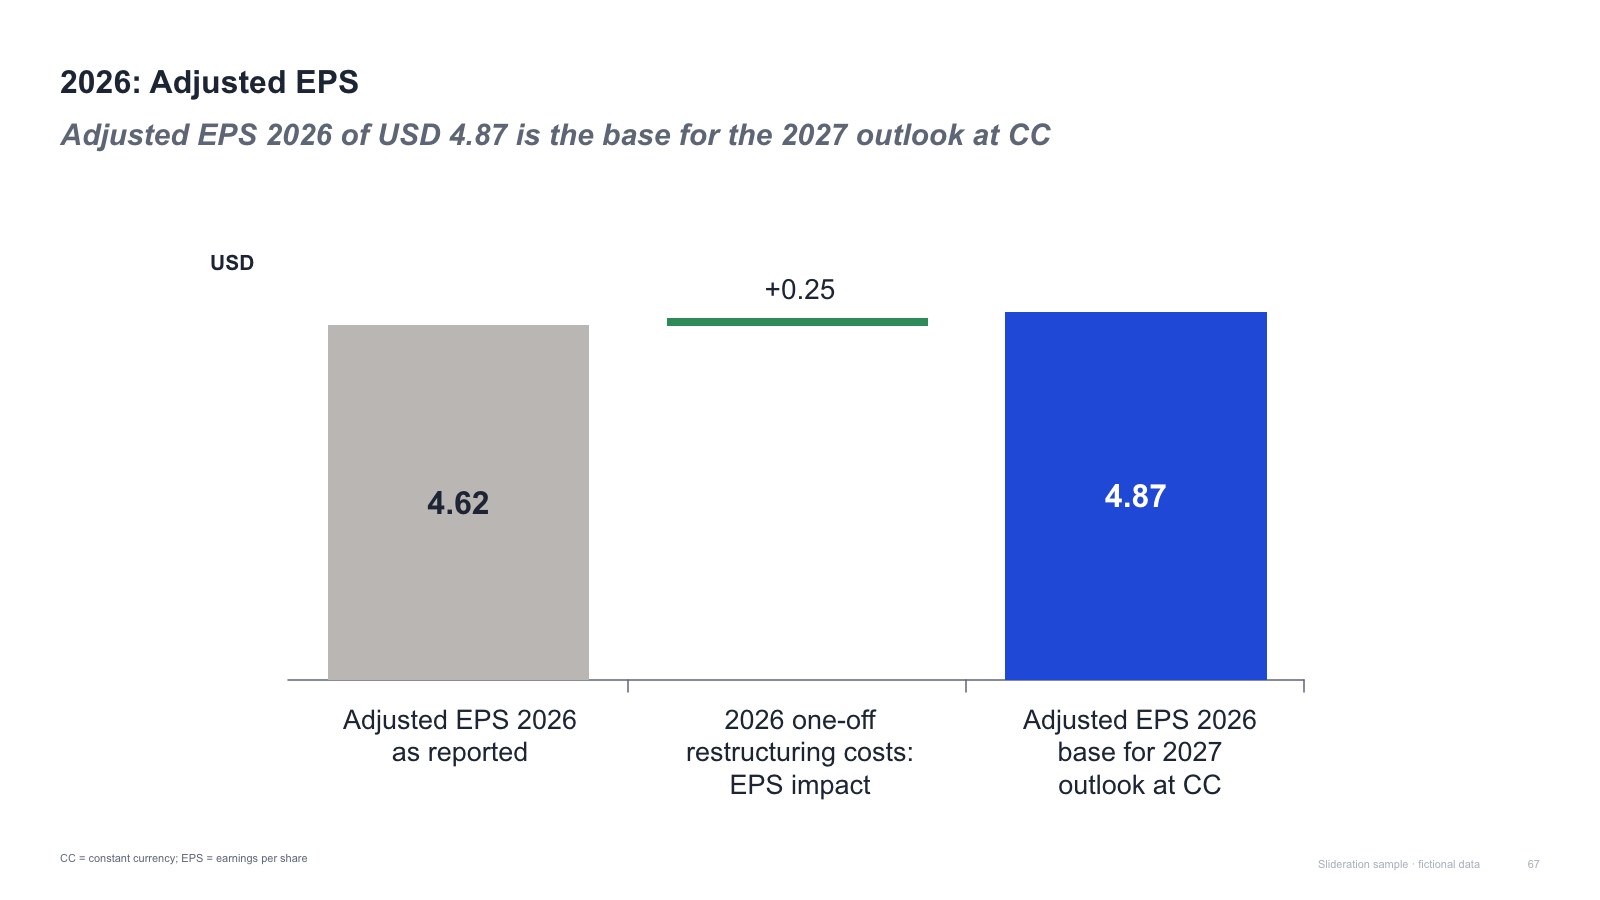
Three-bar bridge — reported value, a single small step and the adjusted base value
1 slides · 1 credit
Check inputs & editing effort →
Two stacked columns with a growth bracket, a chevron divider and a 2x2 icon grid of solution values
1 slides · 1 credit
Check inputs & editing effort →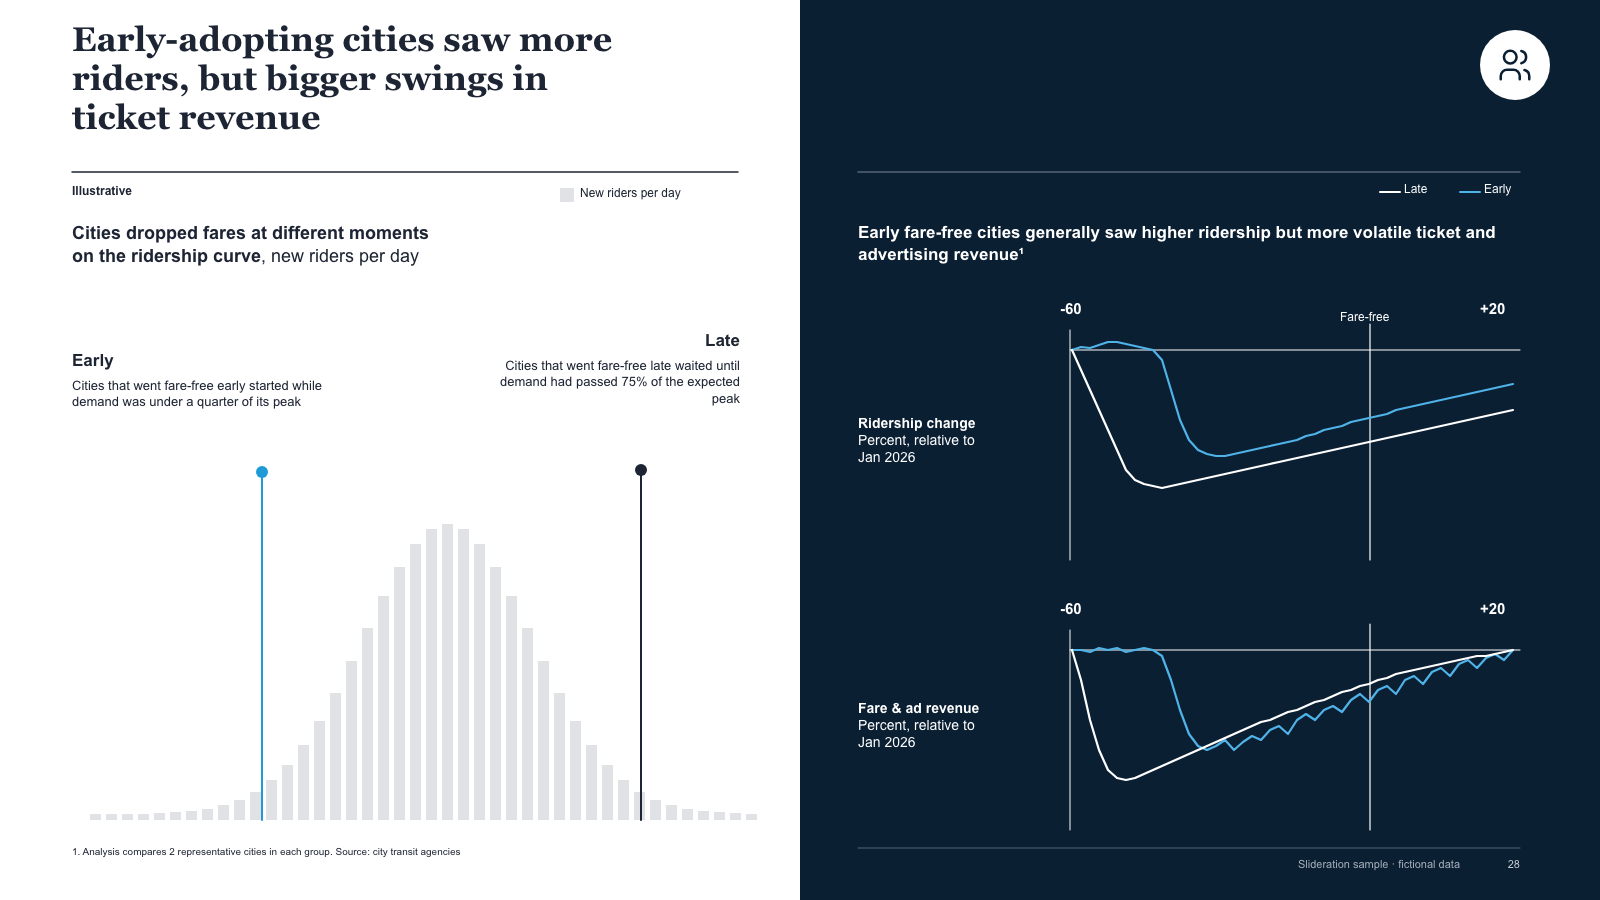
Split slide — illustrative histogram with early/late markers on white, dark panel of two paired line charts
1 slides · 1 credit
Check inputs & editing effort →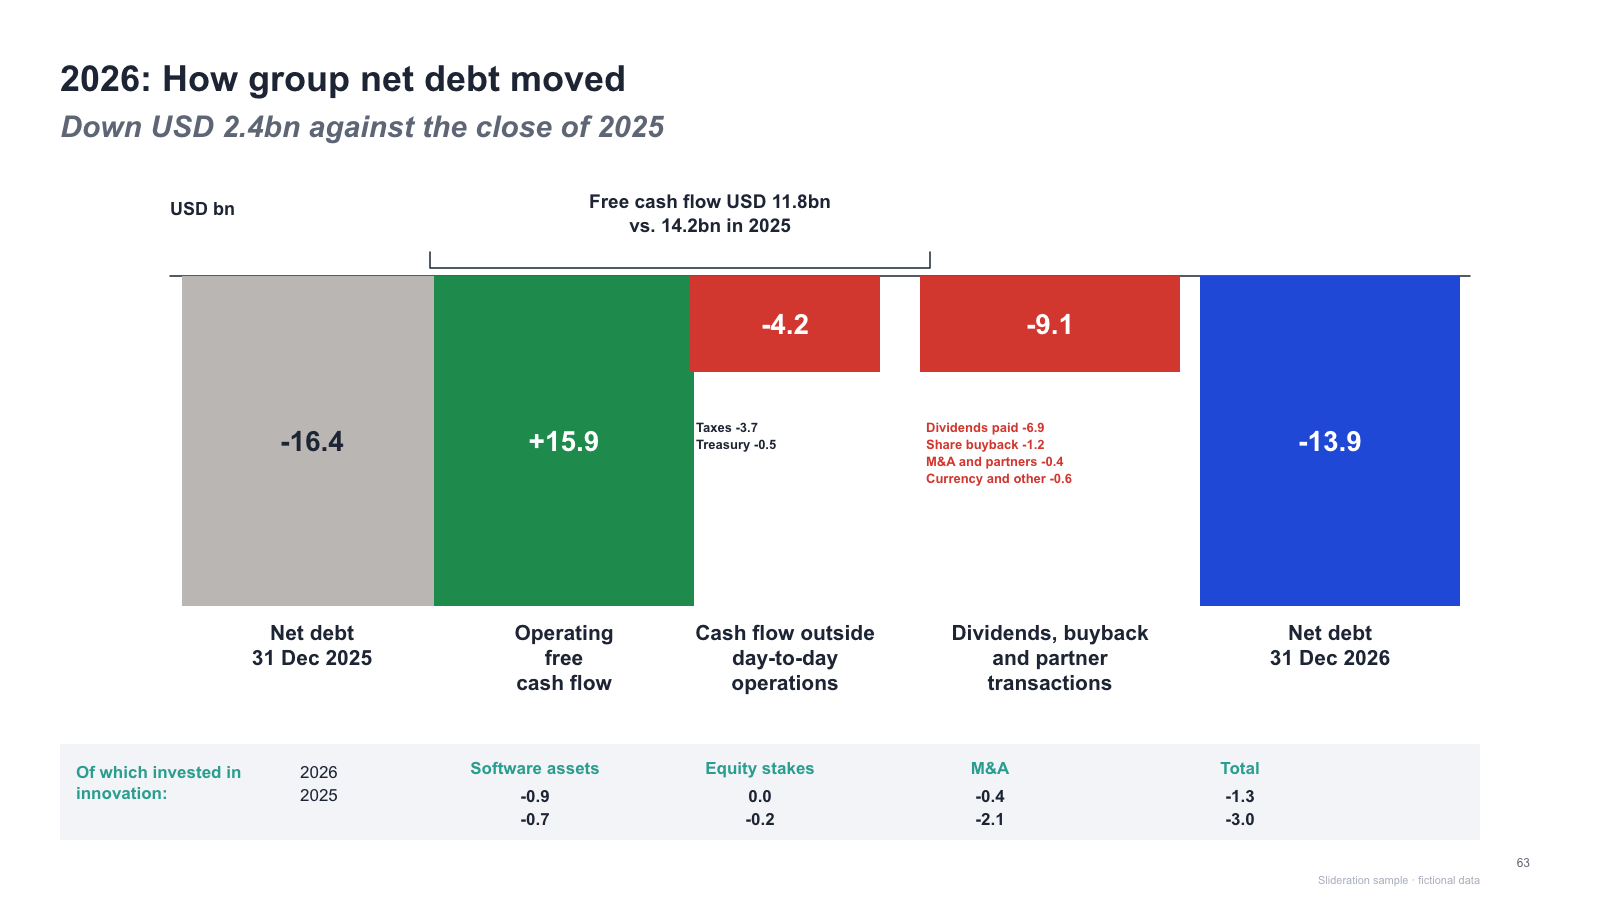
Net-debt bridge of five wide bars with bracket, per-bar breakdown notes and a footer investment table
1 slides · 1 credit
Check inputs & editing effort →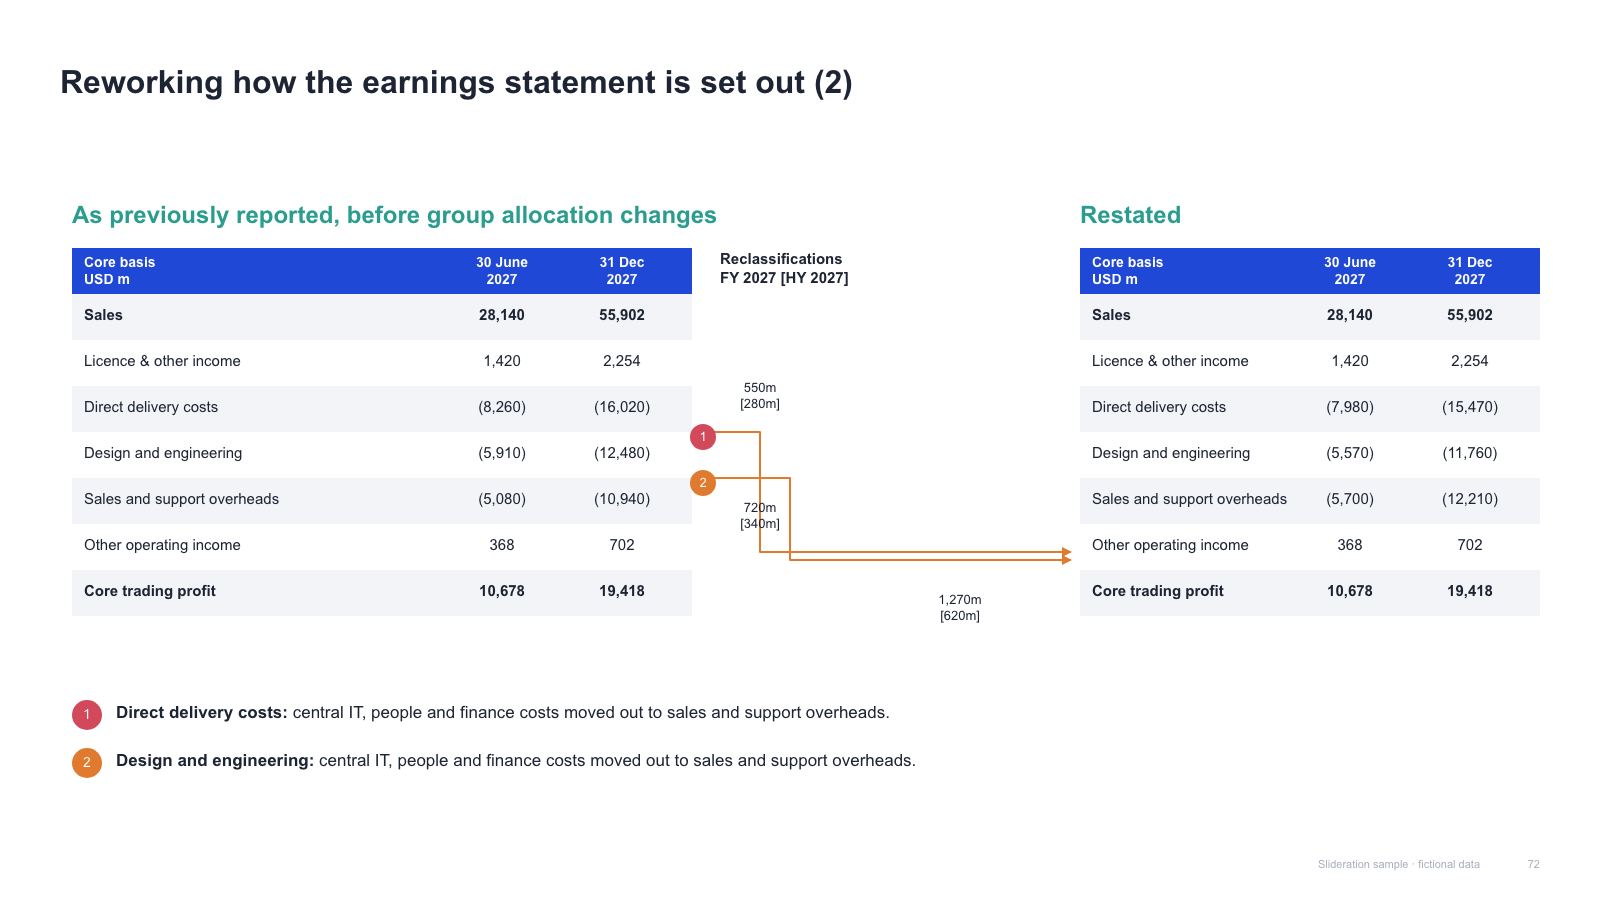
Two financial tables (before / restated) with reclassification arrows and numbered footnotes
1 slides · 1 credit
Check inputs & editing effort →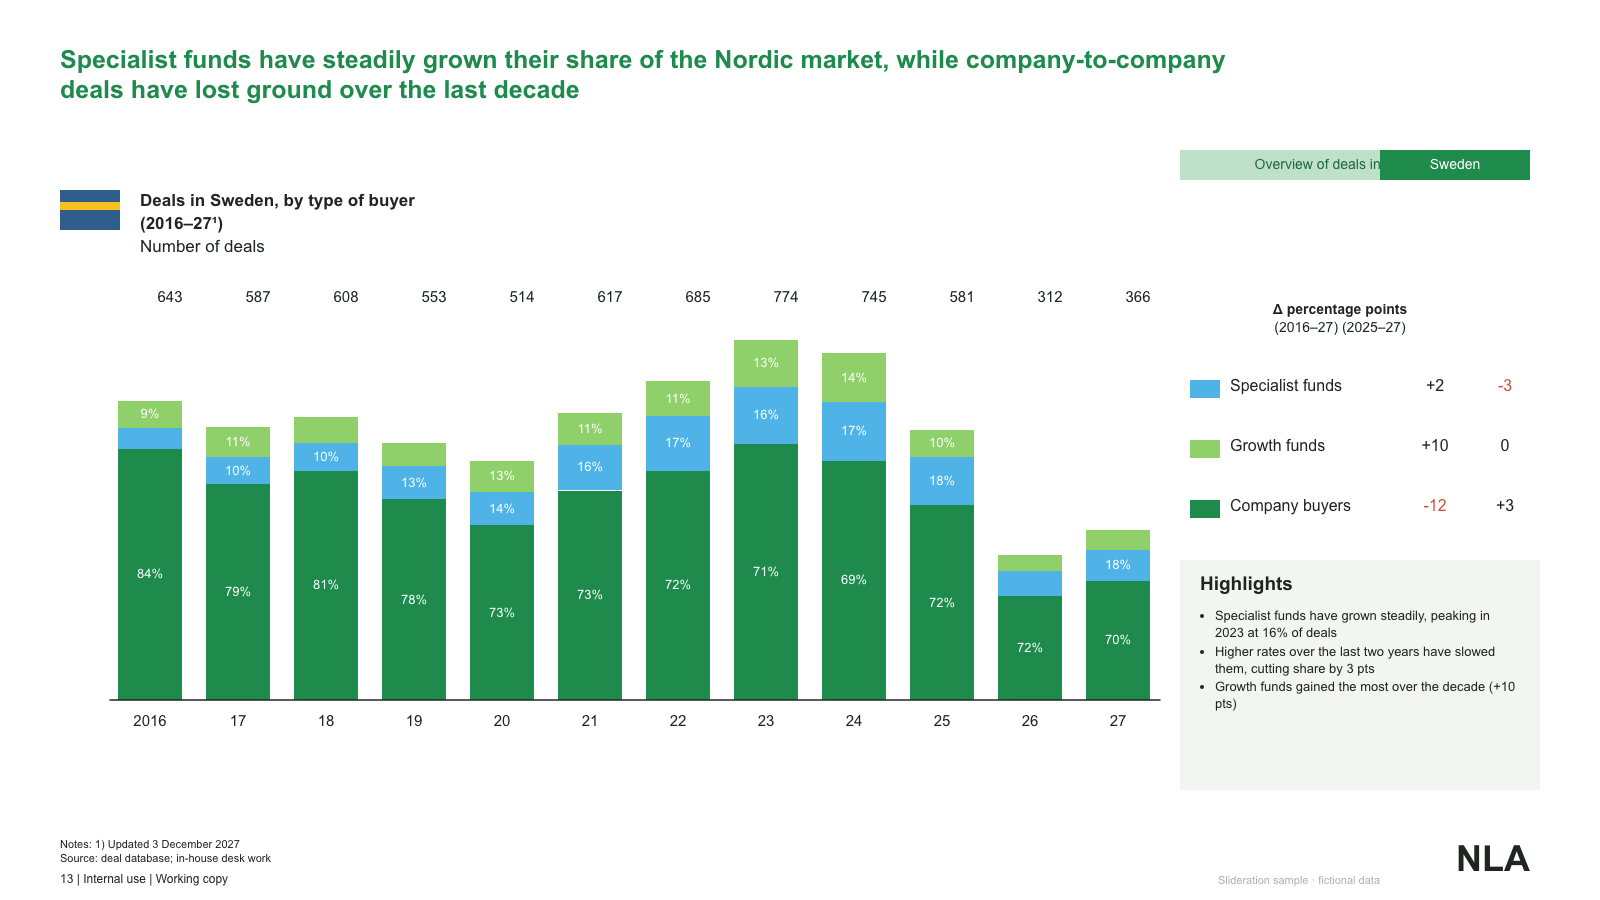
Stacked deal-mix columns by year with total labels, a delta table and a highlights panel
1 slides · 1 credit
Check inputs & editing effort →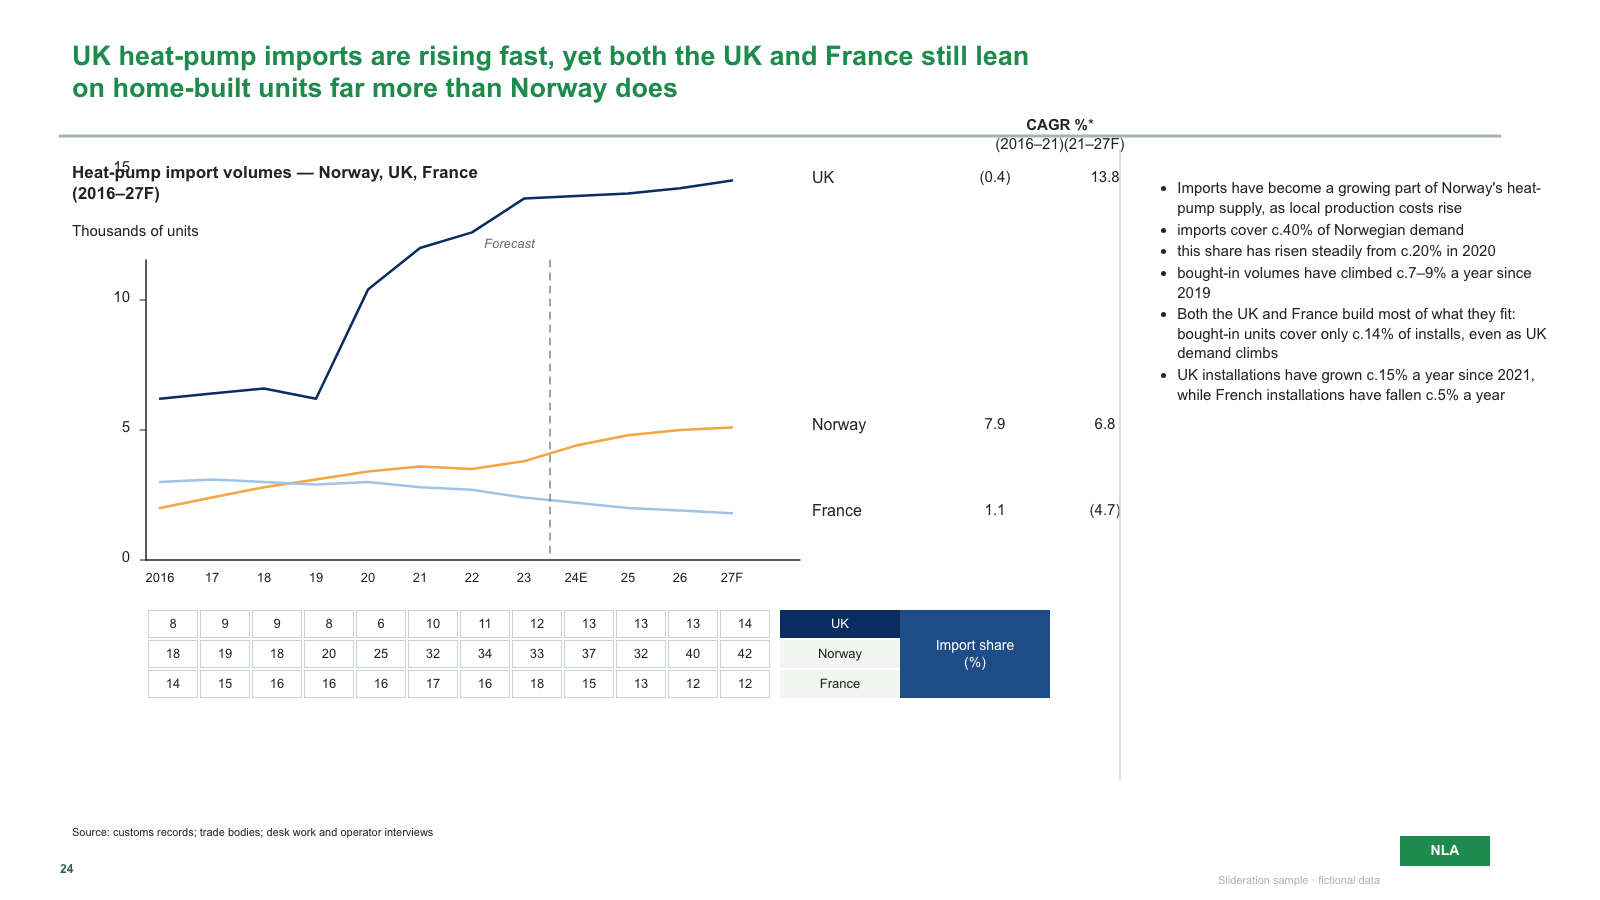
Multi-line import chart with forecast split, CAGR table, data grid and bullet commentary
1 slides · 1 credit
Check inputs & editing effort →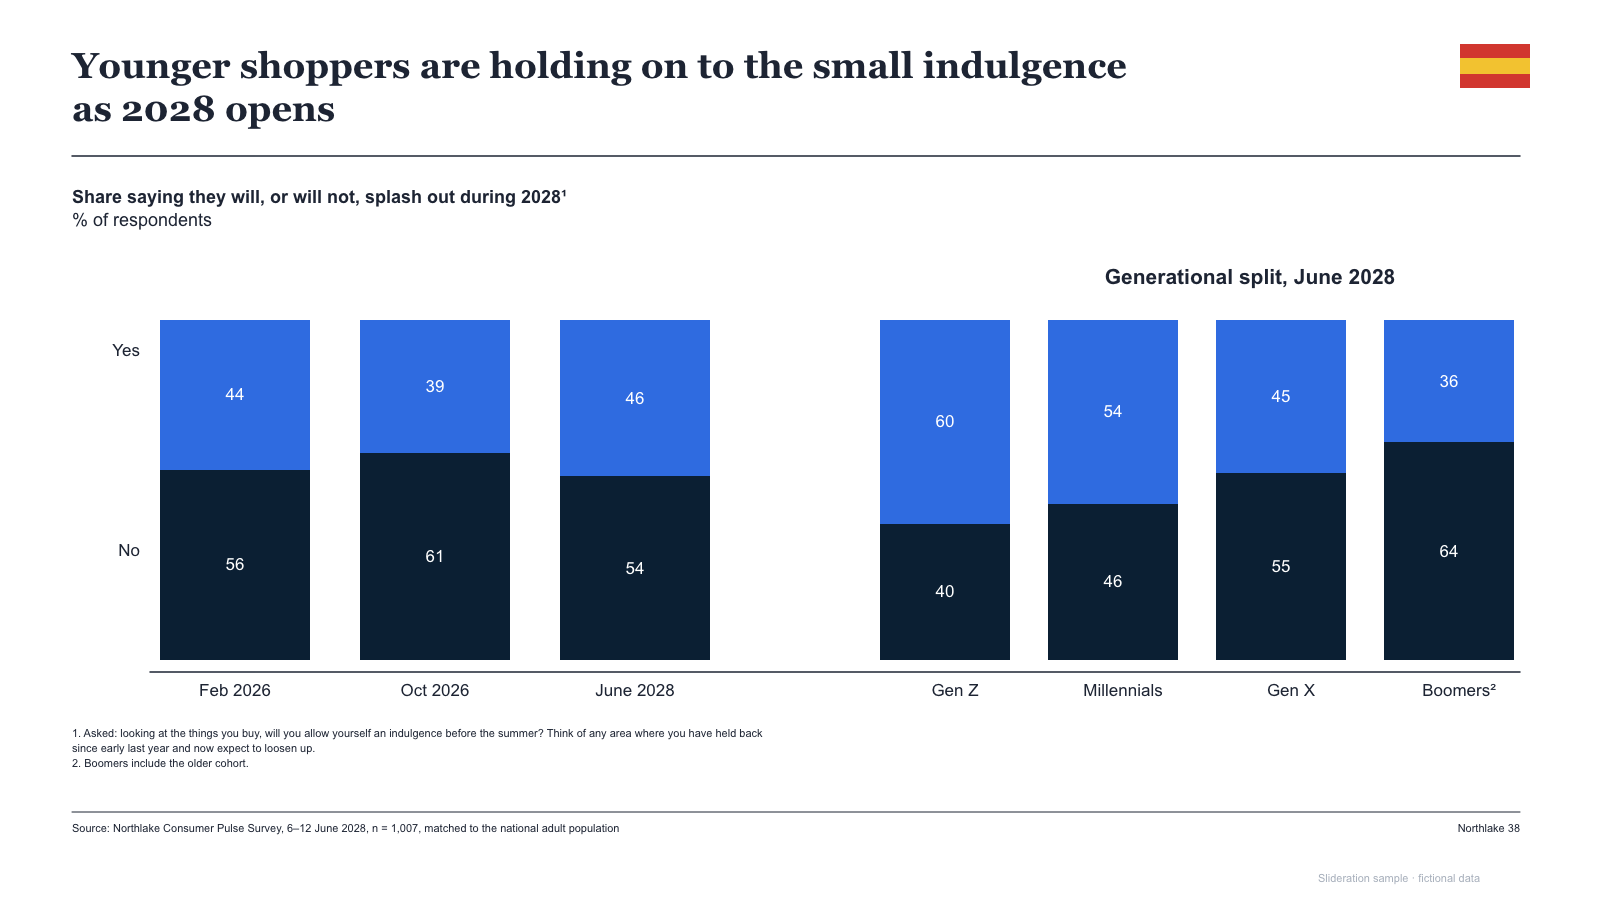
Two grouped 100% column sets (time series and cohorts) with yes/no rows and a flag marker
1 slides · 1 credit
Check inputs & editing effort →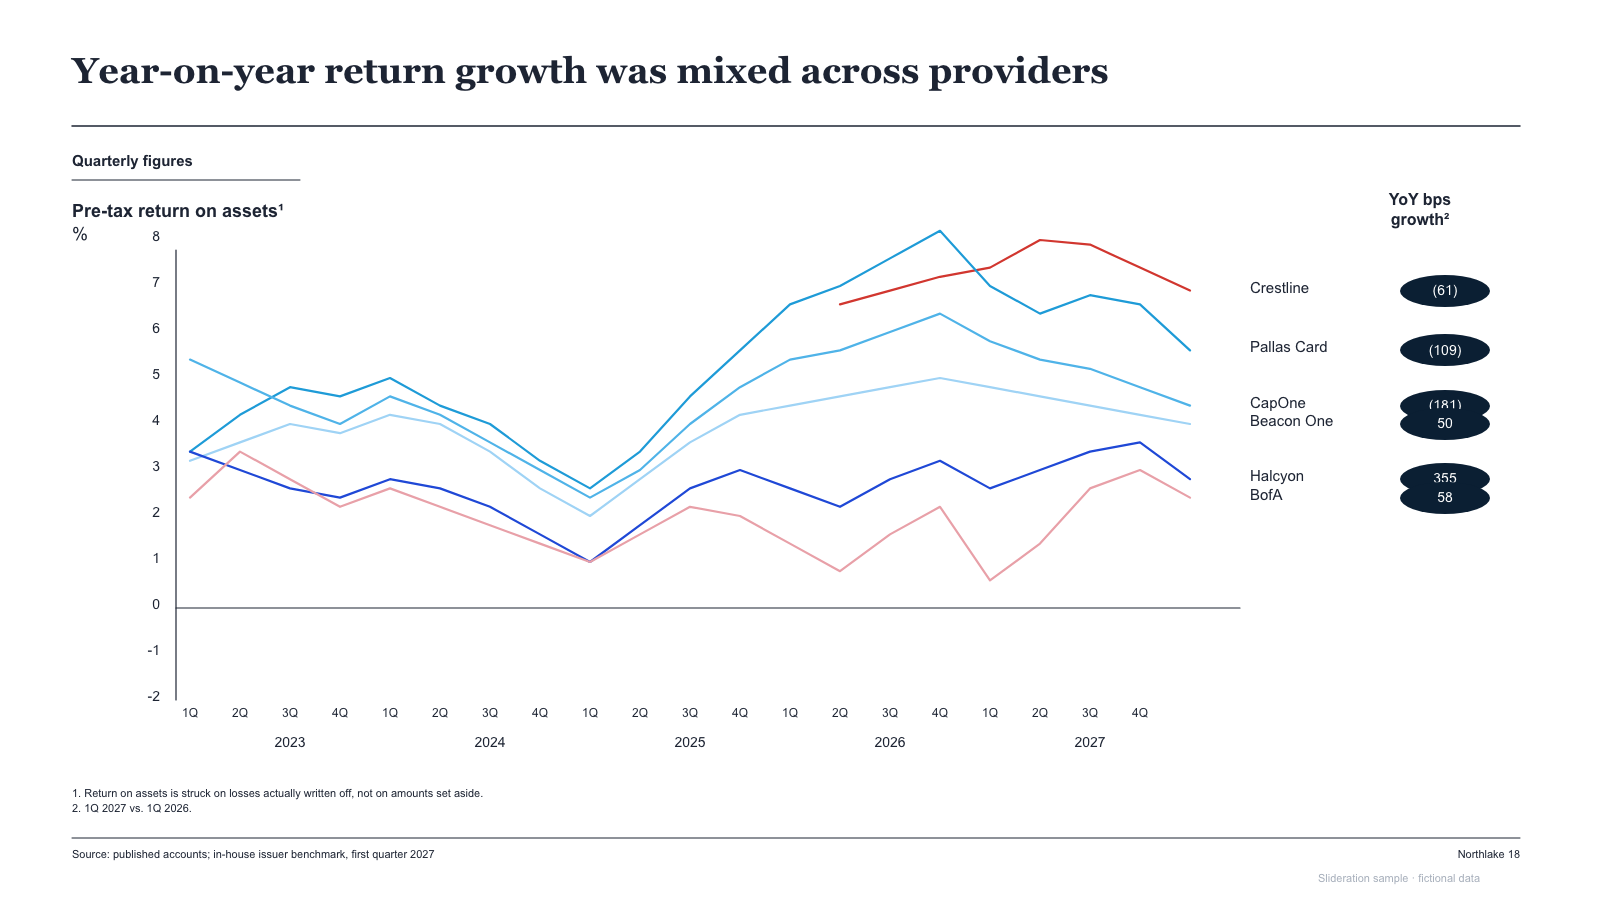
Multi-series quarterly line chart with right-hand series labels and pill-shaped change markers
1 slides · 1 credit
Check inputs & editing effort →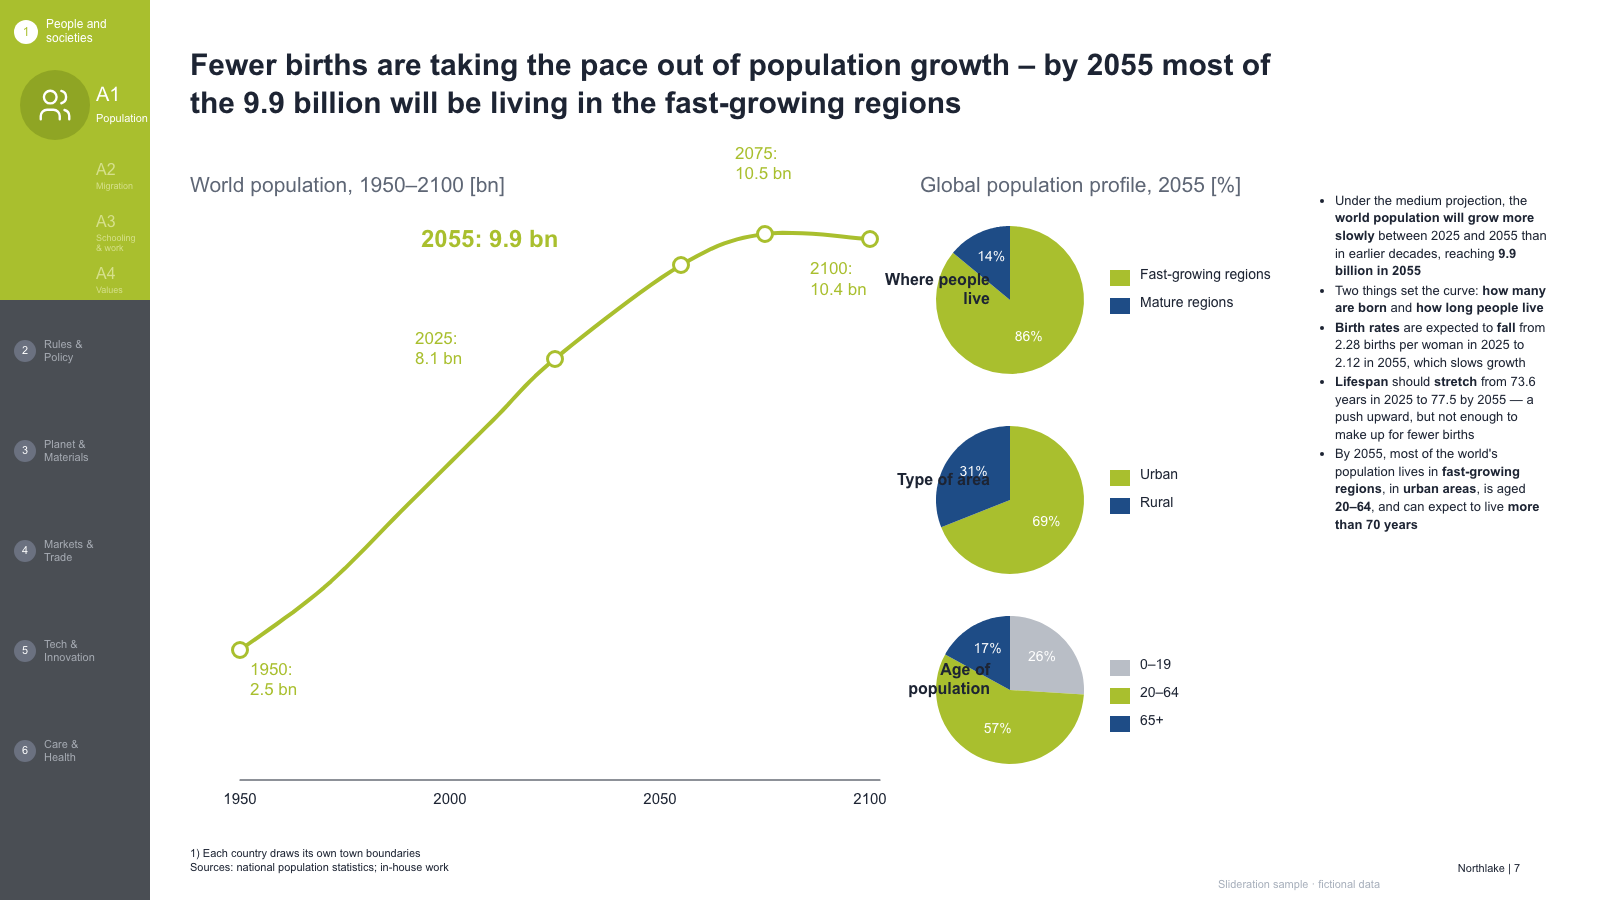
Rail, an S-curve population chart with year callouts, three small pies and a bullet column
1 slides · 1 credit
Check inputs & editing effort →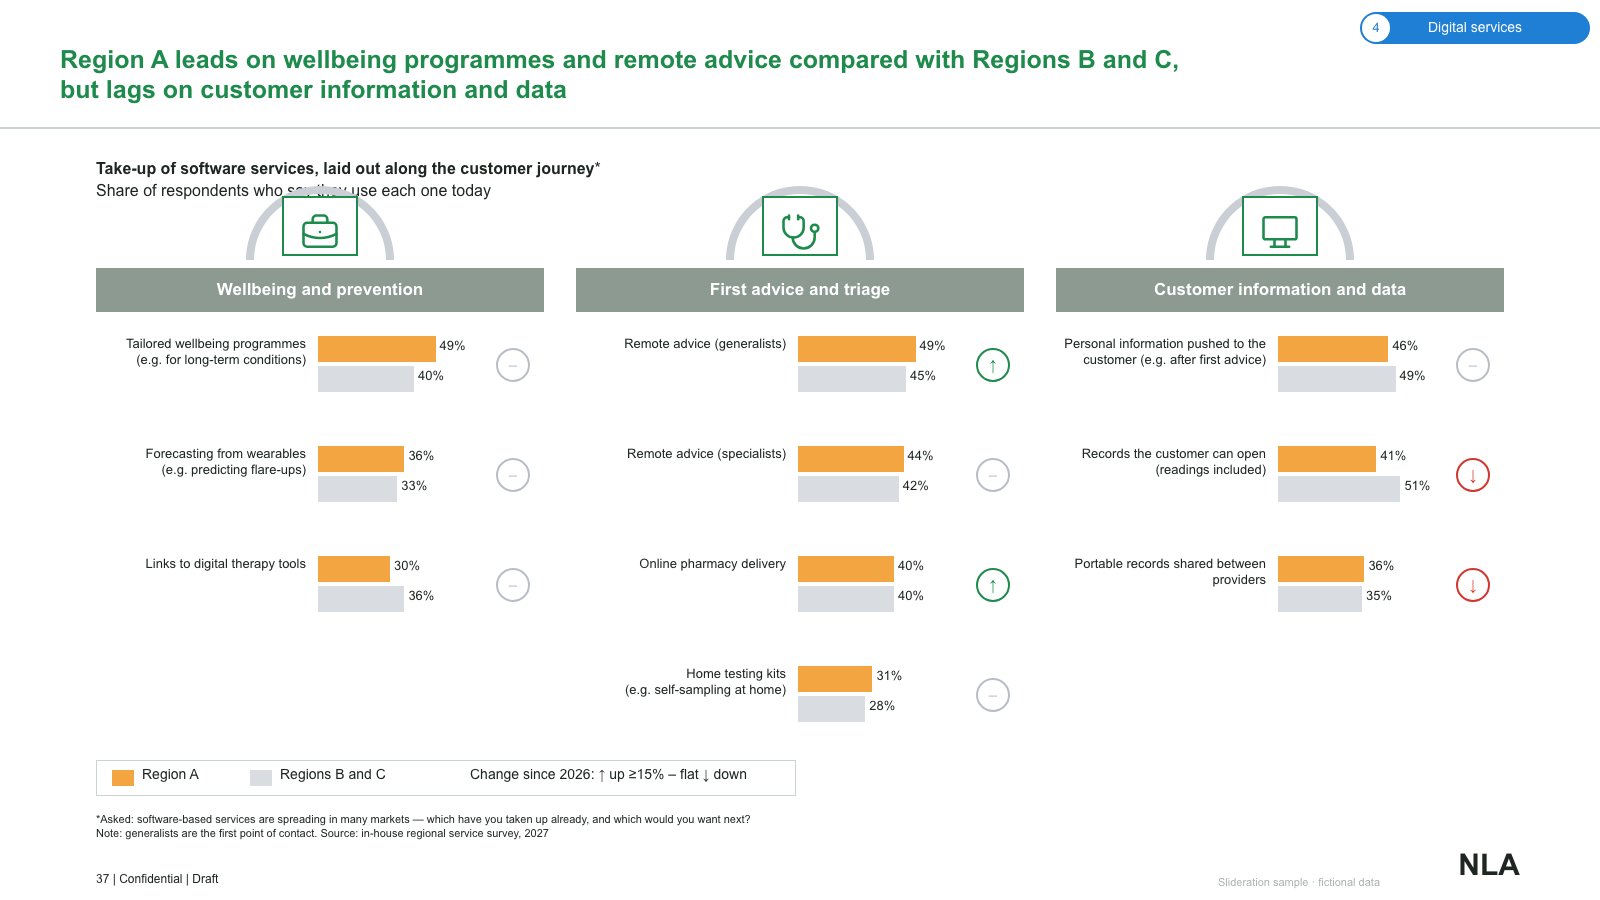
Three grouped adoption panels with arch icons, paired bars and change badges
1 slides · 1 credit
Check inputs & editing effort →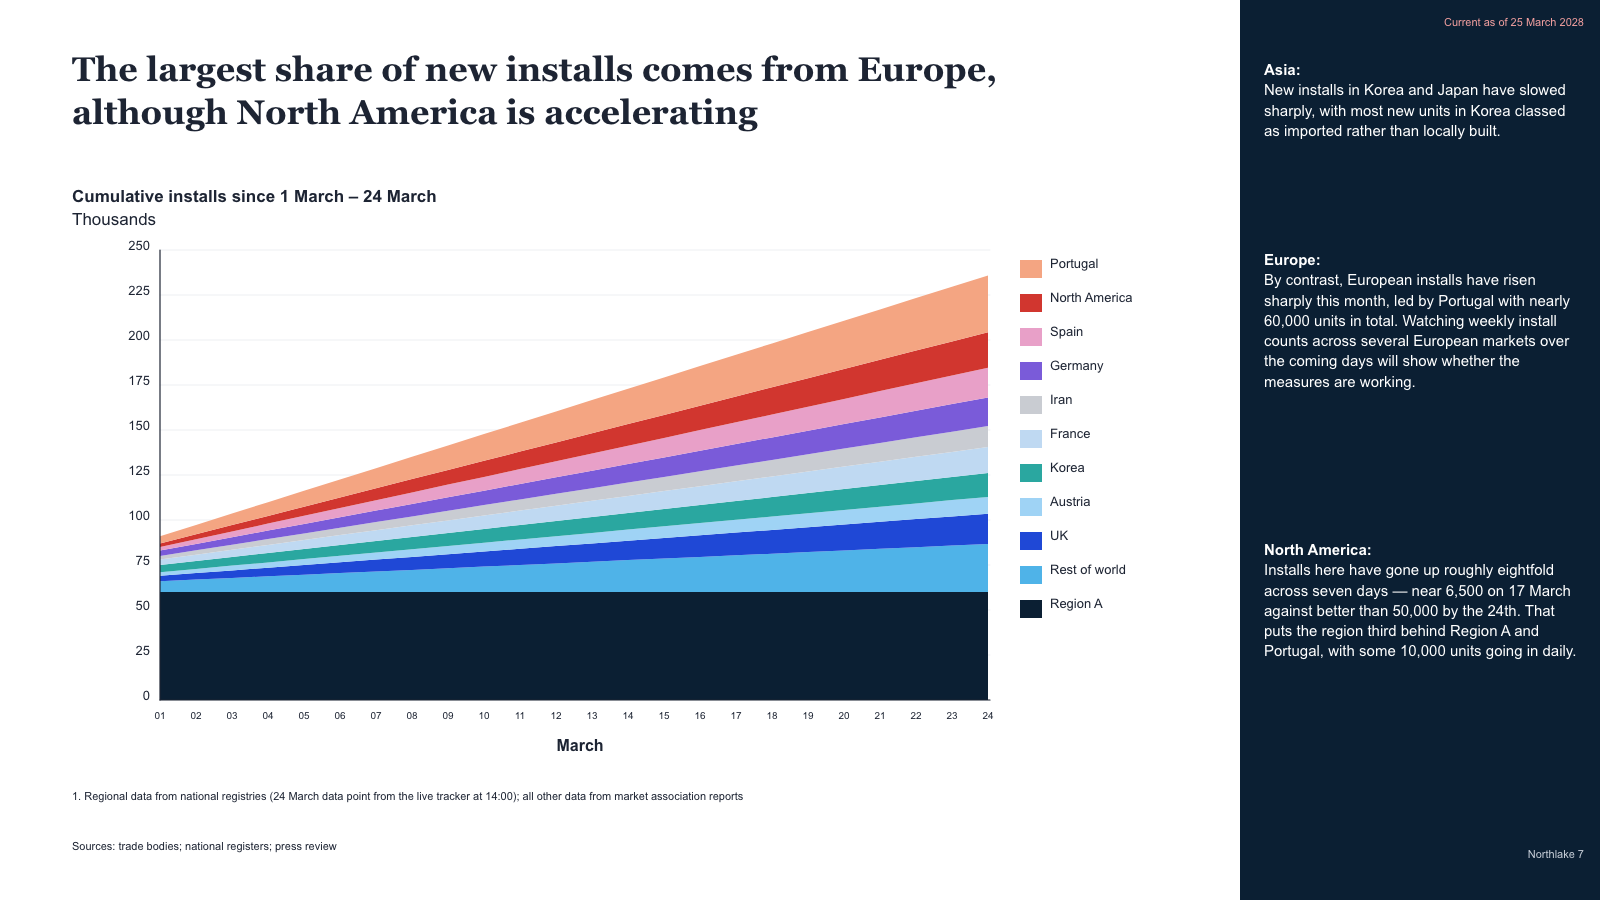
Stacked area chart of cumulative volumes with a market legend and a dark commentary sidebar
1 slides · 1 credit
Check inputs & editing effort →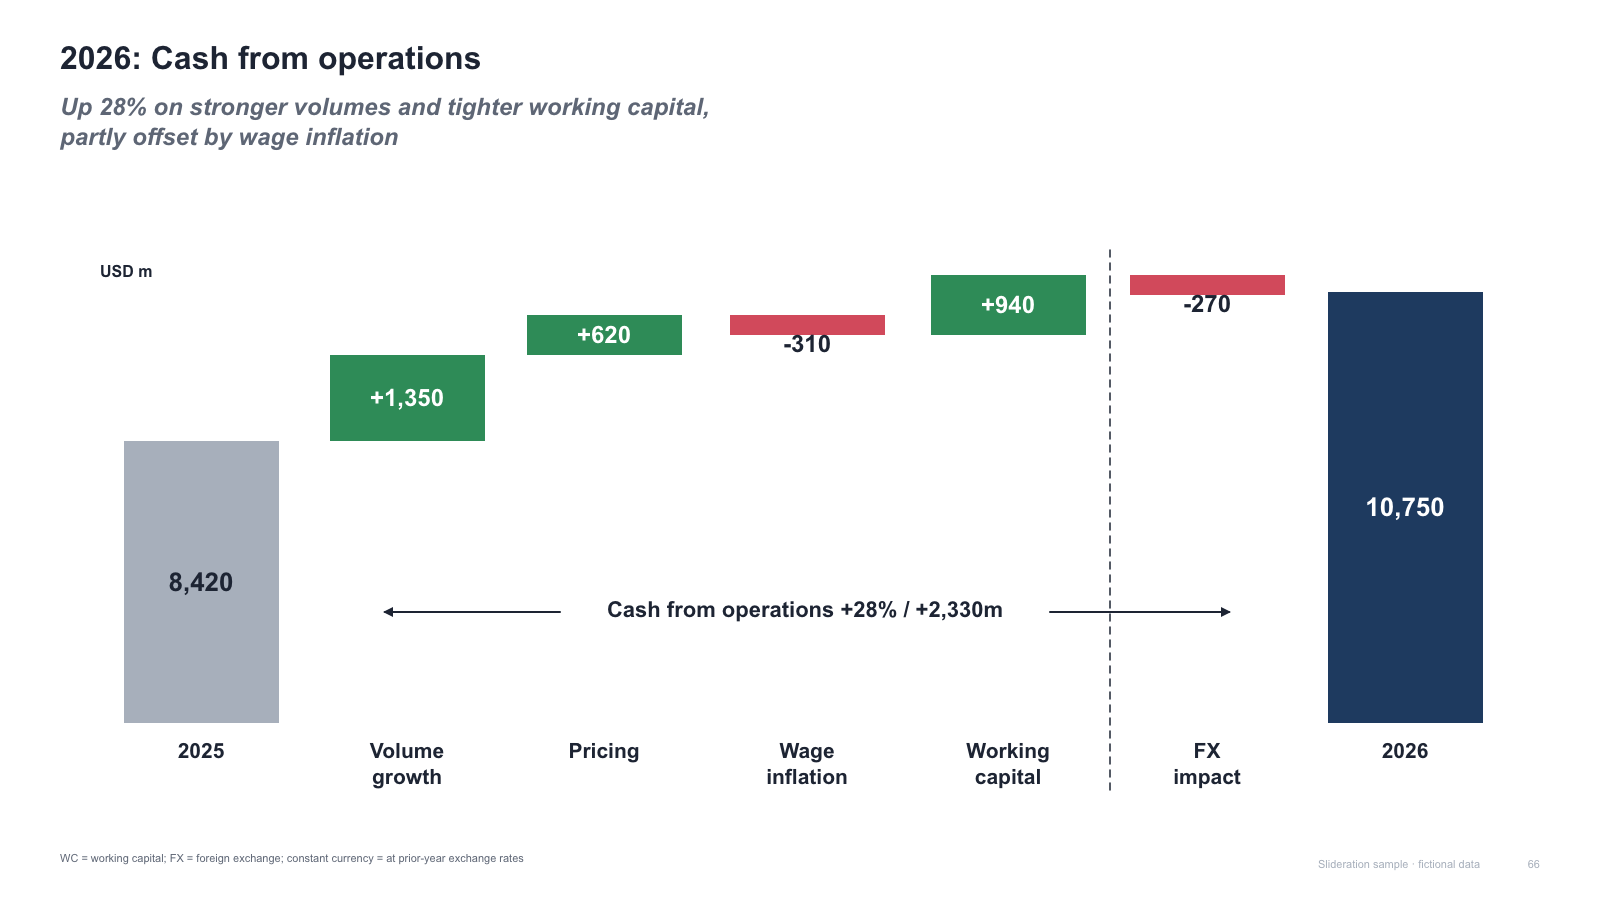
Waterfall chart bridge with divider and span arrow
1 slides · 1 credit
Check inputs & editing effort →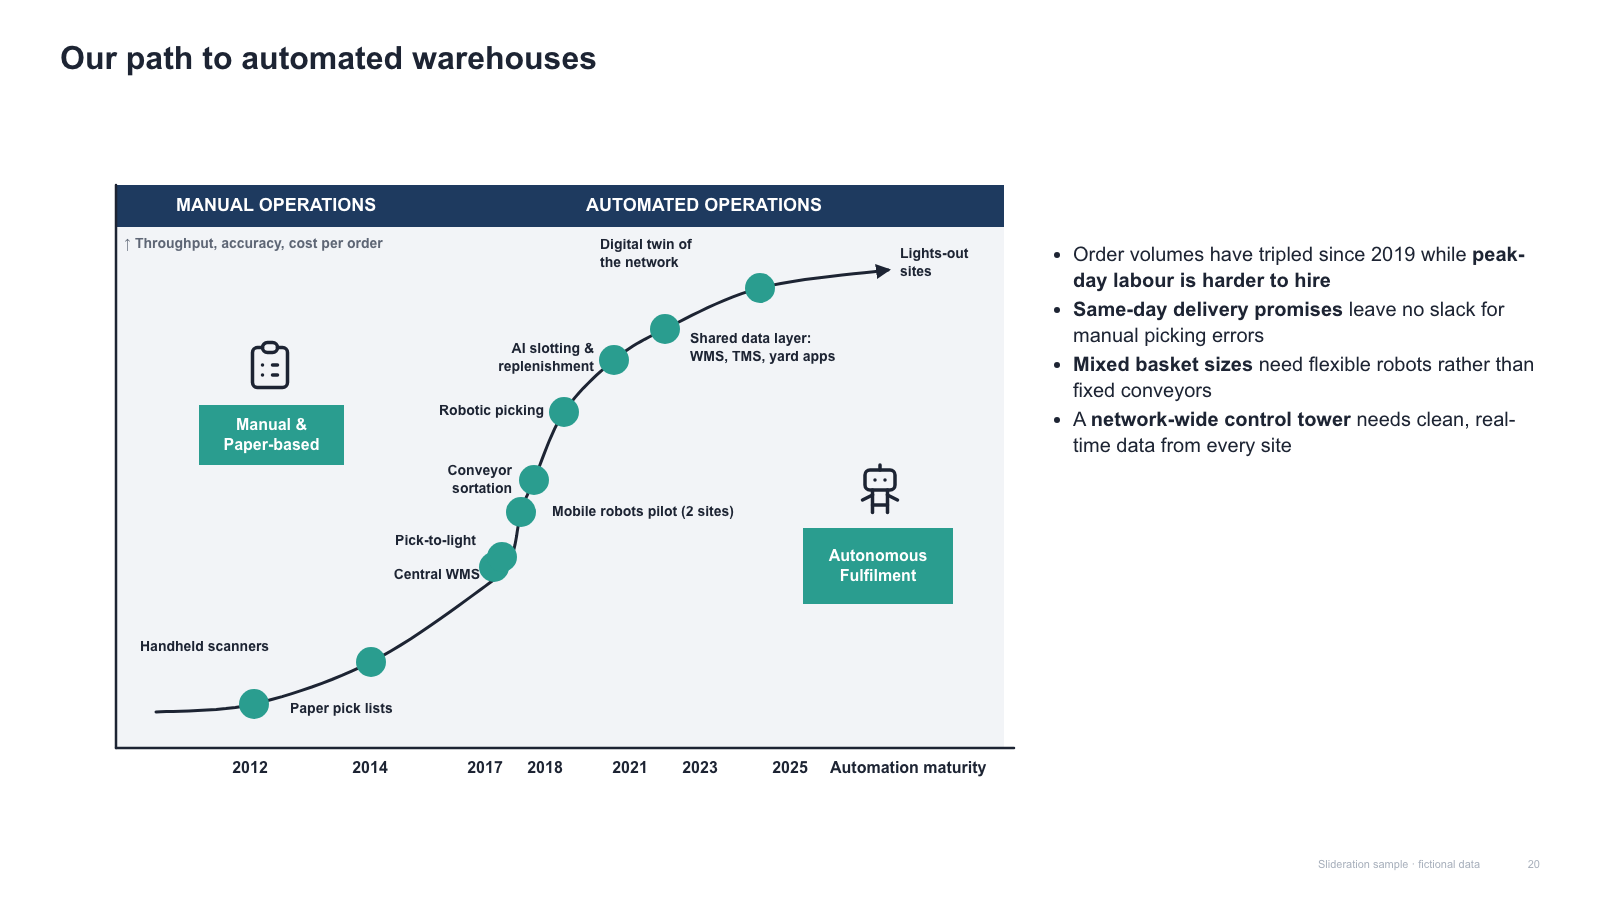
S-curve maturity journey with milestones + right-hand bullets
1 slides · 1 credit
Check inputs & editing effort →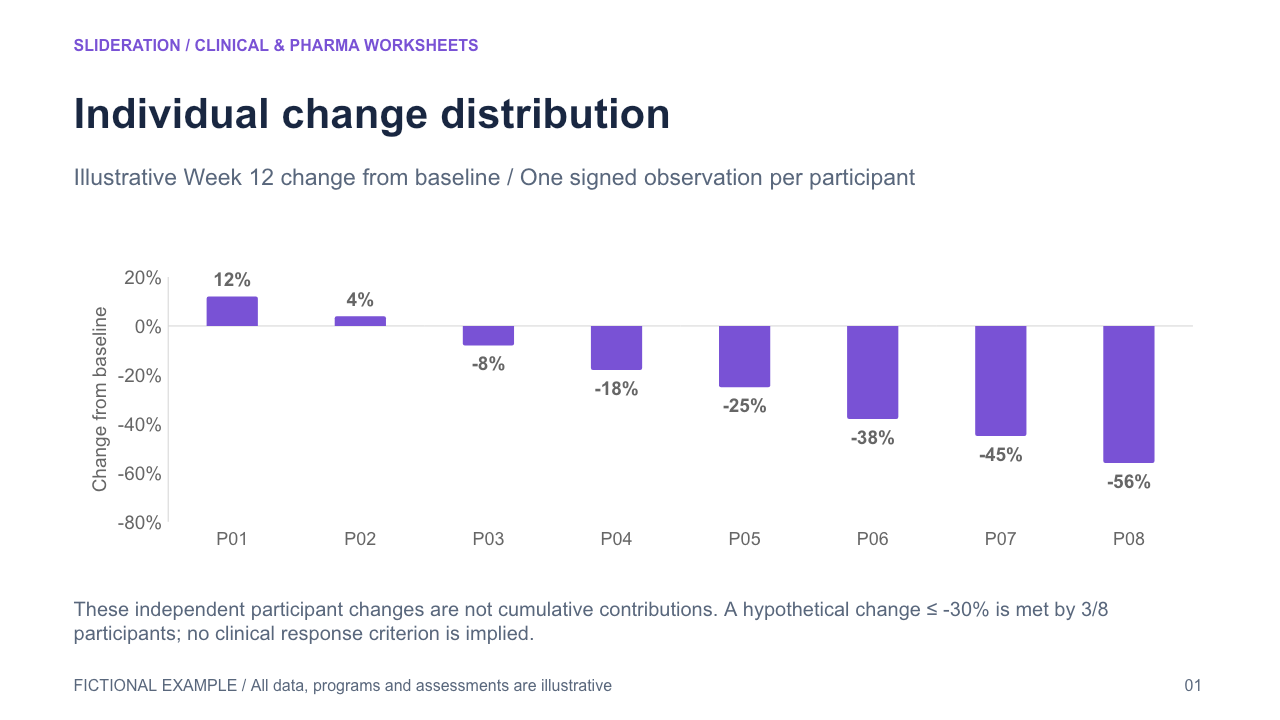
Individual change distribution — One participant per bar shows signed change from the same baseline definition
2 slides · 1 credit
Check inputs & editing effort →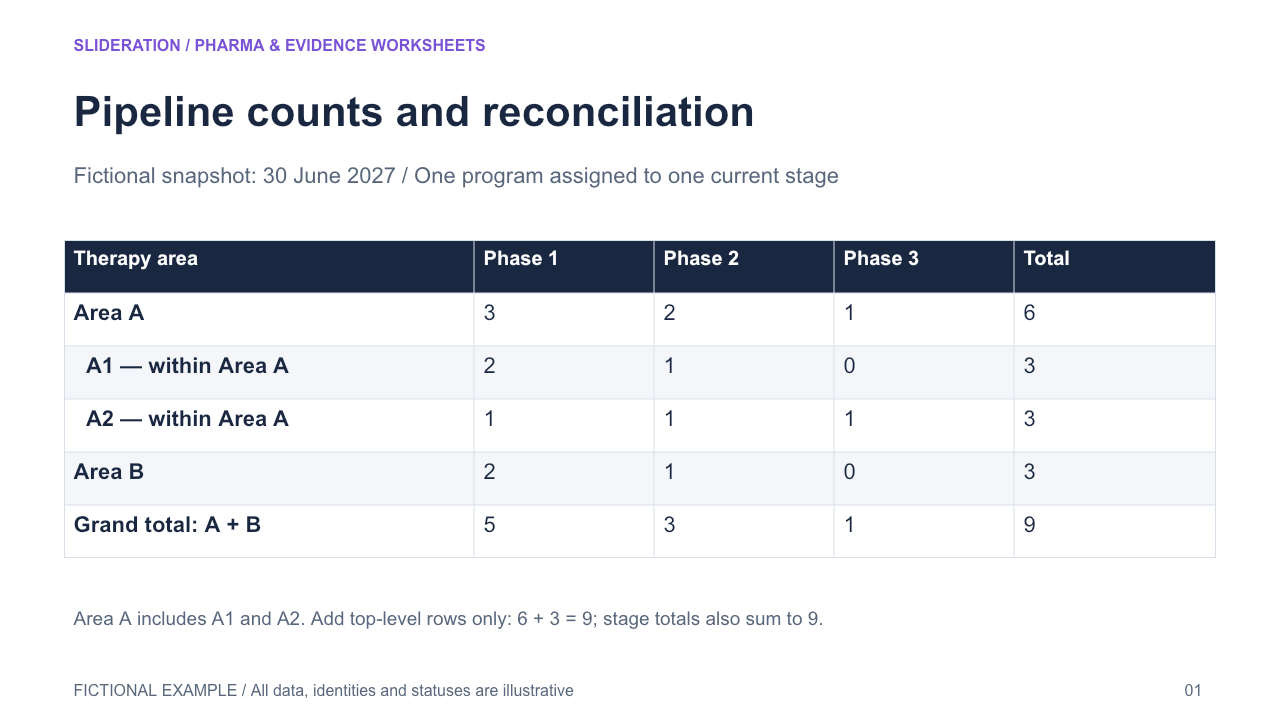
Pipeline counts and reconciliation — Therapy-area-by-stage counts have declared counting unit, indented child categories, row and column totals and an explicit reconciliation check. A subtotal is not added a second time.
2 slides · 1 credit
Check inputs & editing effort →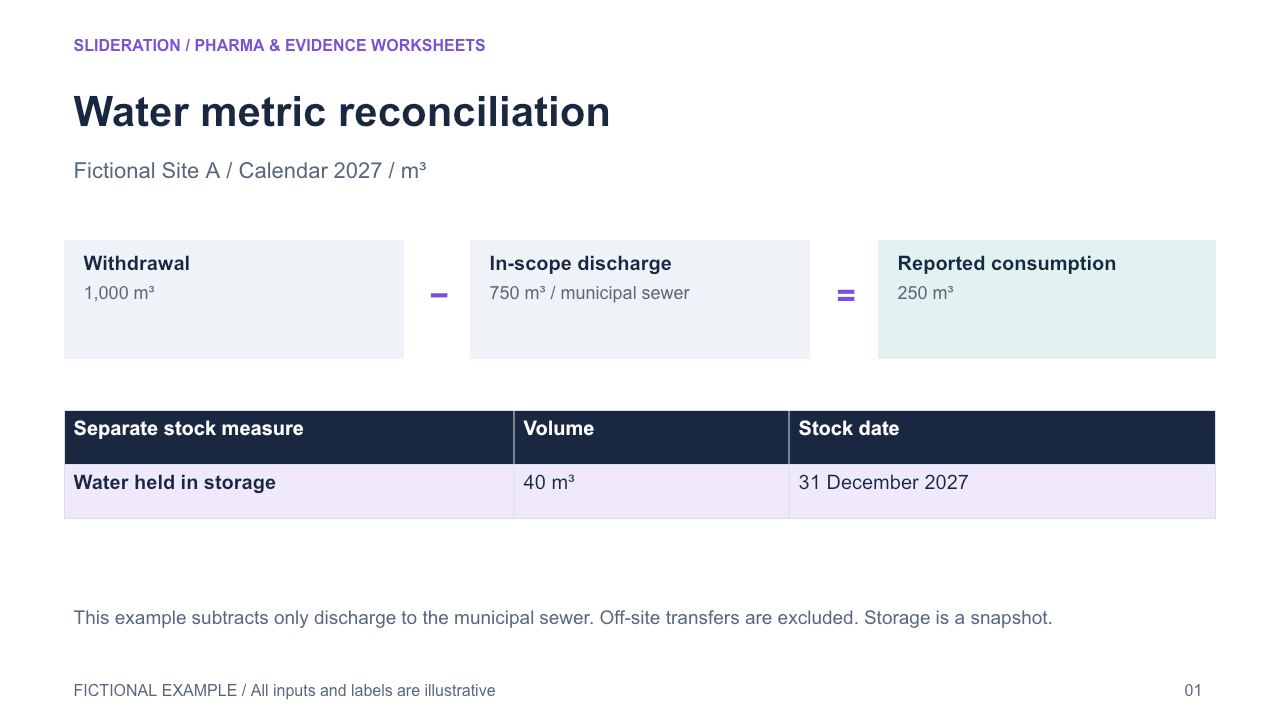
Water metric reconciliation — Period withdrawal and discharge reconcile to reported consumption under an explicit illustrative definition; end-period storage is separated as a stock. Site/boundary and units remain attached.
2 slides · 1 credit
Check inputs & editing effort →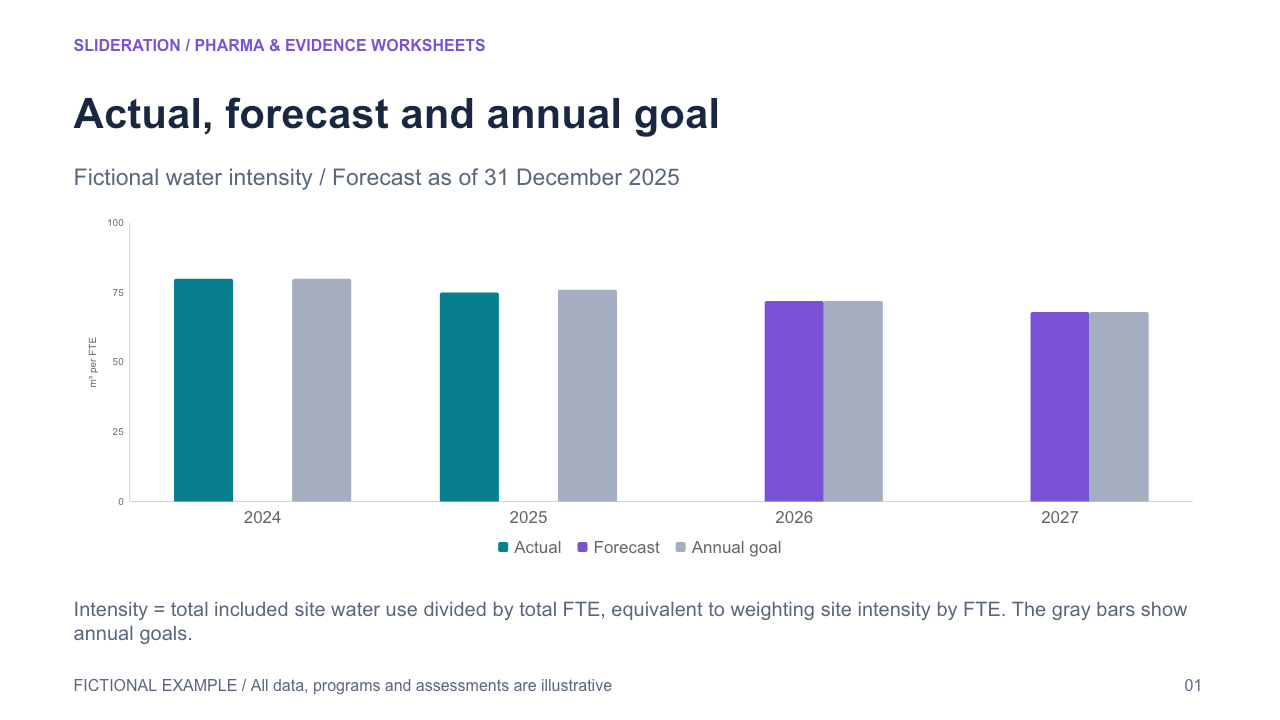
Actual, forecast and annual goal — A time-series performance measure separates observed values from forecast values and an independently defined annual goal, retaining the intensity denominator and forecast-as-of date.
2 slides · 1 credit
Check inputs & editing effort →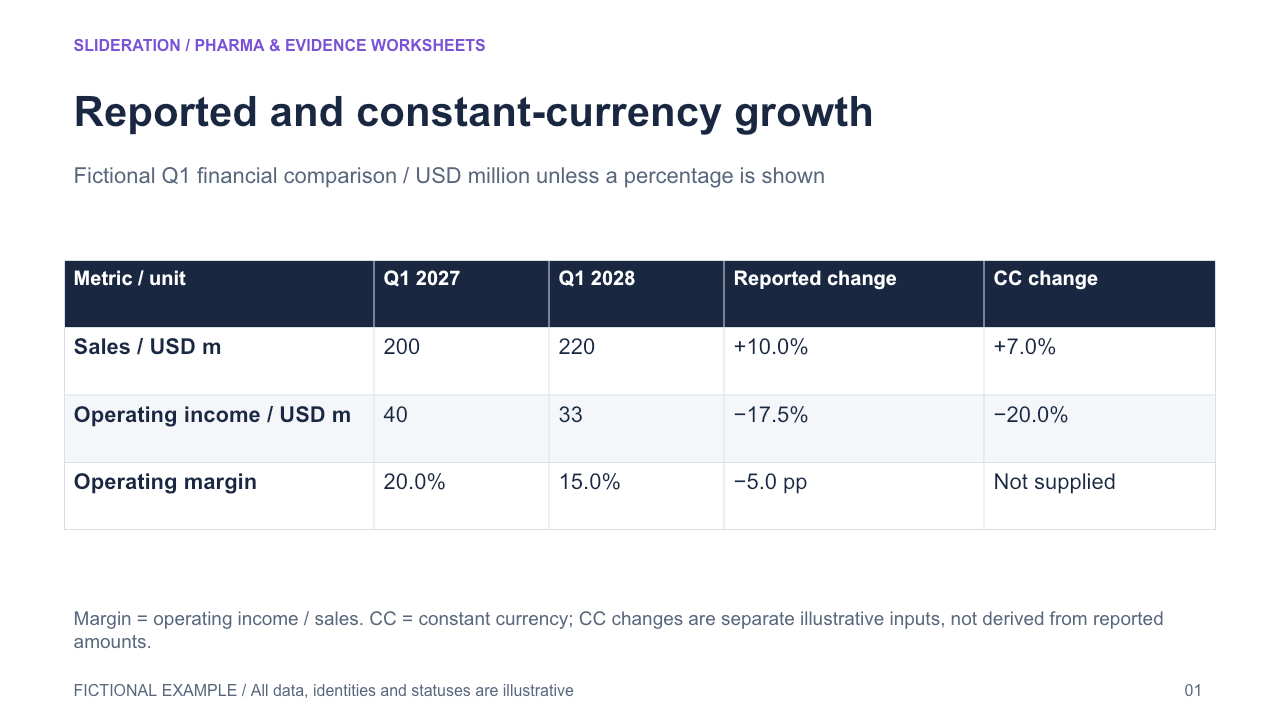
Reported and constant-currency growth — A same-period financial scorecard retains prior/current reported amounts, reported versus constant-currency growth, and typed margin changes in percentage points. Missing CC entries remain unavailable.
2 slides · 1 credit
Check inputs & editing effort →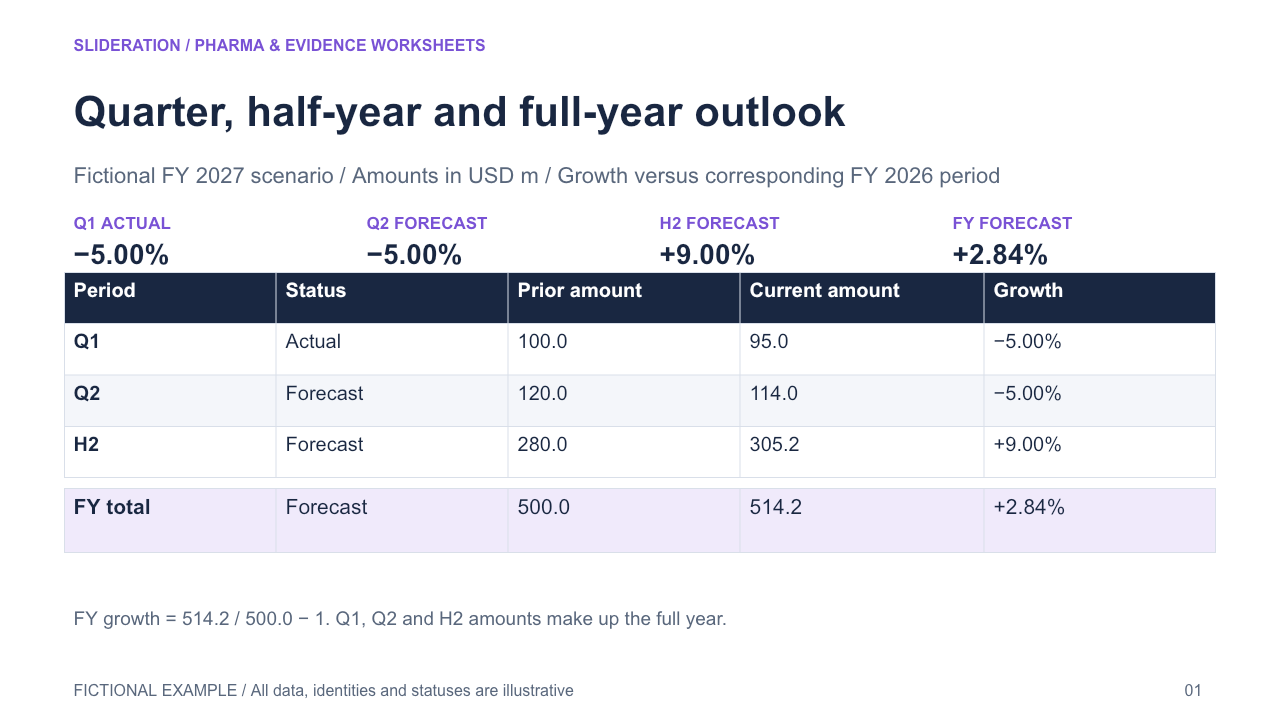
Quarter, half-year and full-year outlook — Quarter, half-year and full-year growth retain their different prior-period denominators, actual versus forecast status, and standalone versus cumulative scope. Full-year change is reconciled from amounts, not added growth rates.
2 slides · 1 credit
Check inputs & editing effort →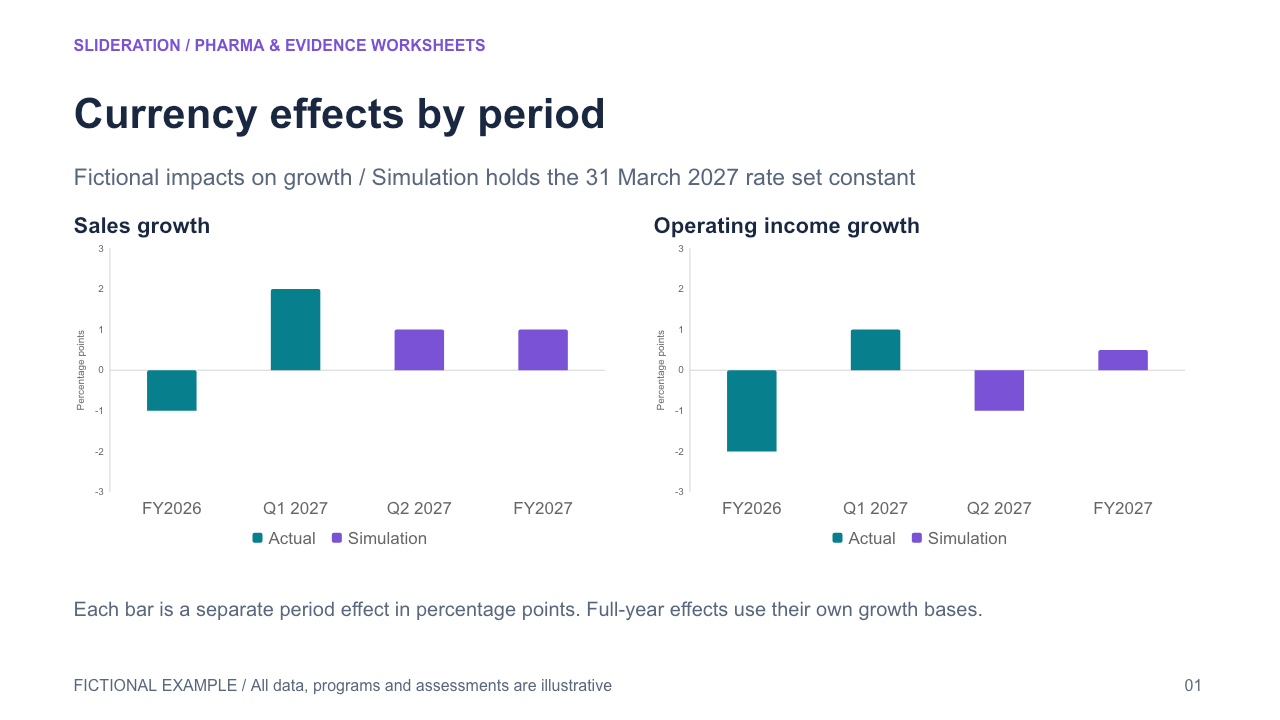
Currency effects by period — Two financial measures retain period-specific FX impact in percentage points, actual versus simulated status and a shared exchange-rate assumption. Full-year effects are separate estimates, not cumulative quarter bars.
2 slides · 1 credit
Check inputs & editing effort →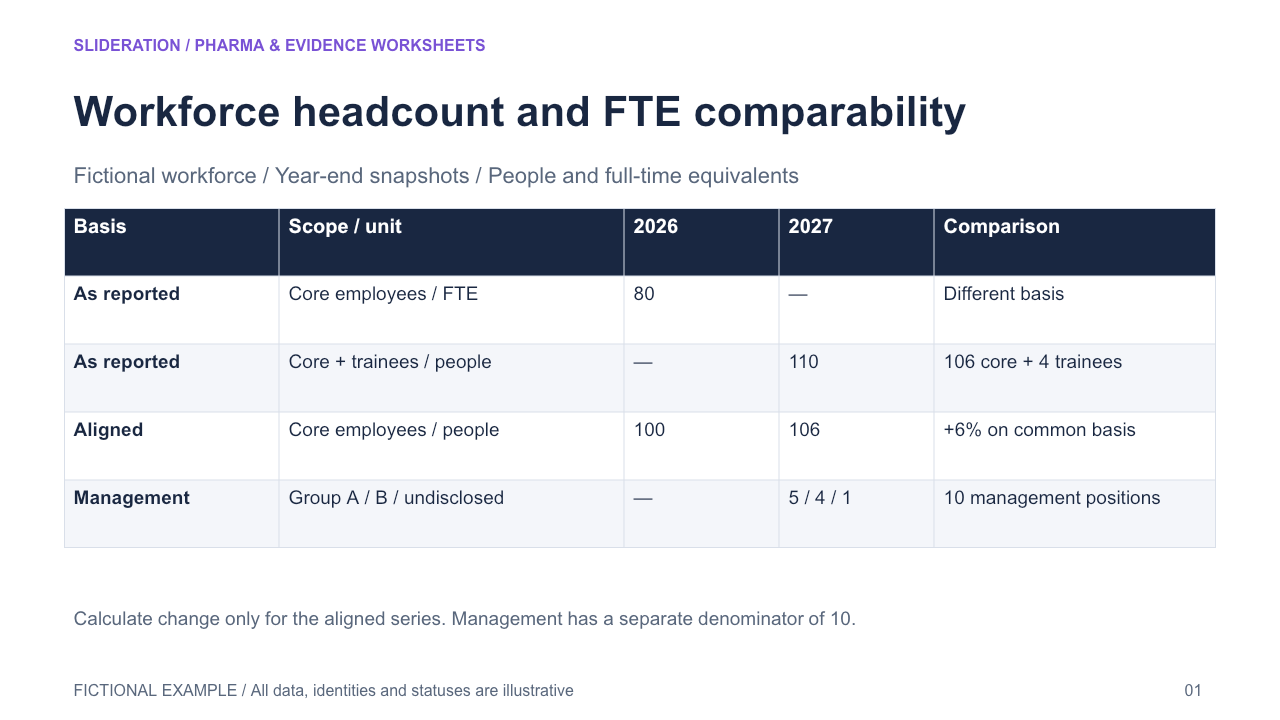
Workforce headcount and FTE comparability — Present reported workforce figures under changed units and population boundaries, with a separate aligned comparison only where both periods are available on the same basis. Reconcile composition panels within each stated denominator.
2 slides · 1 credit
Check inputs & editing effort →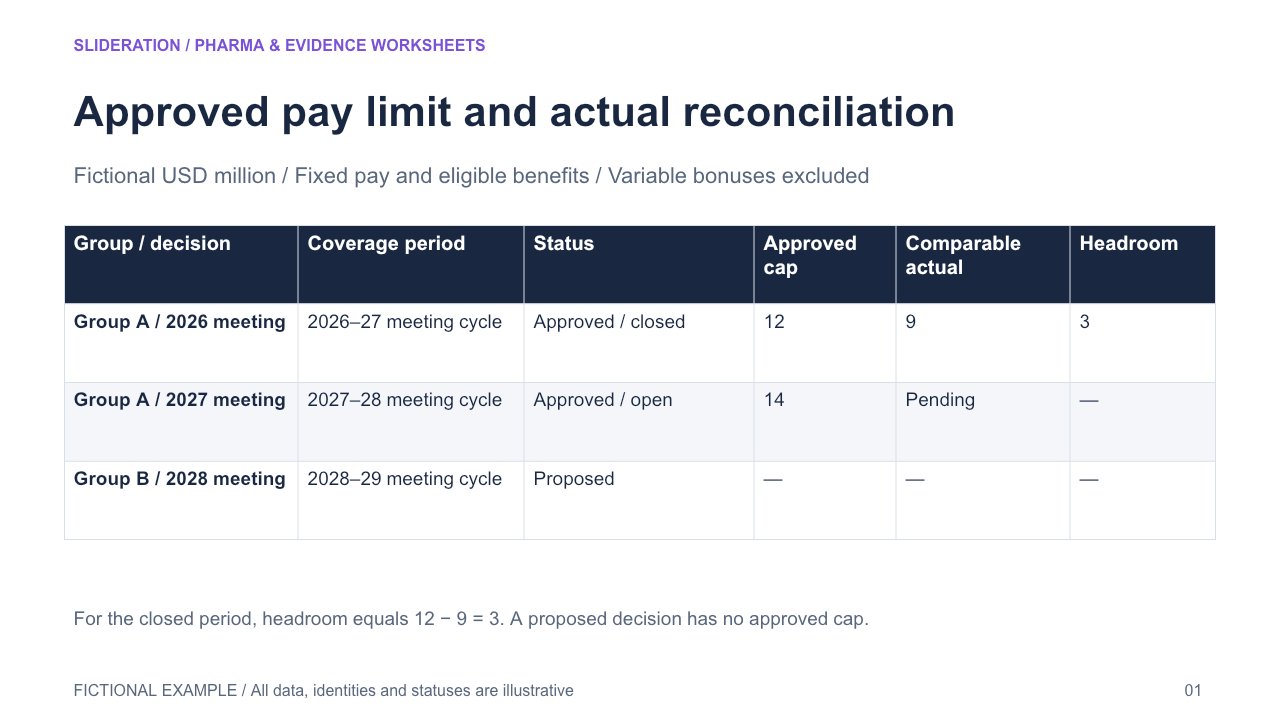
Approved pay limit and actual reconciliation — Match each approval decision to its covered period and included components, compare actual amounts on that same basis, and leave headroom blank for proposals or periods still open.
2 slides · 1 credit
Check inputs & editing effort →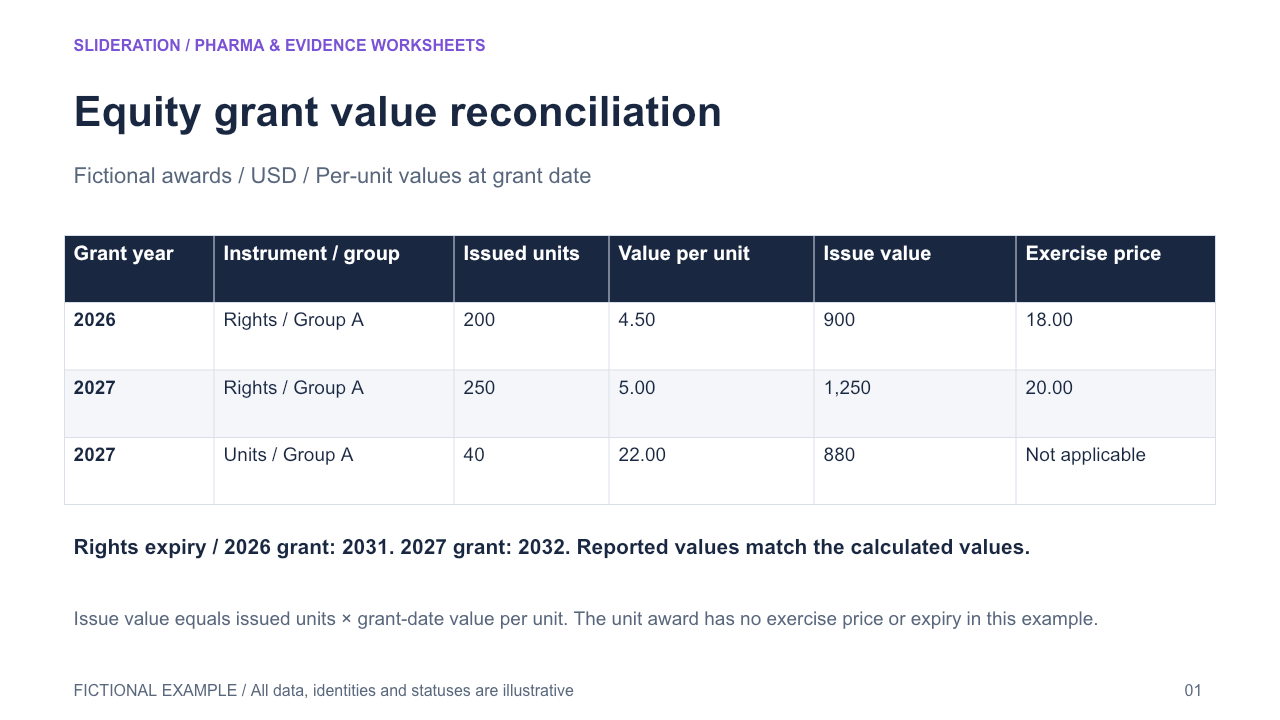
Equity grant value reconciliation — Compare issued award quantities by grant period and instrument, connecting each to grant-date unit value and issue value. Keep exercise price, expiry and disclosed rounding adjustments separate.
2 slides · 1 credit
Check inputs & editing effort →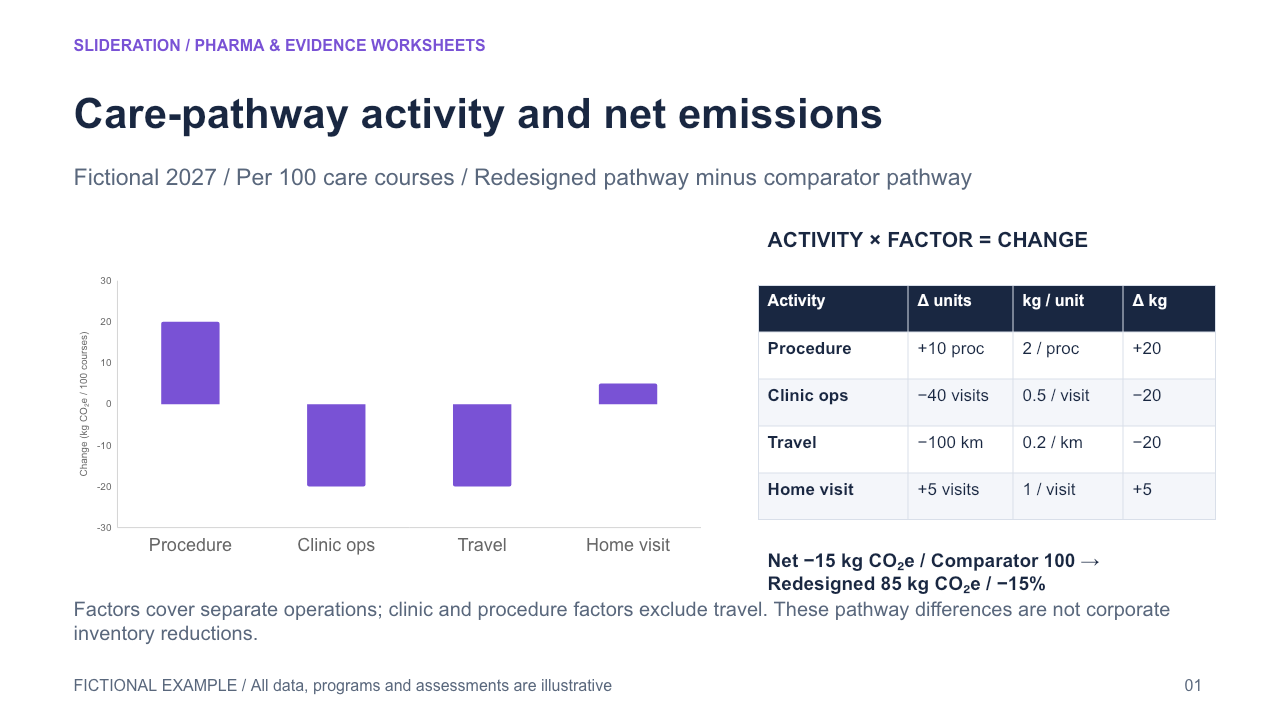
Care-pathway activity and net emissions — Connect increased and avoided care activities to signed emissions changes under one comparison scope. Reconcile the net difference across the care pathway. Inventory templates handle emissions scopes, and an ordinary bridge does not preserve the activity and factor basis for each contribution.
2 slides · 1 credit
Check inputs & editing effort →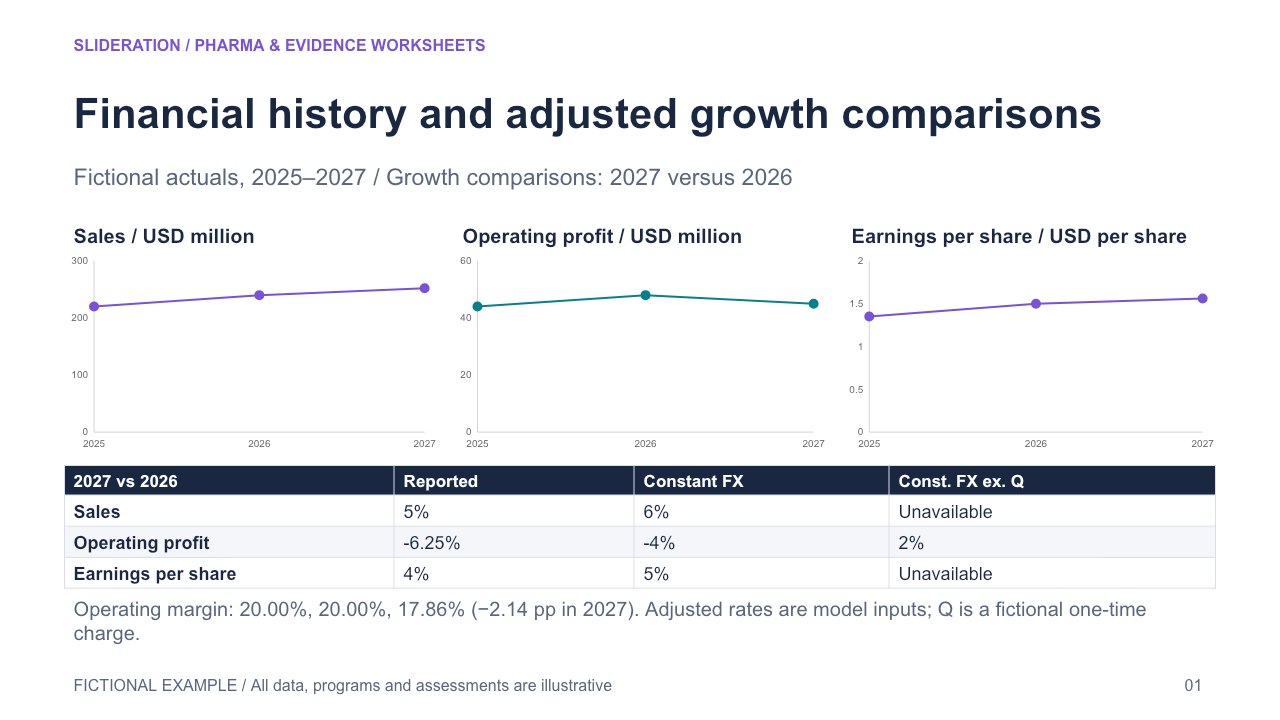
Financial history and adjusted growth comparisons — Align several years of actual amounts across metrics with distinct units. Attach reported, constant-currency and exclusion-adjusted comparisons to the same declared comparison window. The existing financial scorecard covers a single comparison, and the chart panels in the general library do not identify the basis of each adjustment.
2 slides · 1 credit
Check inputs & editing effort →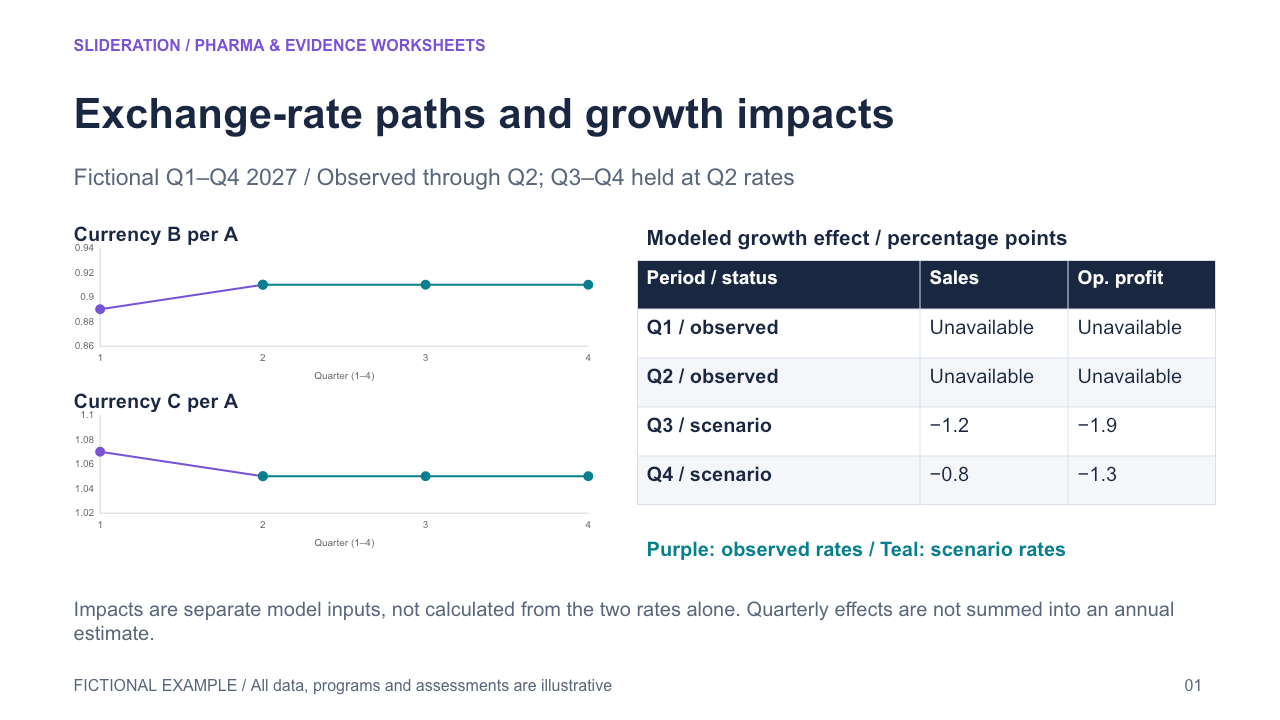
Exchange-rate paths and growth impacts — Show two quoted currency-pair trajectories with their observed cutoff and a common forward assumption, alongside modeled growth impacts on named measures and reporting periods. Existing growth-impact charts do not show the currency inputs; a single currency bridge does not preserve separate rate paths and period impacts.
2 slides · 1 credit
Check inputs & editing effort →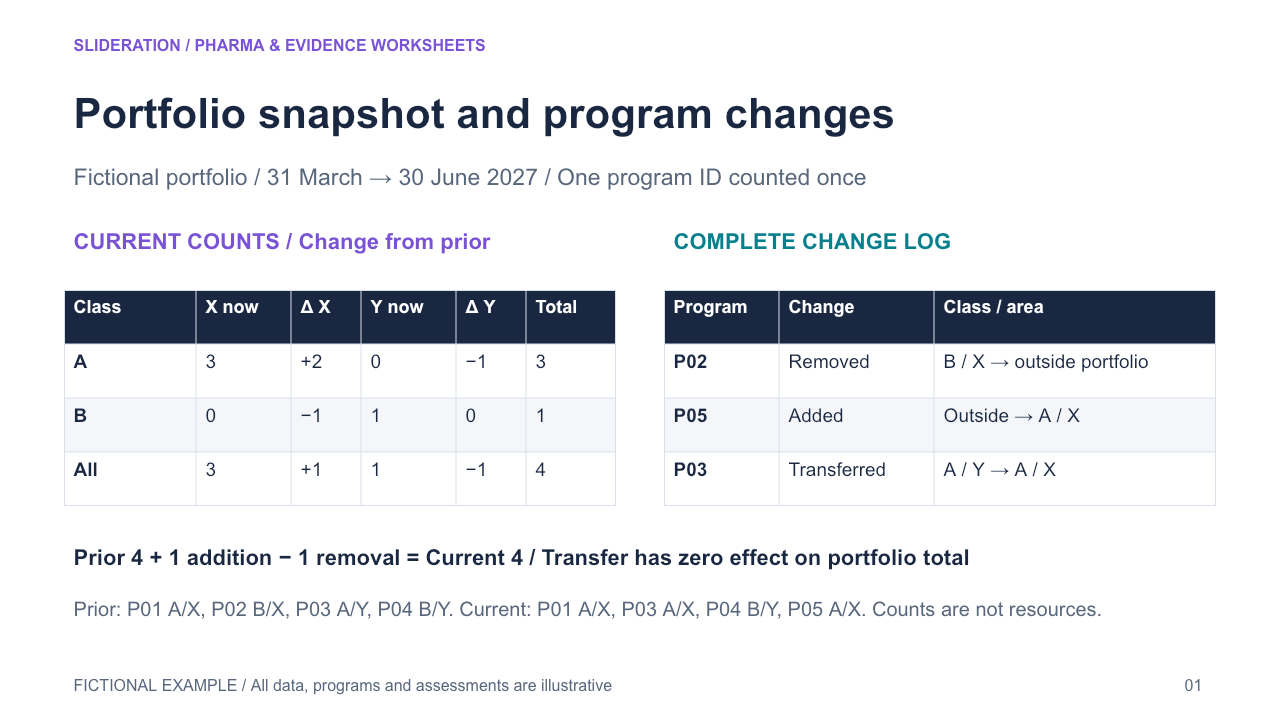
Portfolio snapshot and program changes — Reconcile a period-specific change log to current portfolio counts and net movements by program class and therapeutic area. Existing bridges reconcile one total, and existing composition charts do not connect class-by-area counts to program changes.
2 slides · 1 credit
Check inputs & editing effort →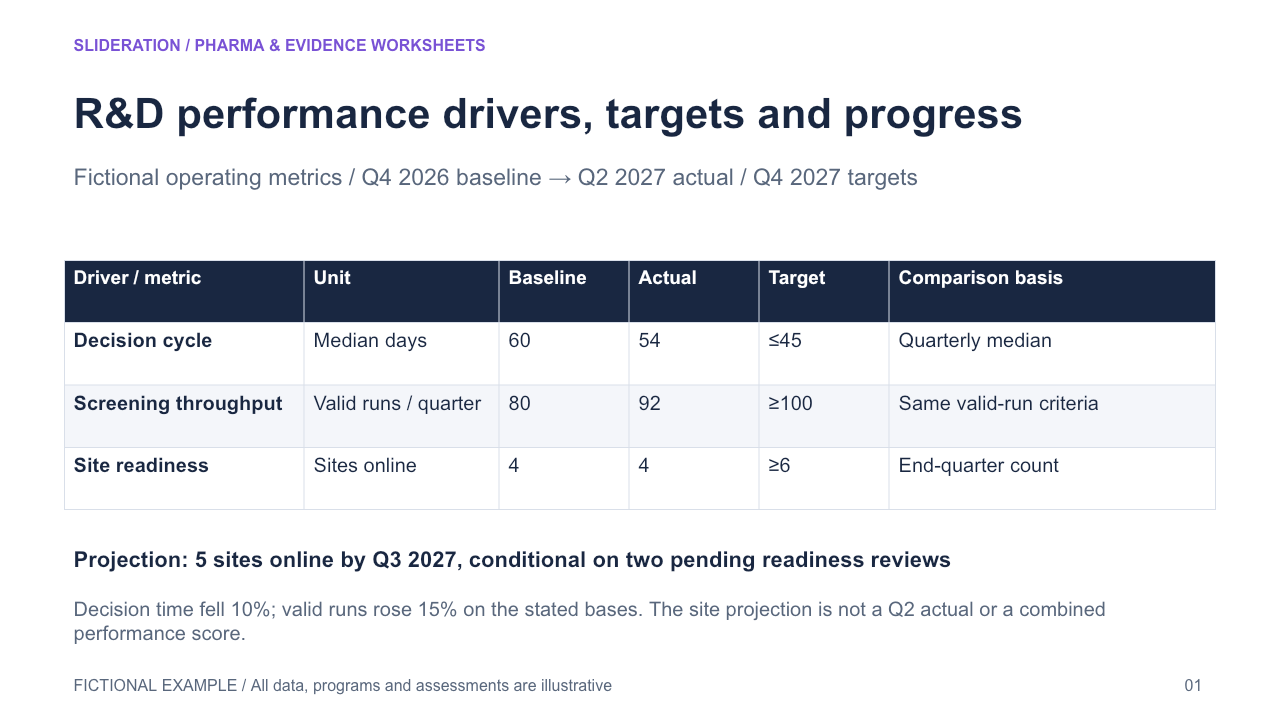
R&D performance drivers, targets and progress — Compare baseline, actual and target values for independent R&D drivers with explicit units and definitions; record conditional projections separately from actual observations.
2 slides · 1 credit
Check inputs & editing effort →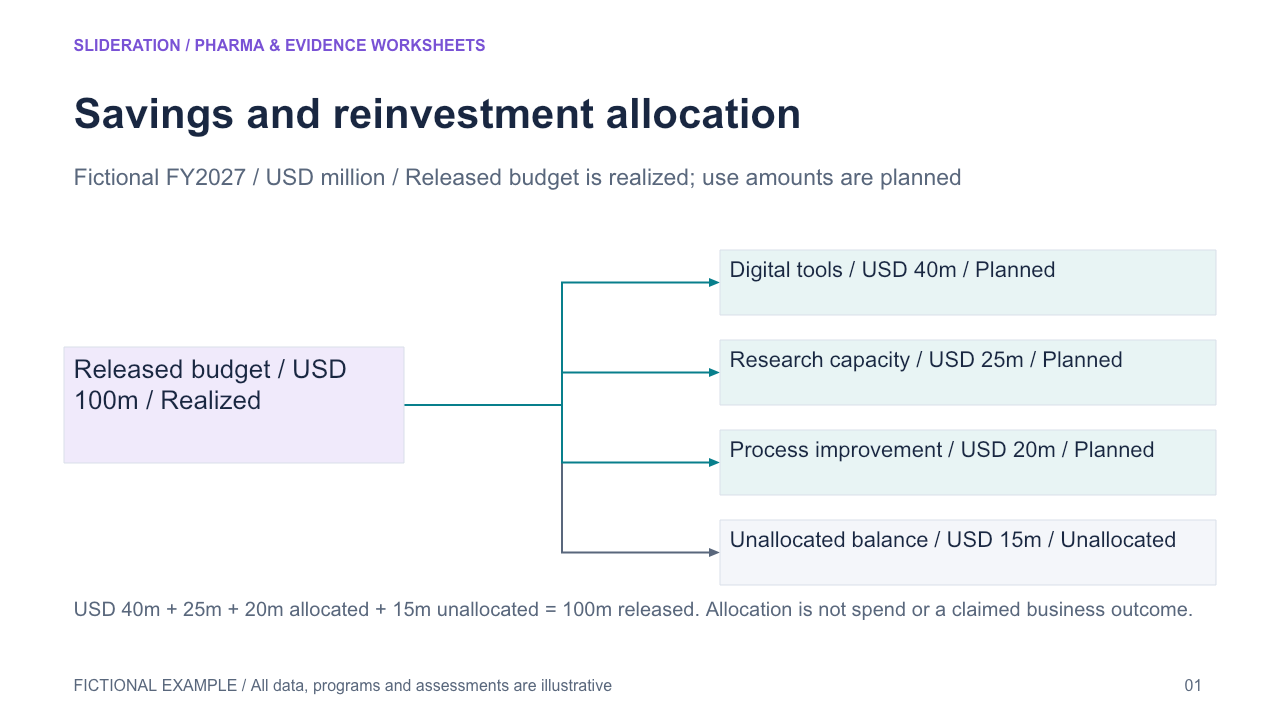
Savings and reinvestment allocation — Connect a defined pool of released budget to its categorized reinvestment uses. Verify that the use amounts reconcile to the released pool or show a labeled unallocated balance. Existing bridges track signed changes in a single total, and capital allocation hubs do not reconcile amounts released and assigned.
2 slides · 1 credit
Check inputs & editing effort →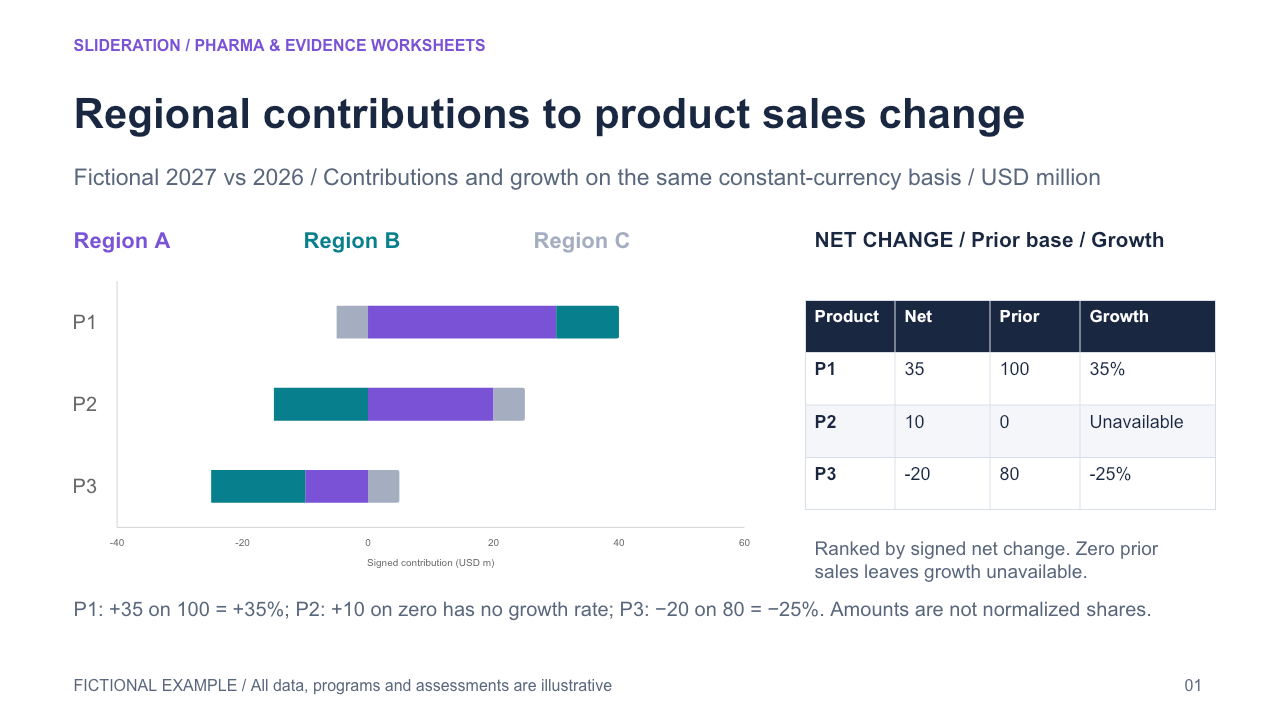
Regional contributions to product sales change — Place signed regional contributions on a common zero-based axis, ranked by net product change. Show constant-currency growth as a separate value and explicitly label the shared constant-currency basis of contributions and rates. Existing templates cover signed single-series ranks, normalized stacks or cumulative bridges separately.
2 slides · 1 credit
Check inputs & editing effort →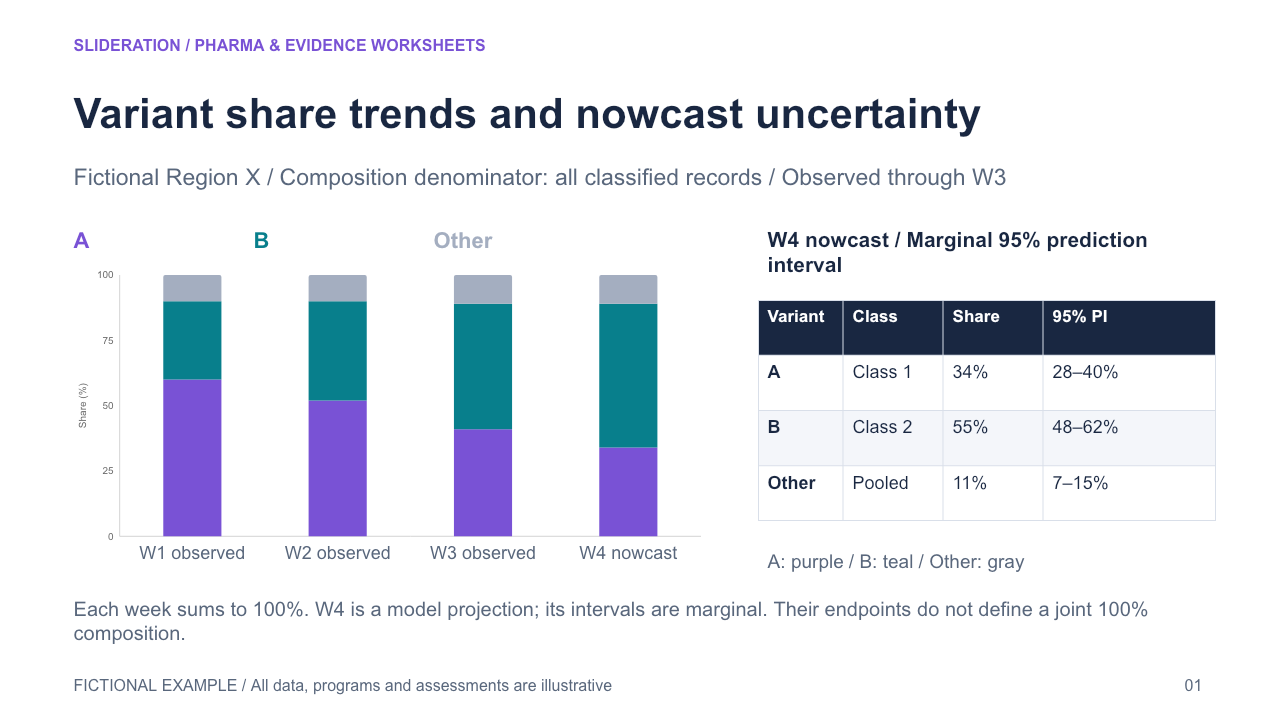
Variant share trends and nowcast uncertainty — Track composition over observed and nowcast weeks, then link each final-week series to its classification and prediction interval. Existing 100% stacks do not link the final modeled period to a same-week uncertainty table.
2 slides · 1 credit
Check inputs & editing effort →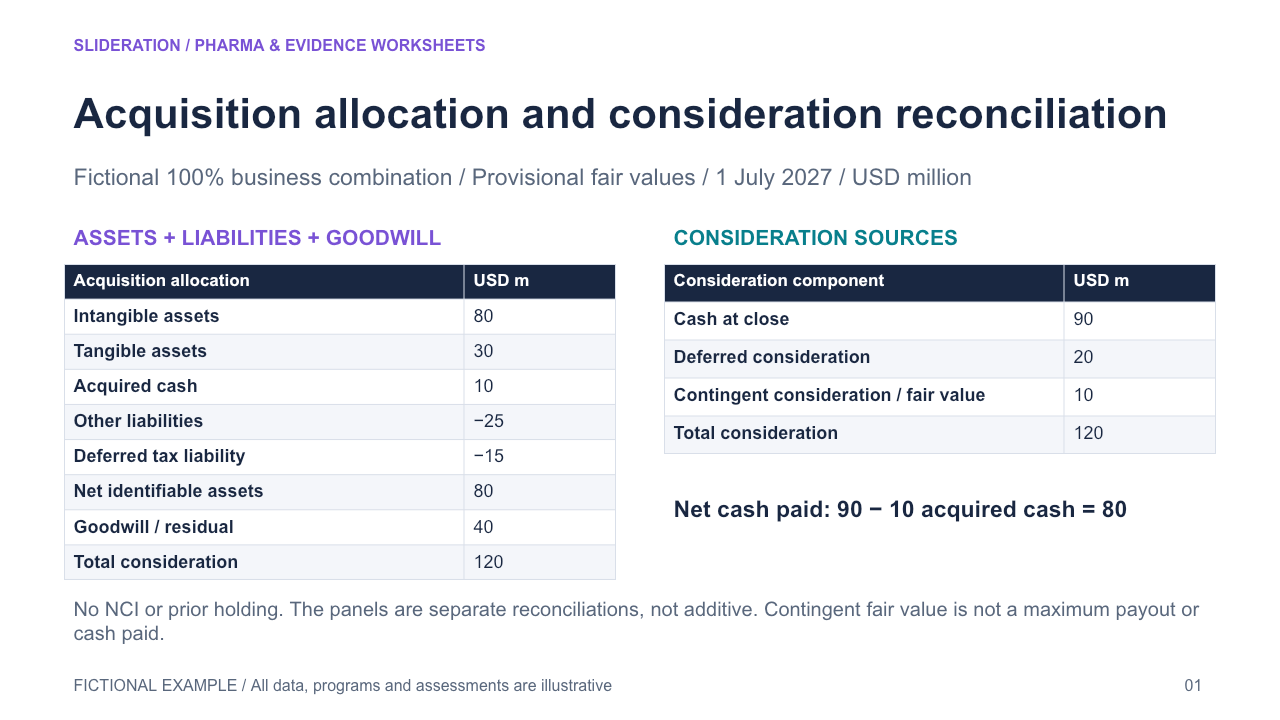
Acquisition allocation and consideration reconciliation — Reconcile signed identifiable assets and liabilities to net assets, residual goodwill and total consideration; separately reconcile the financing components to the same consideration total. A growth bridge has one identity; contingent payout schedules show contractual triggers rather than acquisition-date fair-value allocation.
2 slides · 1 credit
Check inputs & editing effort →