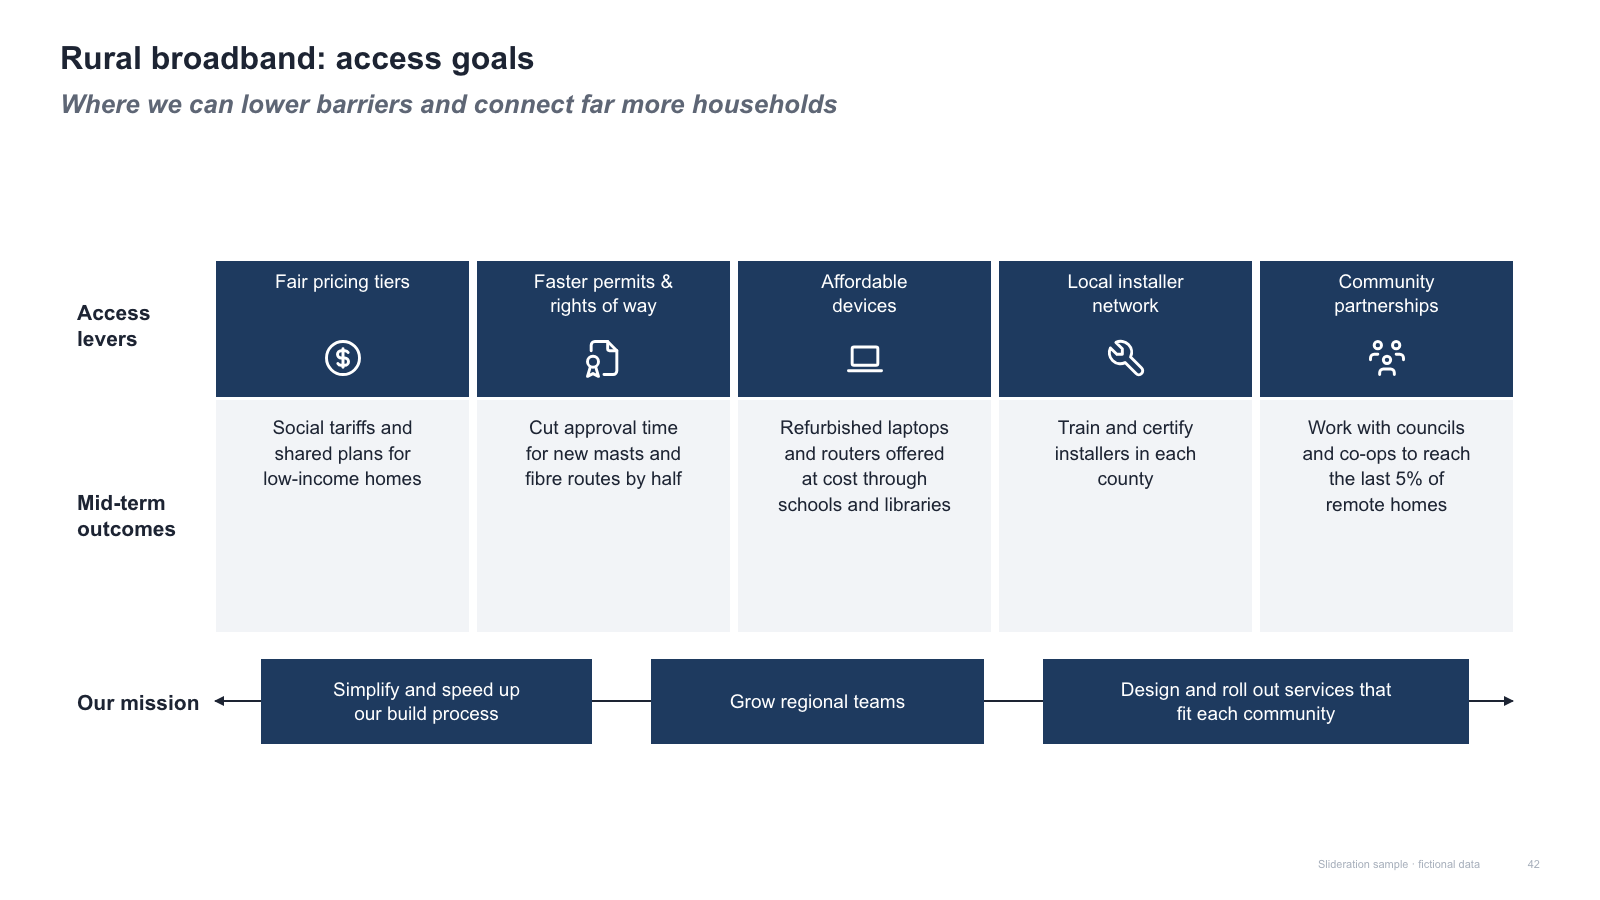
Five-column levers matrix
Five-column levers matrix with row labels and a mission arrow of three boxes
1 slides · 1 credit
Check inputs & editing effort →Which option meets the criteria?
Bring: Options assessed against common criteria, with comparable units and missing values identified.
Fit check: Use a process for ordered steps; use a trend chart for repeated measurements over time.
44 editable templates. Open a template to check its structure and editing requirements.
Five-column levers matrix with row labels and a mission arrow of three boxes
1 slides · 1 credit
Check inputs & editing effort →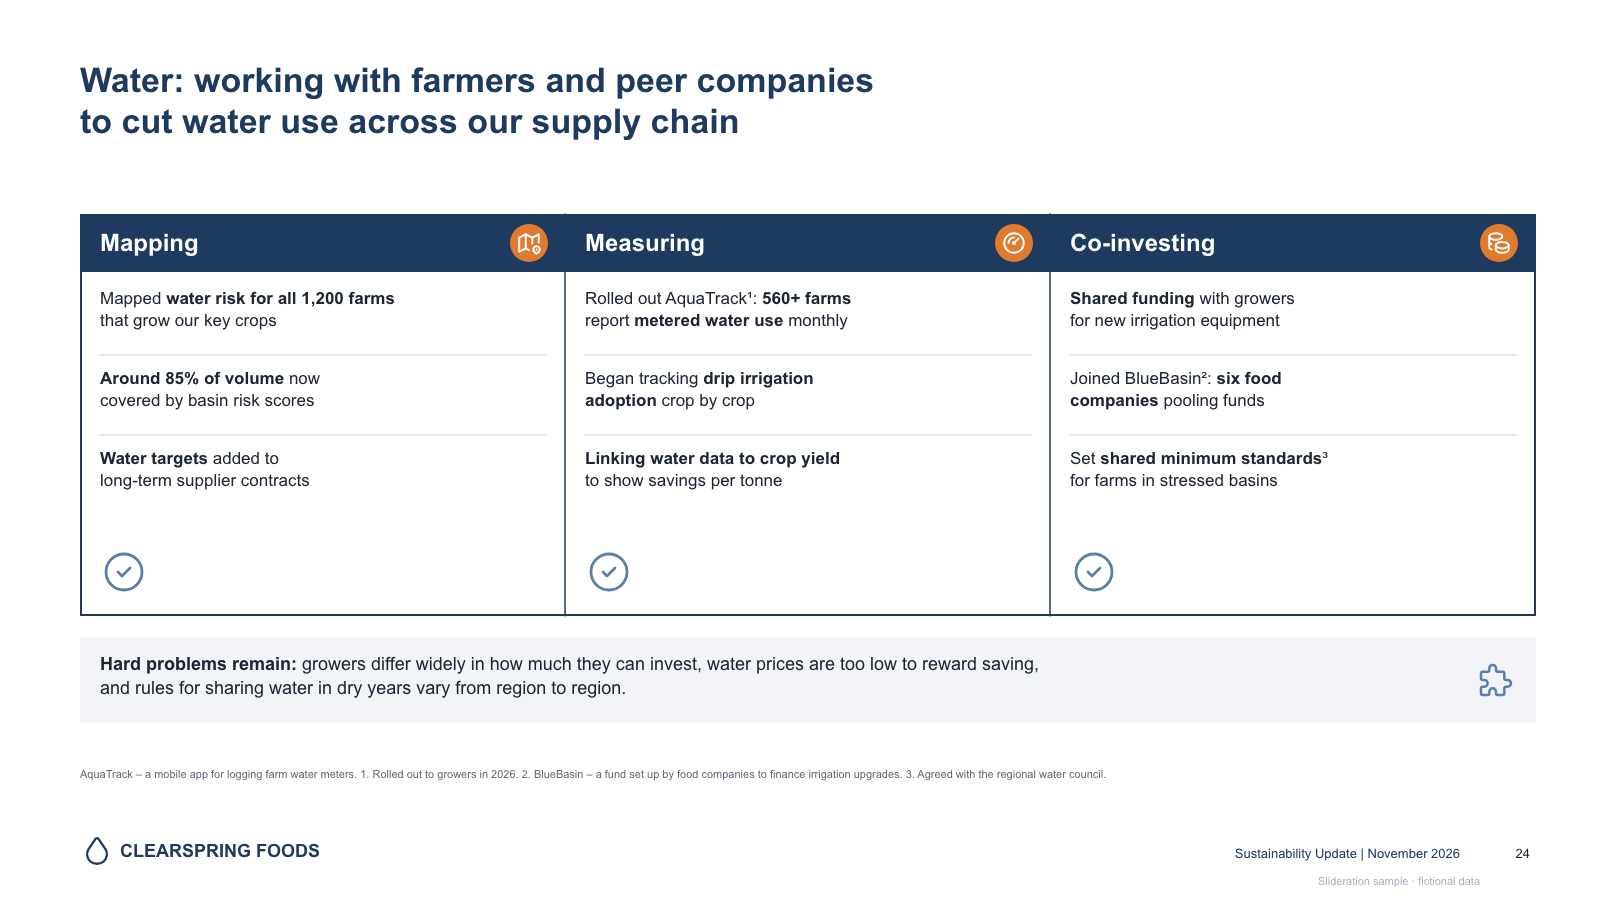
Three-column engagement table with icon headers, row dividers, check marks and a challenges bar
1 slides · 1 credit
Check inputs & editing effort →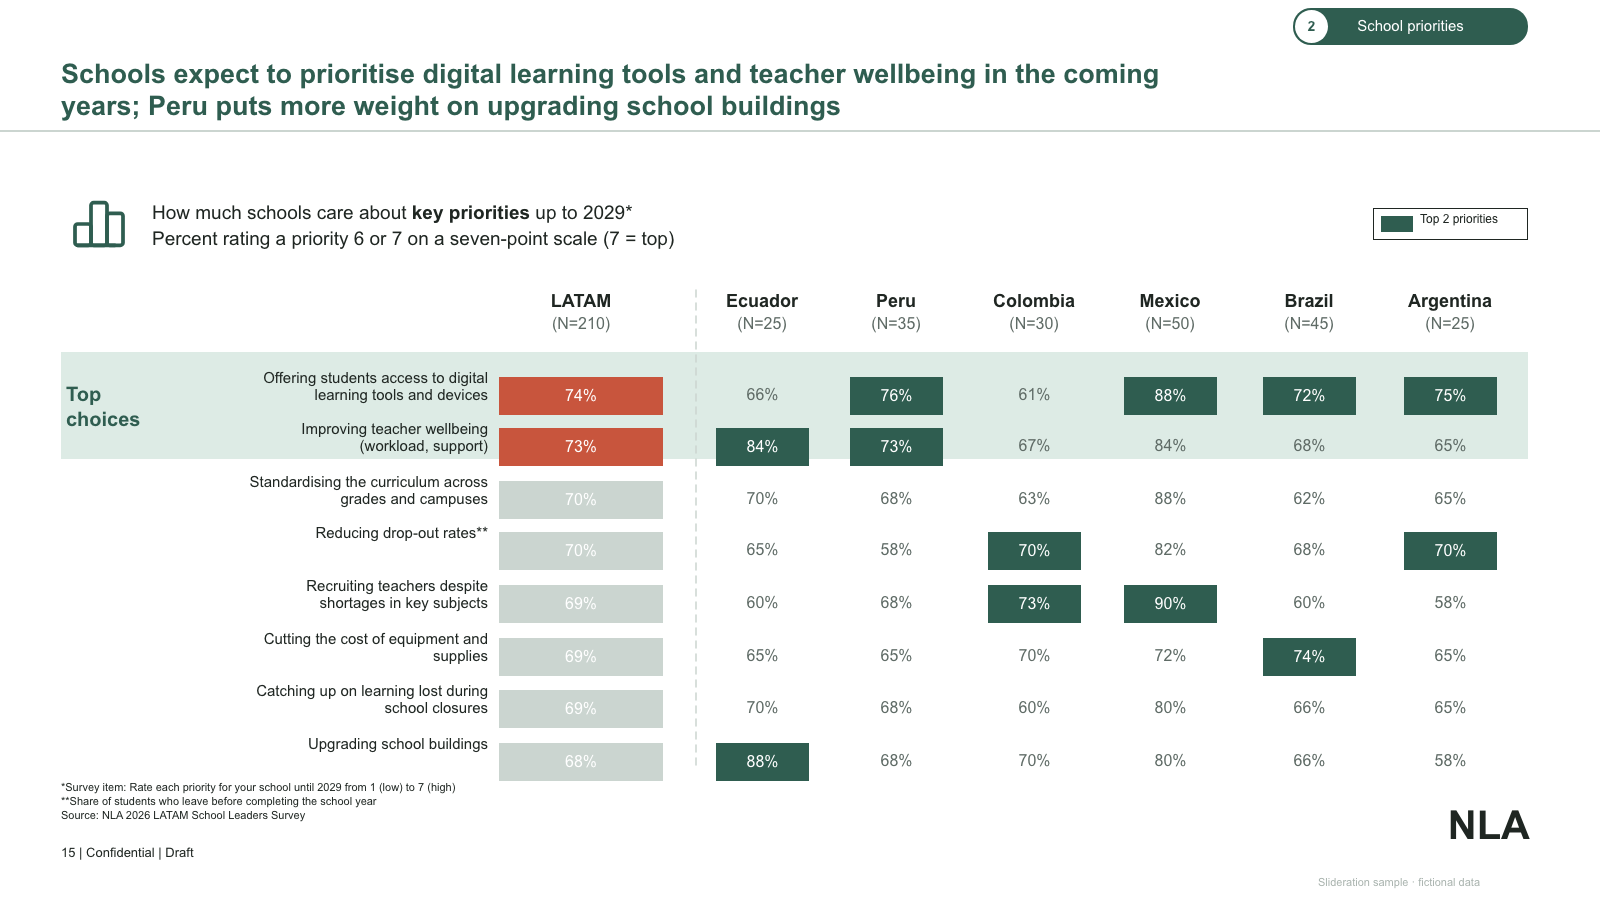
Heatmap-style priority table — regional column plus country columns with top-2 highlighting
1 slides · 1 credit
Check inputs & editing effort →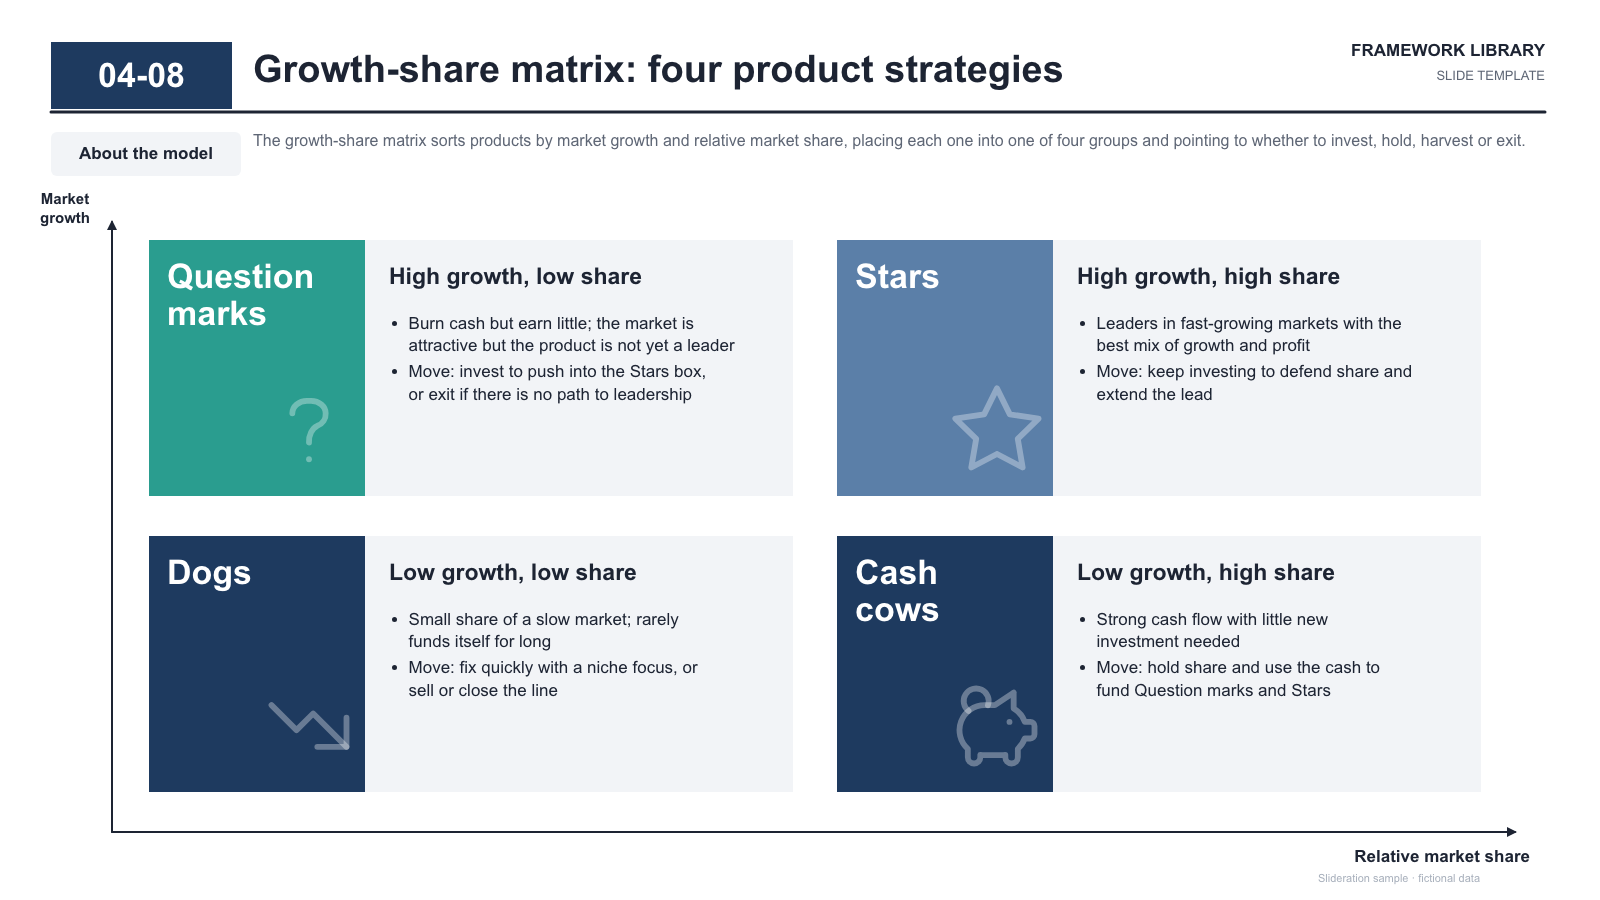
Growth-share 2x2 matrix — coloured label tiles with watermark icons and strategy panels on axes
1 slides · 1 credit
Check inputs & editing effort →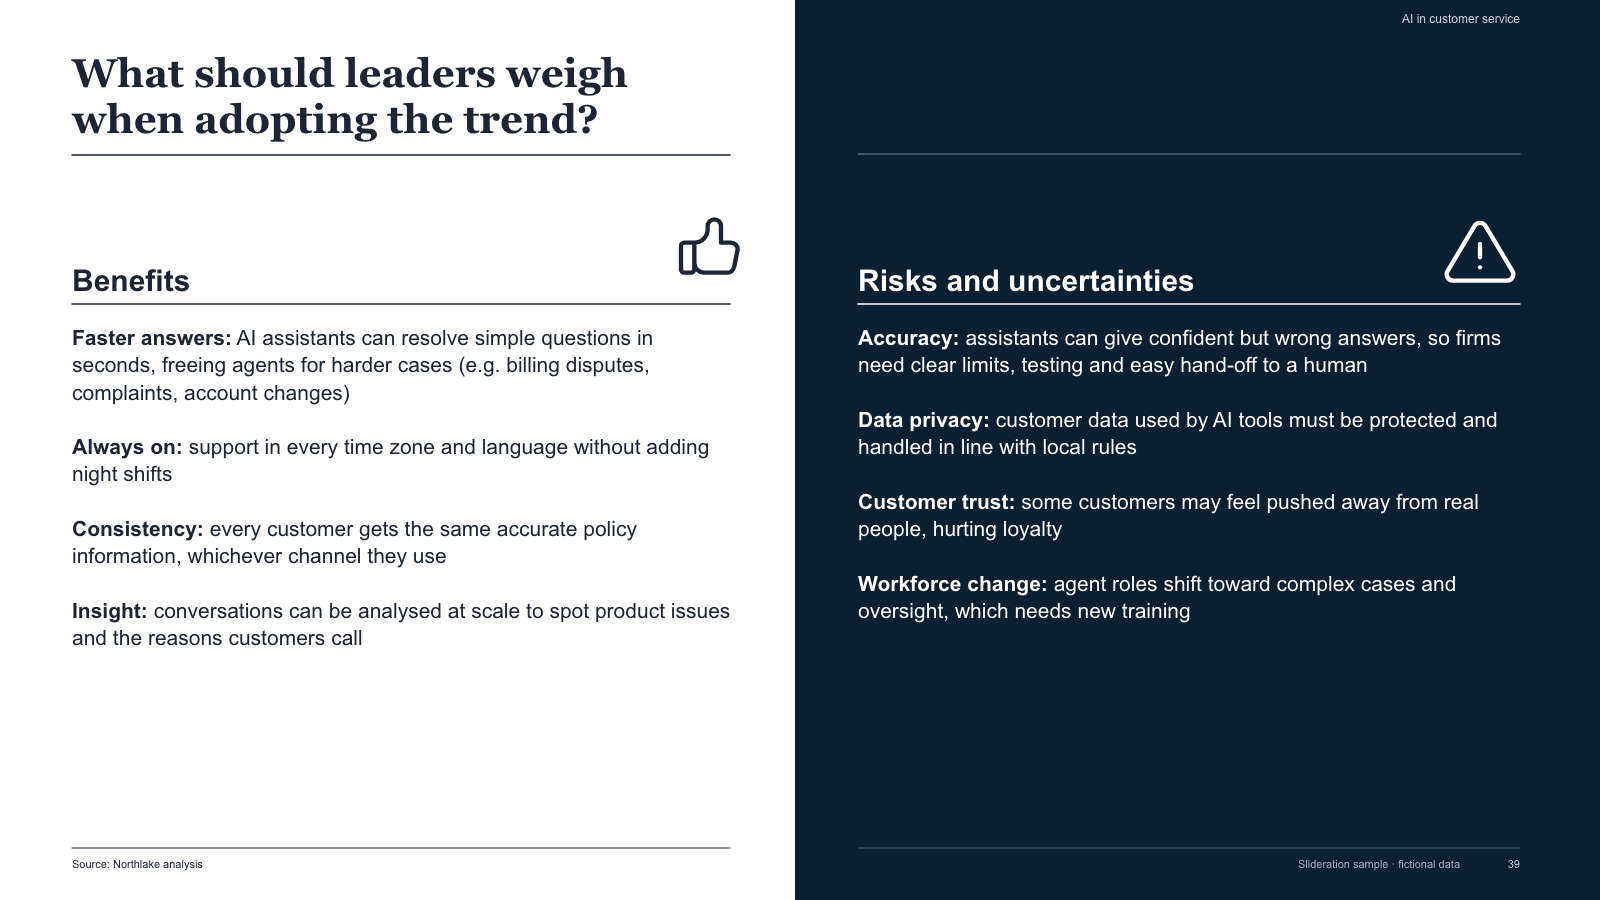
Split slide — white benefits column with serif headline and dark risks column, icon headings
1 slides · 1 credit
Check inputs & editing effort →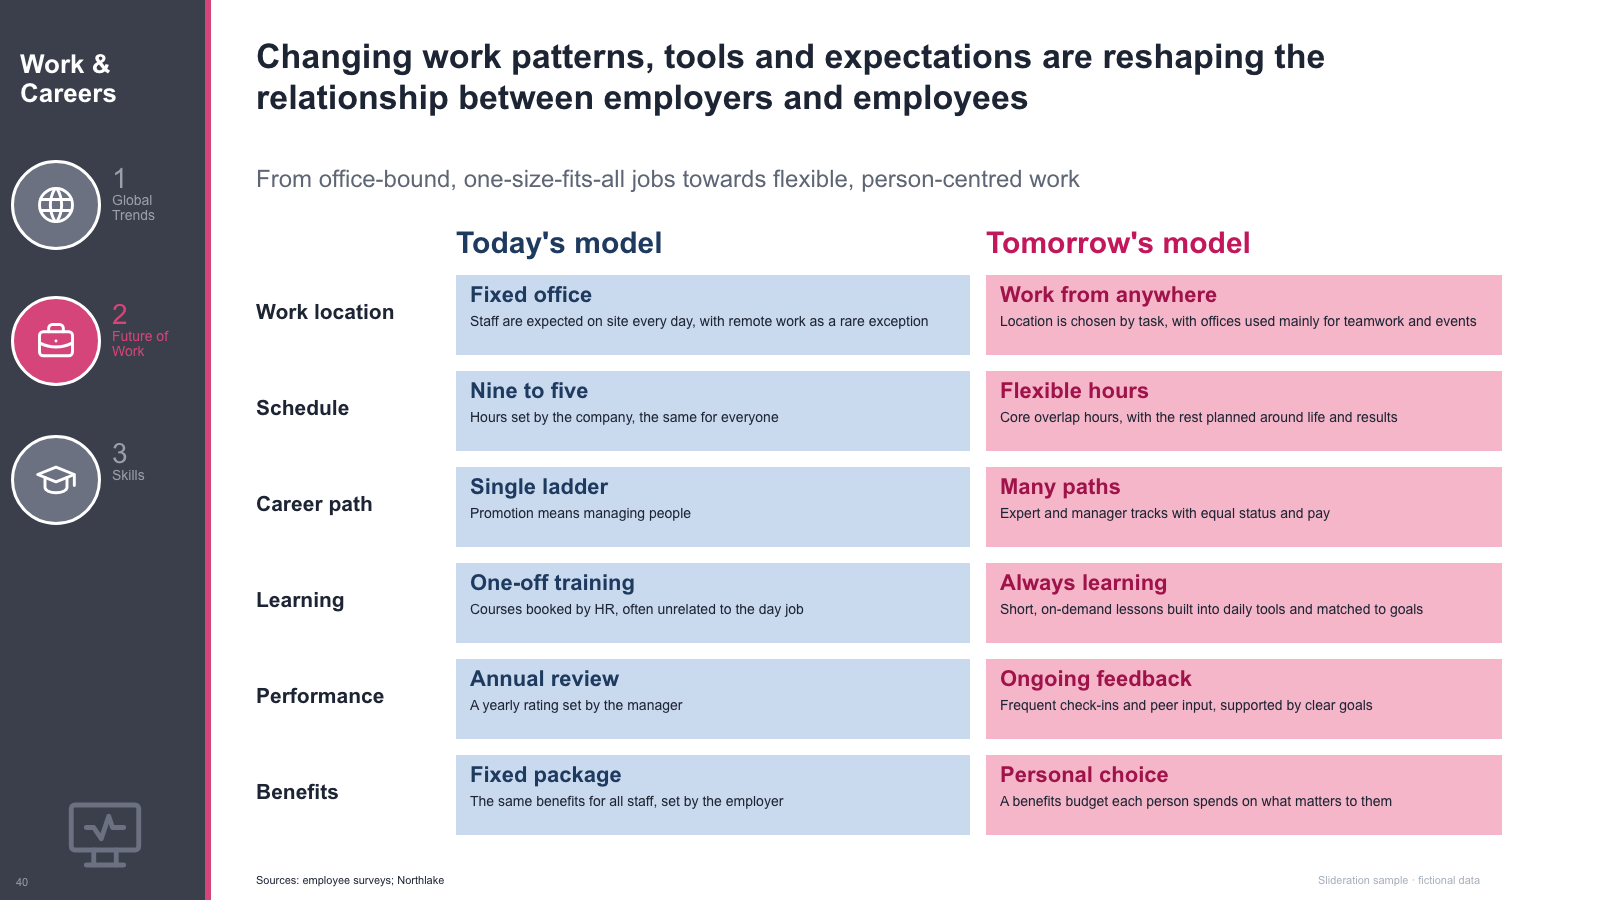
Dark section sidebar plus a current-vs-future two-column comparison table with row labels
1 slides · 1 credit
Check inputs & editing effort →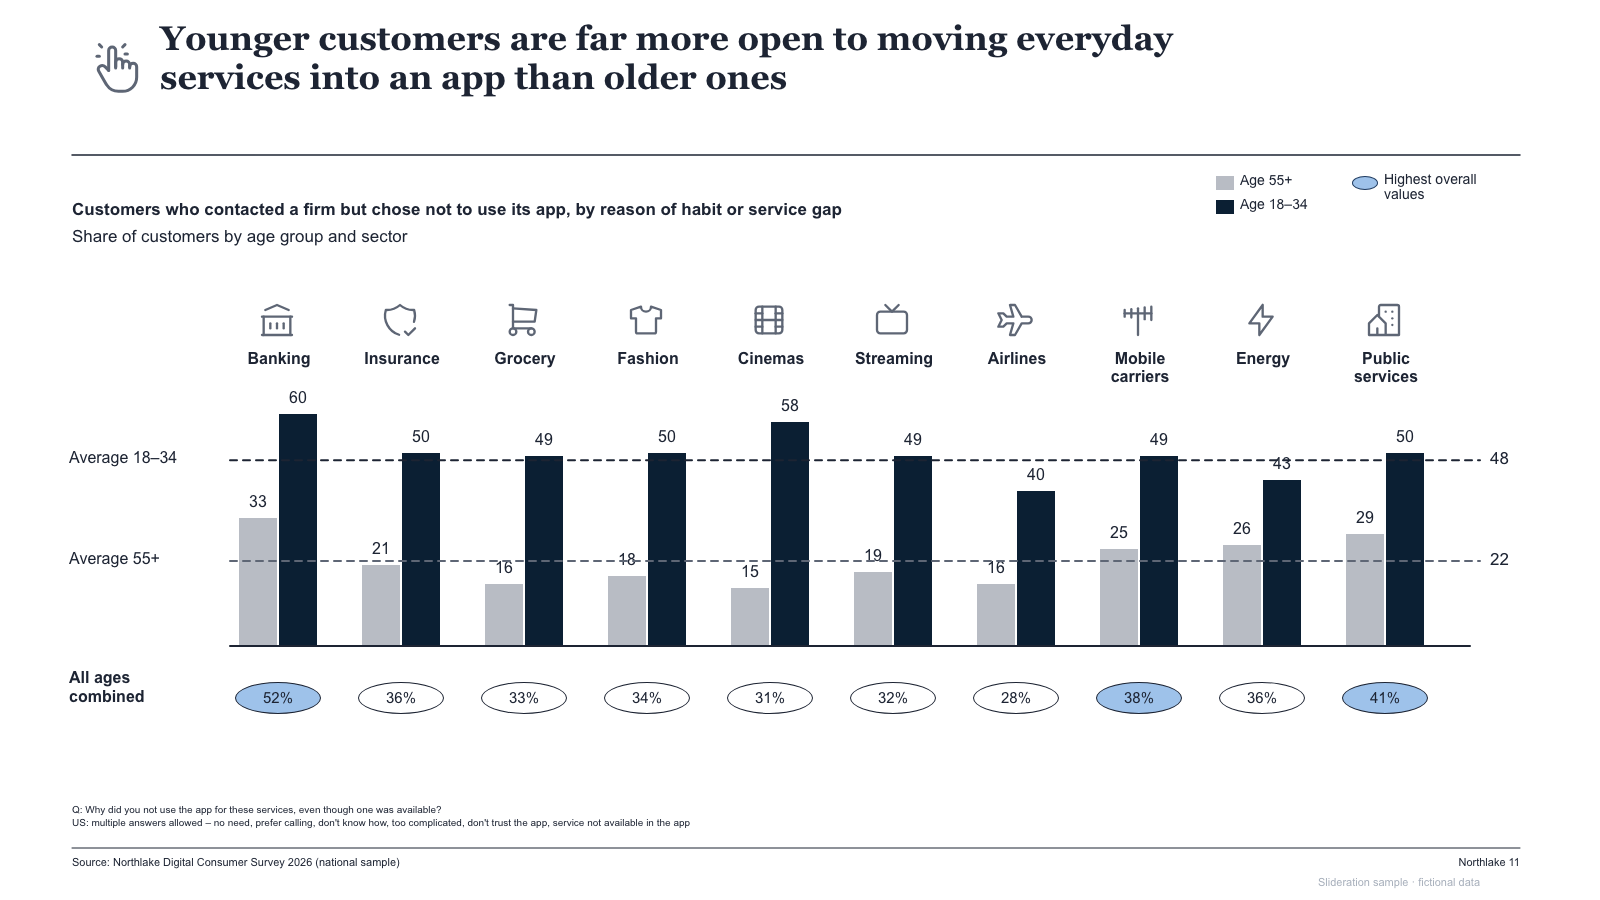
Paired columns by industry (two age groups) with dashed average lines and an average-pill row
1 slides · 1 credit
Check inputs & editing effort →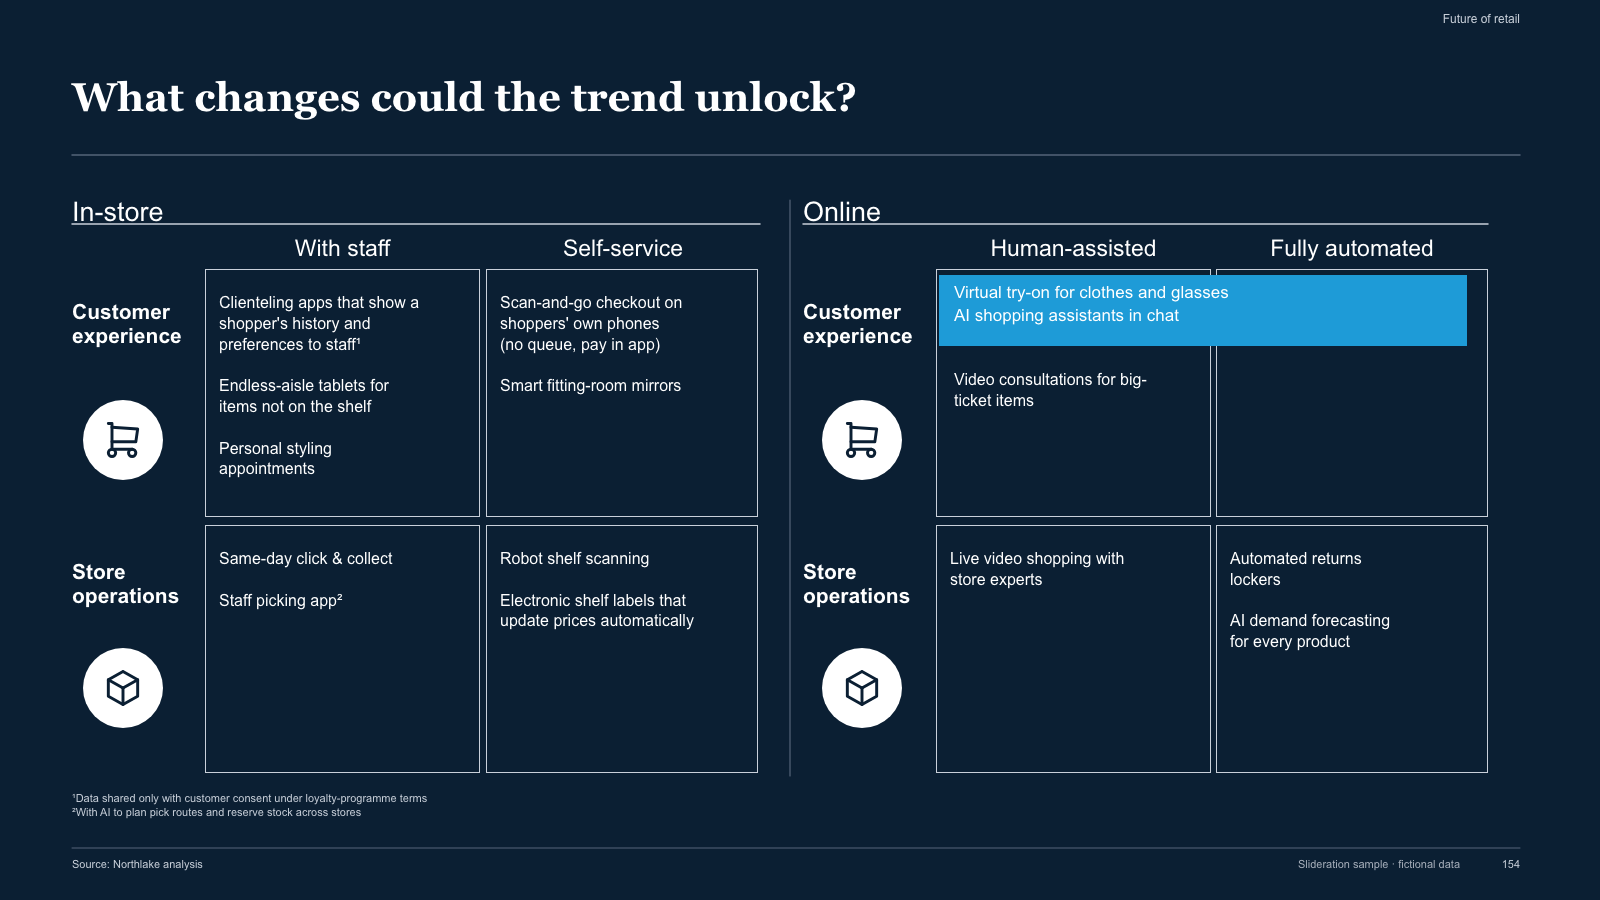
Dark 2x2x2 opportunity grid — two domains, each split into two modes and two use-case rows
1 slides · 1 credit
Check inputs & editing effort →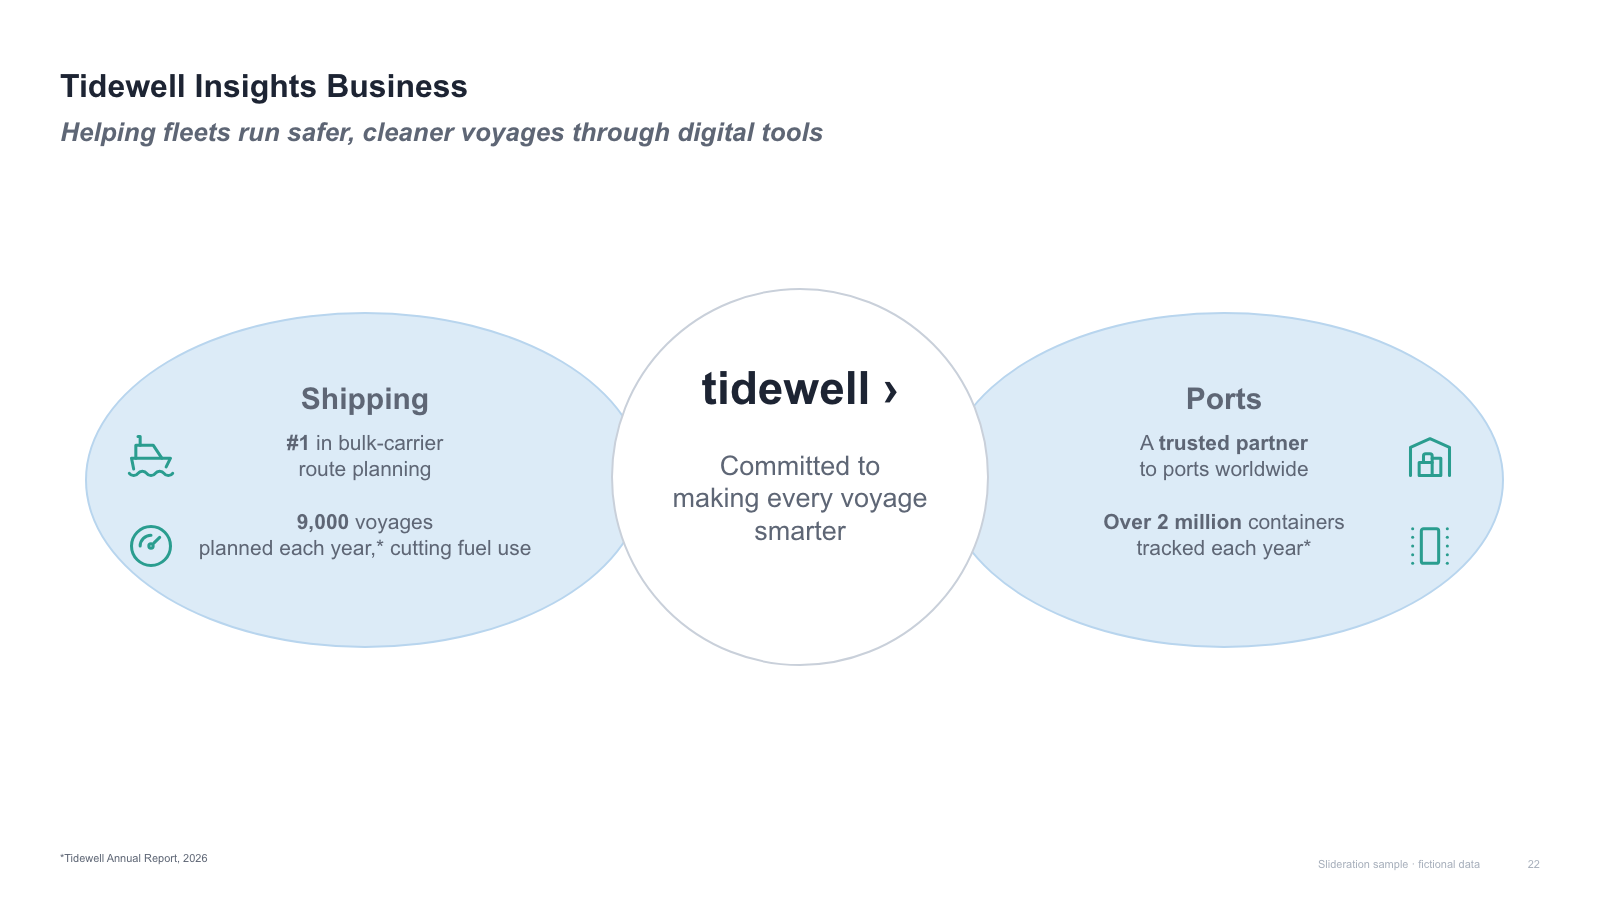
Two side ellipses bridged by a central white circle, each with headline, stats and icons
1 slides · 1 credit
Check inputs & editing effort →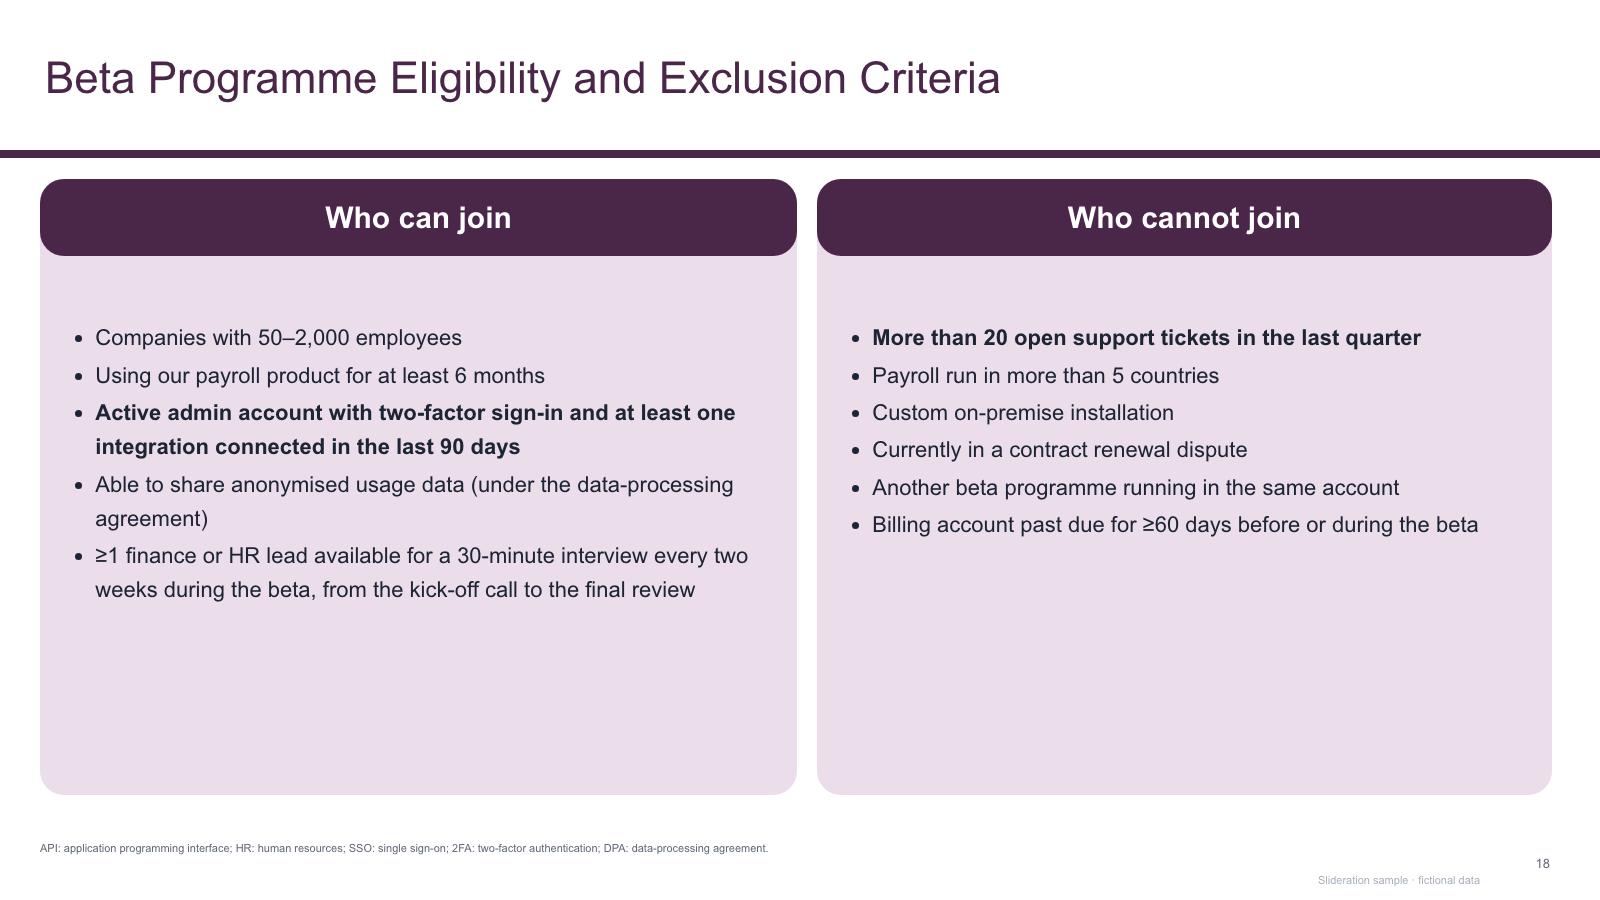
Two criteria panels with dark rounded headers and tinted bullet bodies
1 slides · 1 credit
Check inputs & editing effort →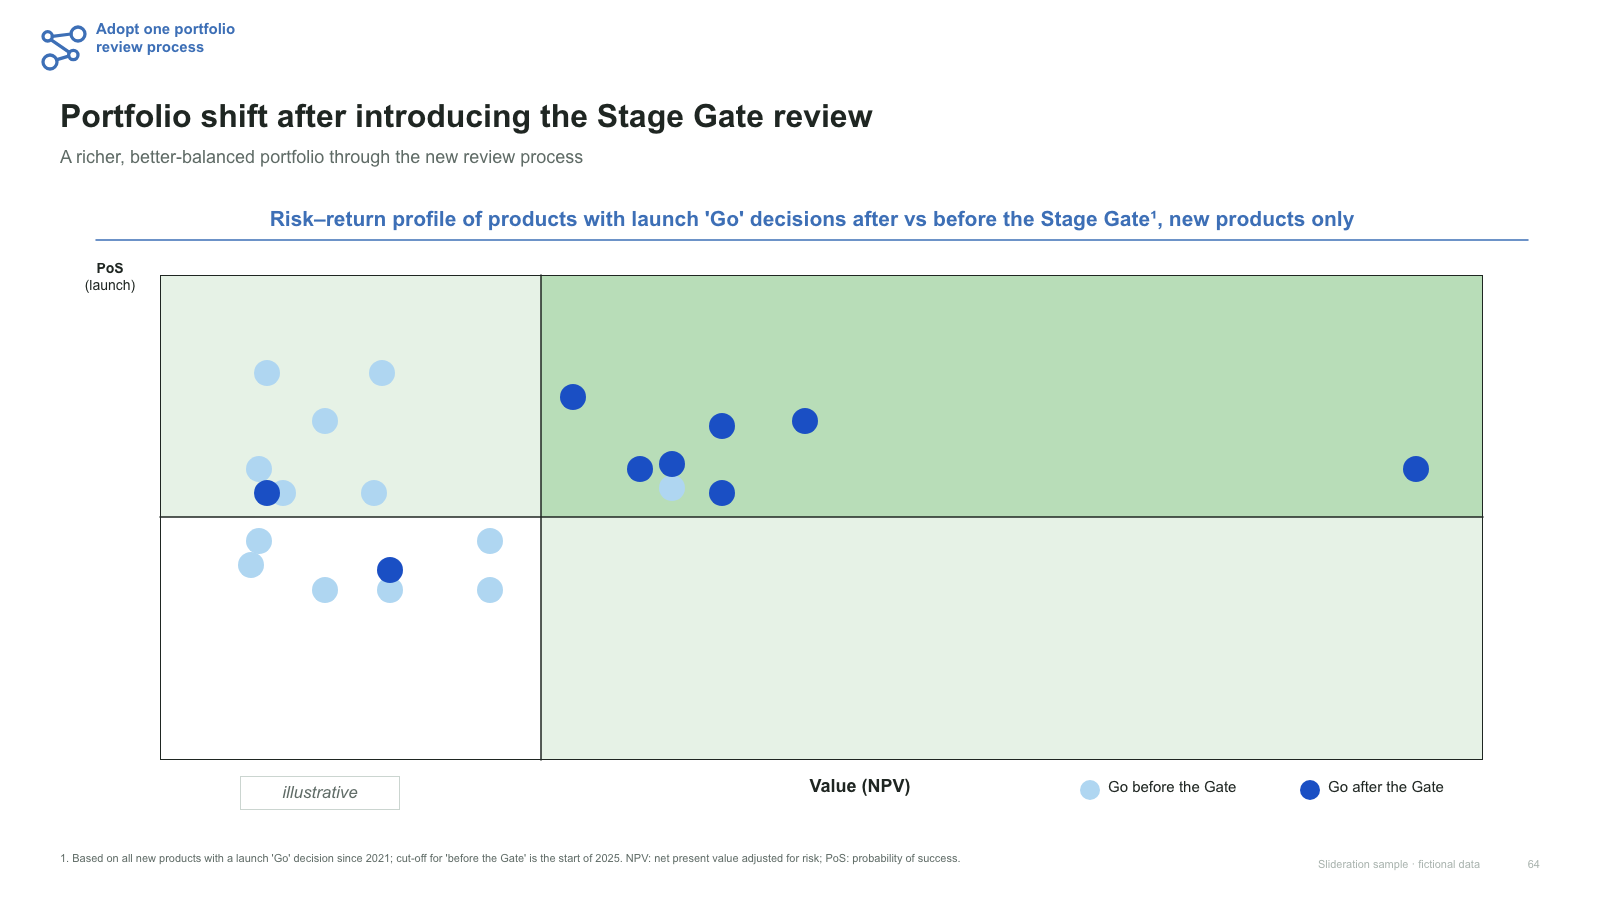
Quadrant scatter chart comparing two cohorts, with tinted quadrants, axis labels and legend
1 slides · 1 credit
Check inputs & editing effort →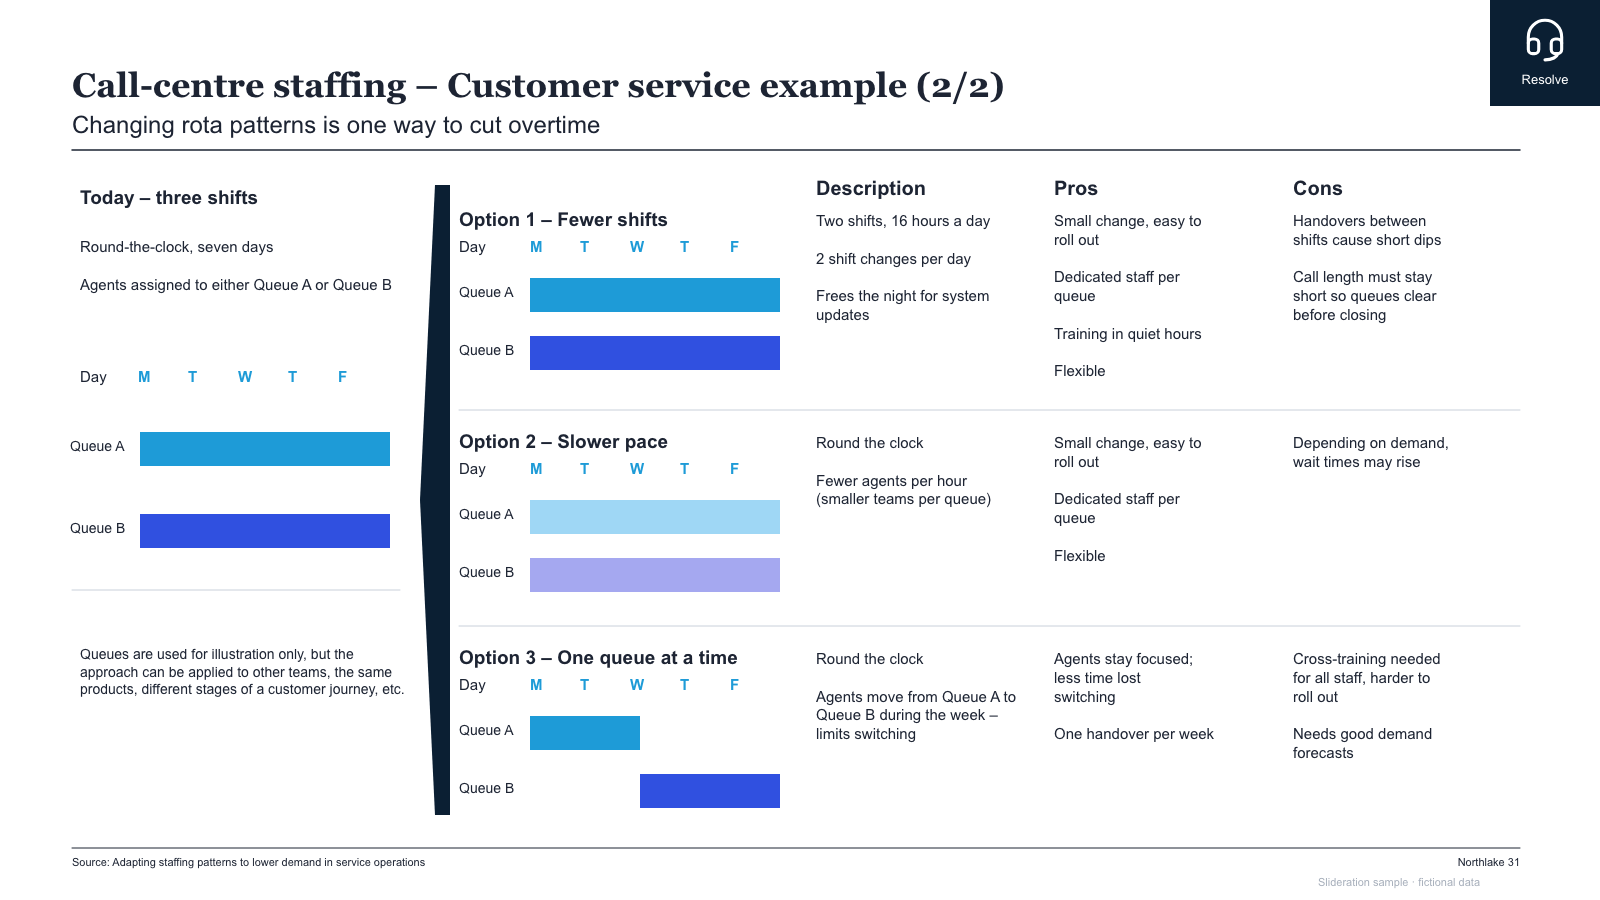
Option comparison — baseline schedule, three option rows each with a mini weekday grid and description/pros/cons columns
1 slides · 1 credit
Check inputs & editing effort →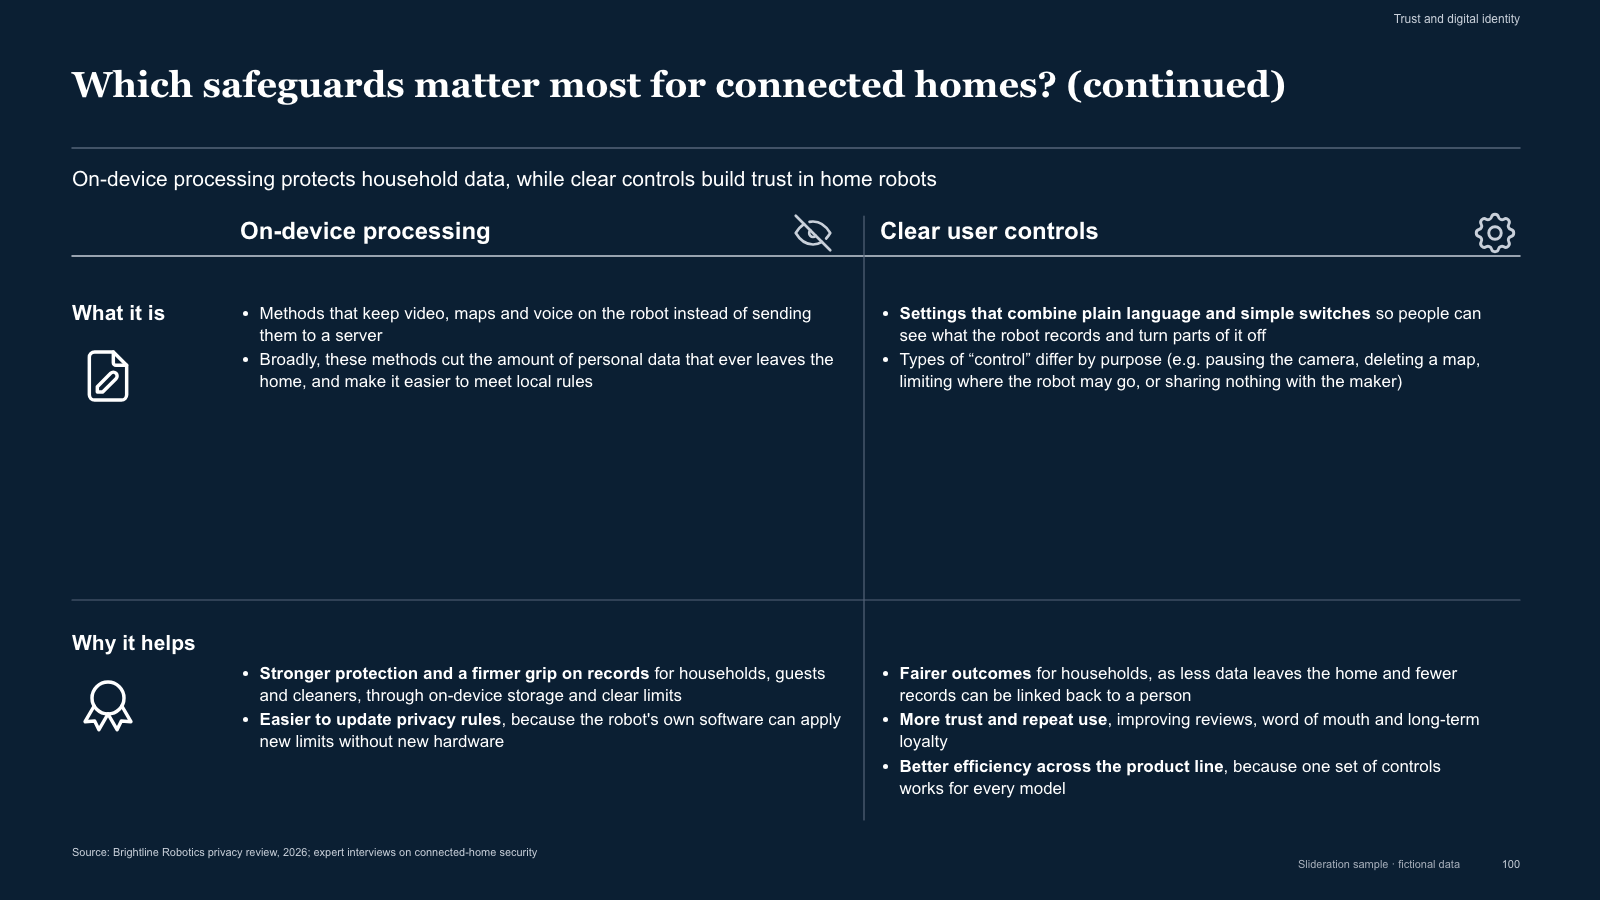
Dark comparison table — two technology columns with description and benefit rows, plus row icons
1 slides · 1 credit
Check inputs & editing effort →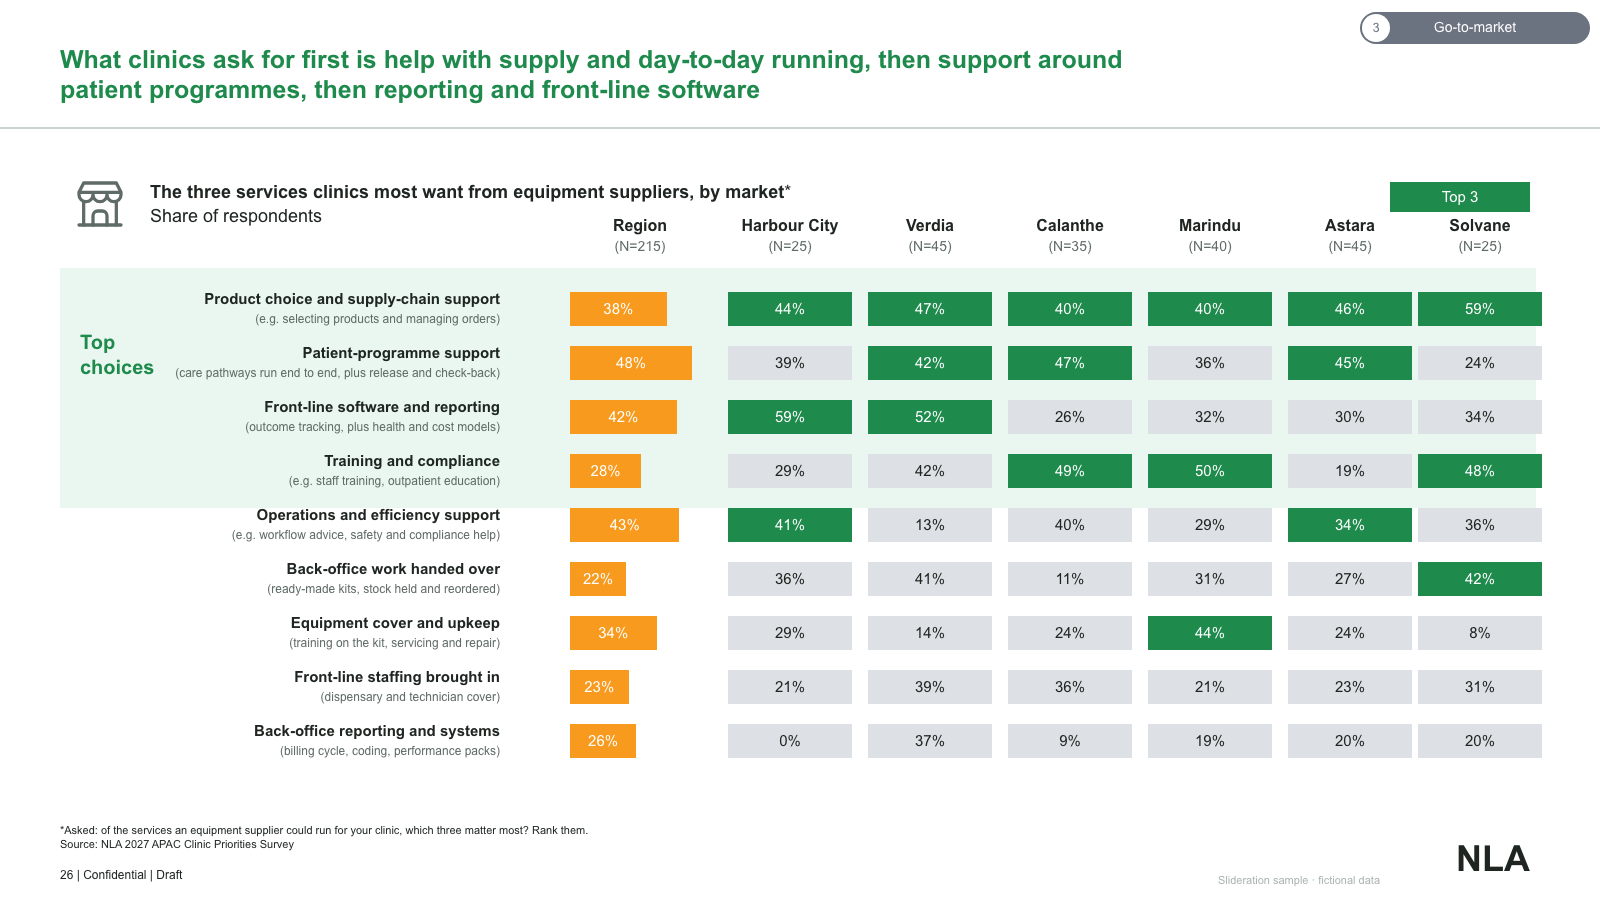
Matrix of survey values — highlighted top block with orange regional bars and per-country cells
1 slides · 1 credit
Check inputs & editing effort →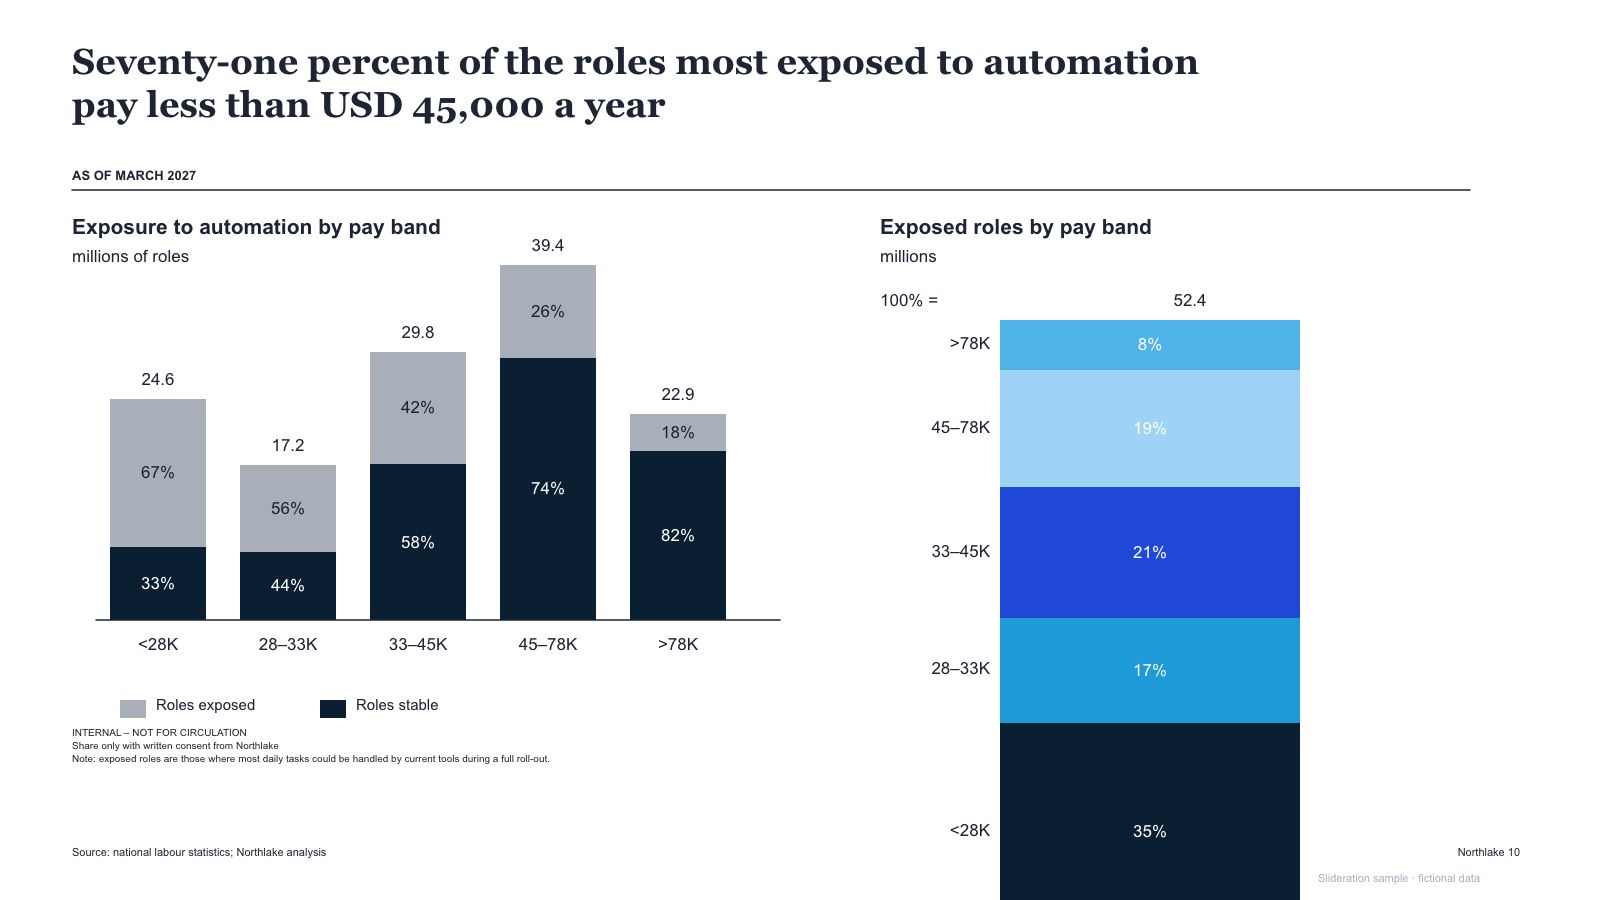
Two charts side by side — stacked share columns by band and a single 100% column with legend
1 slides · 1 credit
Check inputs & editing effort →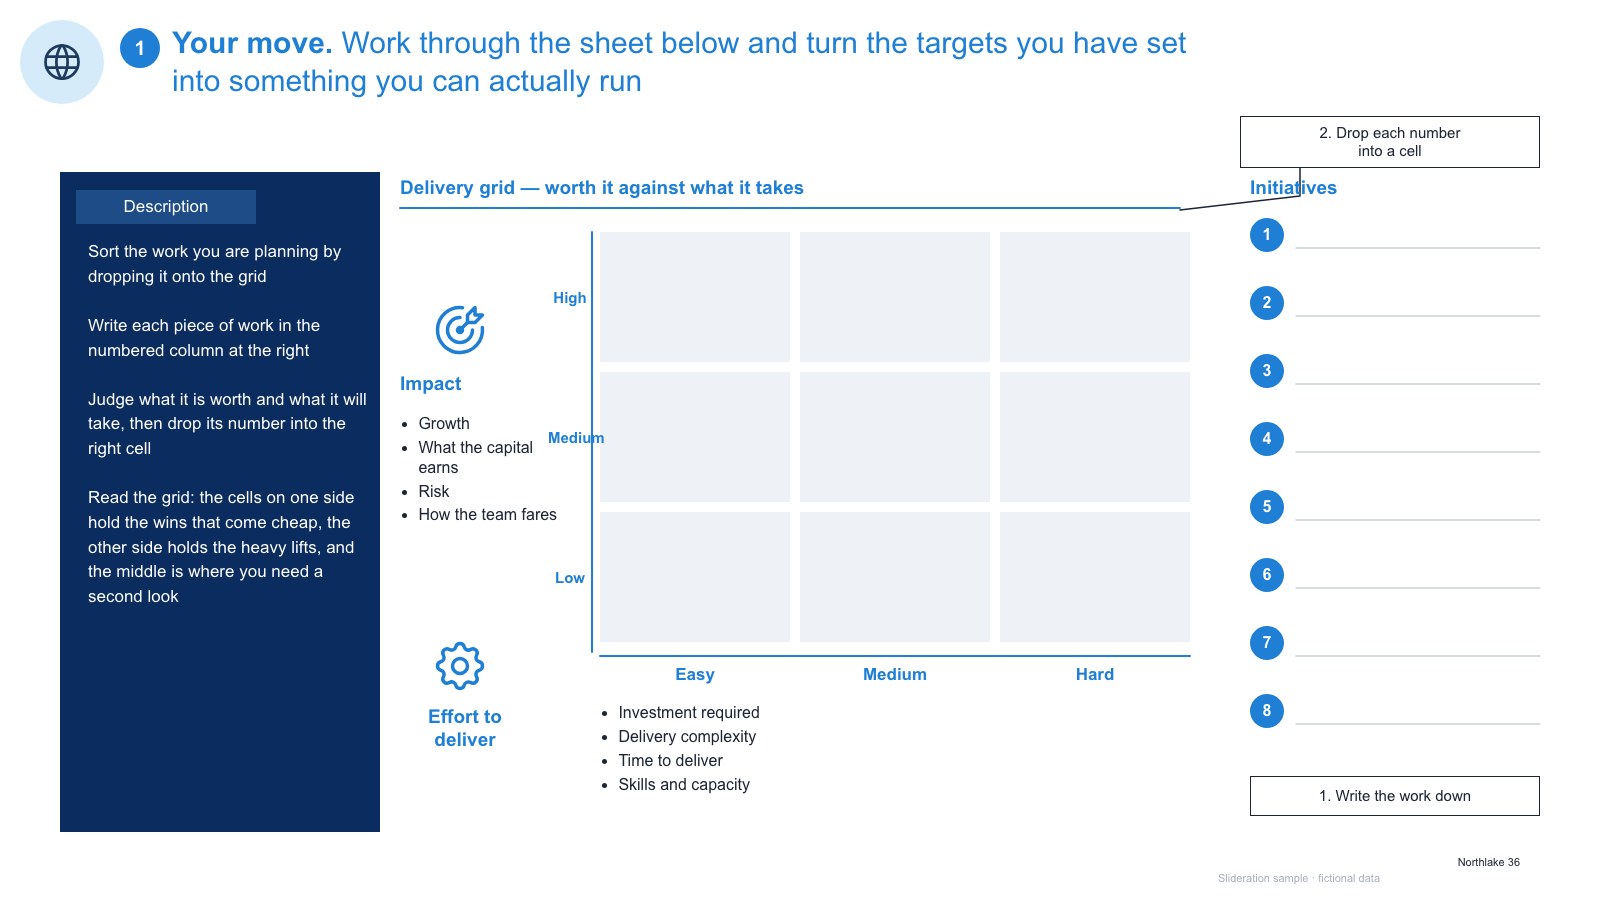
Worksheet template — instruction panel, empty 3x3 impact/effort matrix and a numbered initiative list
1 slides · 1 credit
Check inputs & editing effort →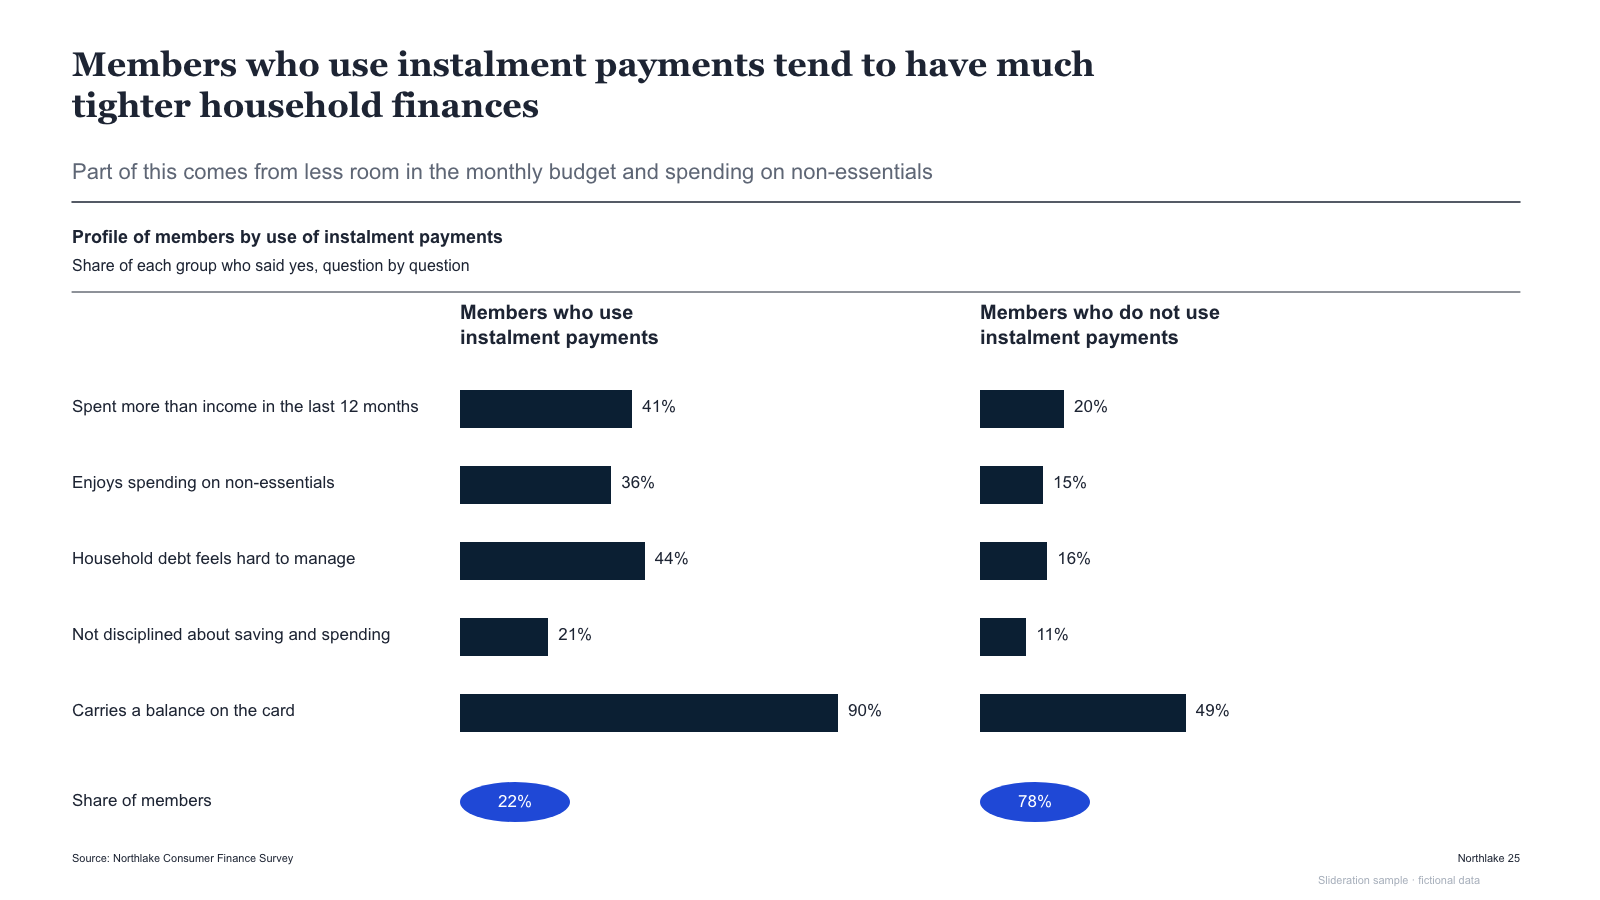
Paired horizontal bar panels comparing two customer groups, with share pills below
1 slides · 1 credit
Check inputs & editing effort →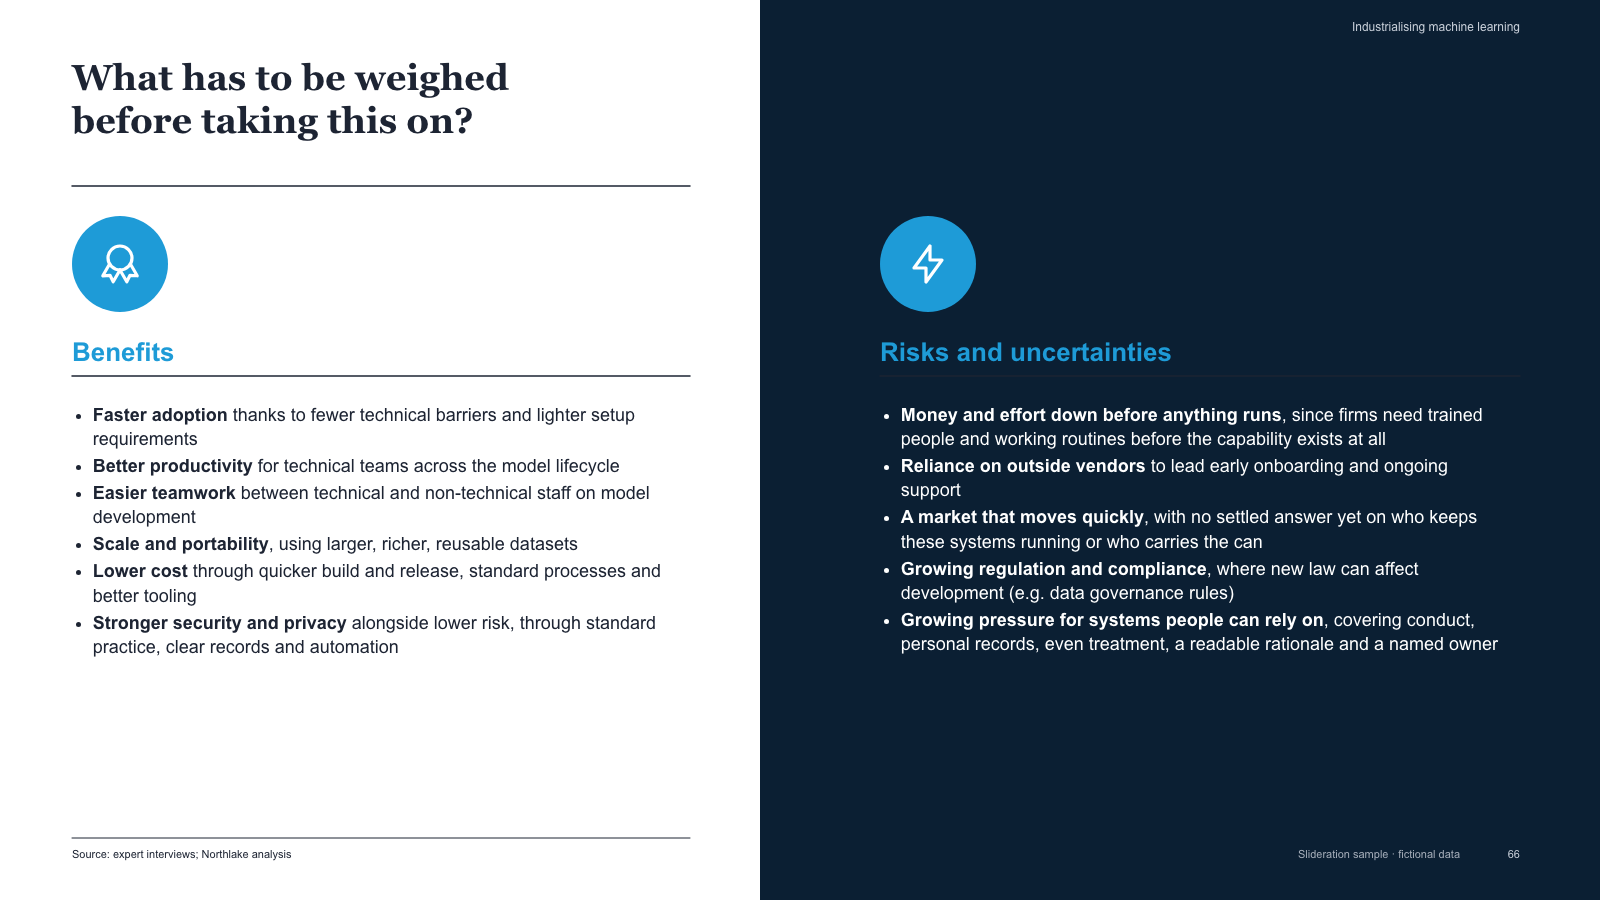
Split benefits / risks slide with icon badges and two long bullet columns
1 slides · 1 credit
Check inputs & editing effort →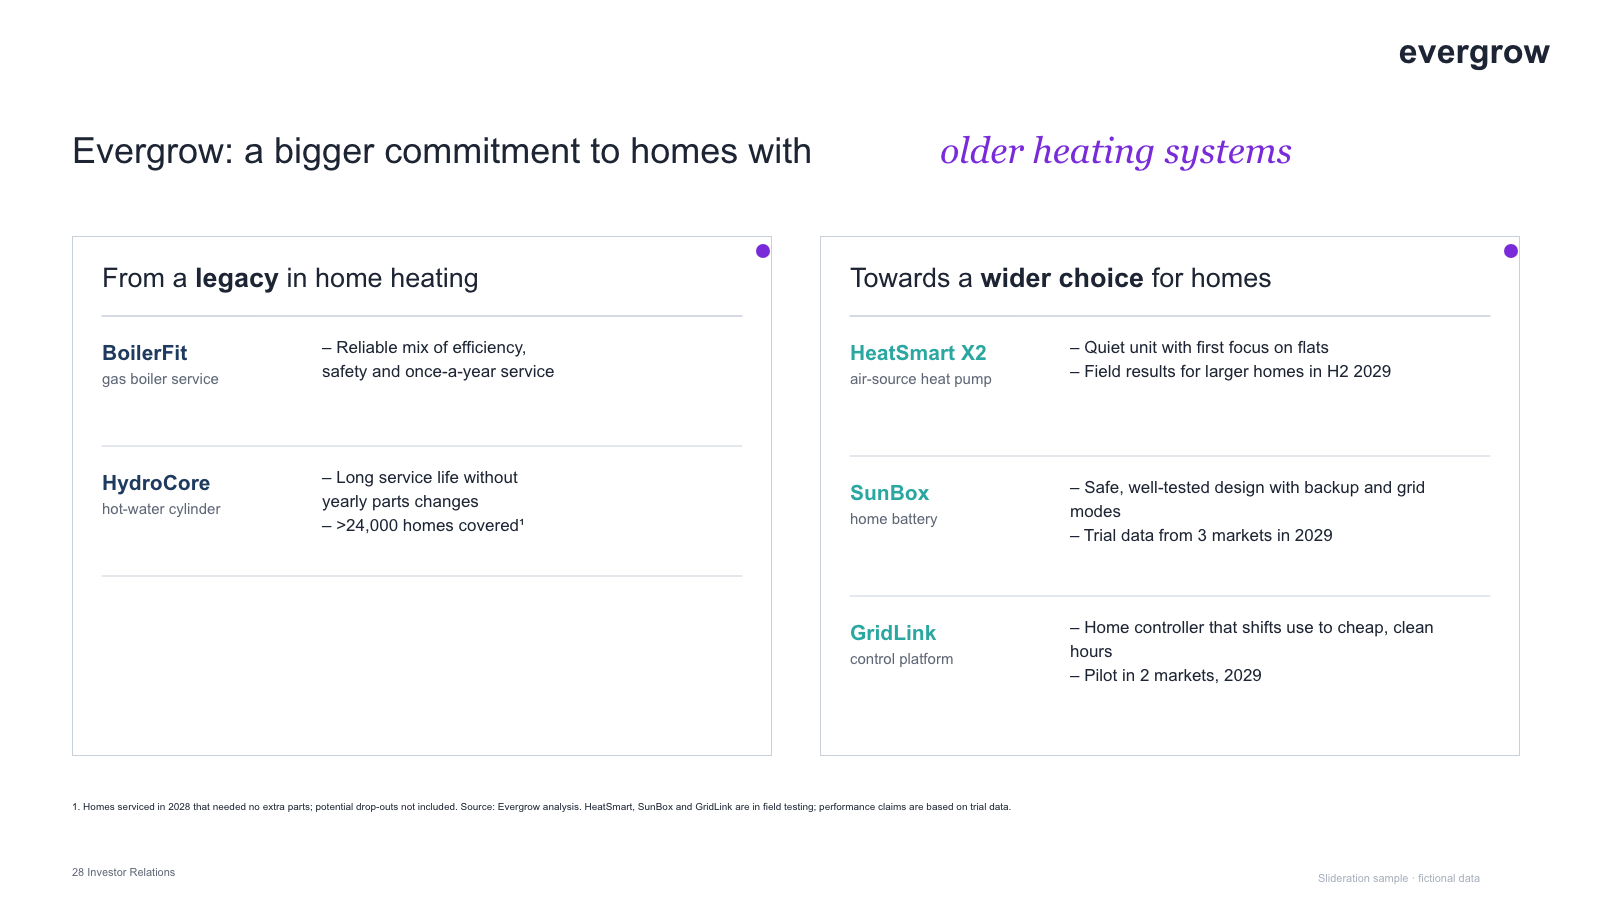
Two bordered panels contrasting legacy and future line-ups, each with product rows and bullets
1 slides · 1 credit
Check inputs & editing effort →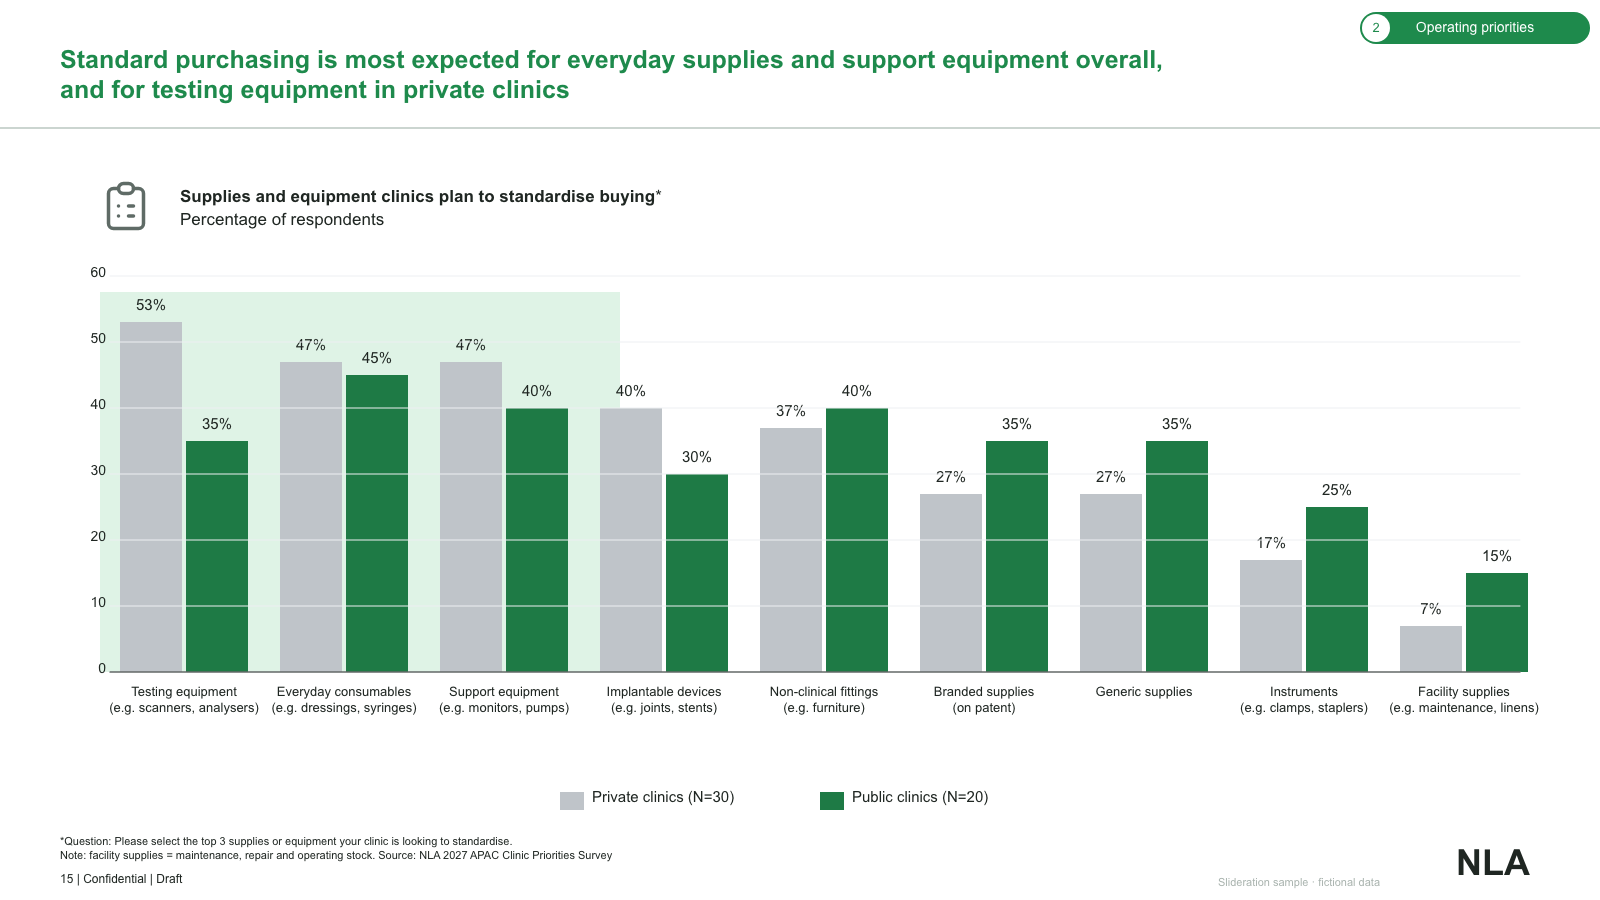
Paired category bars with a highlighted first block, two-colour legend and survey footnotes
1 slides · 1 credit
Check inputs & editing effort →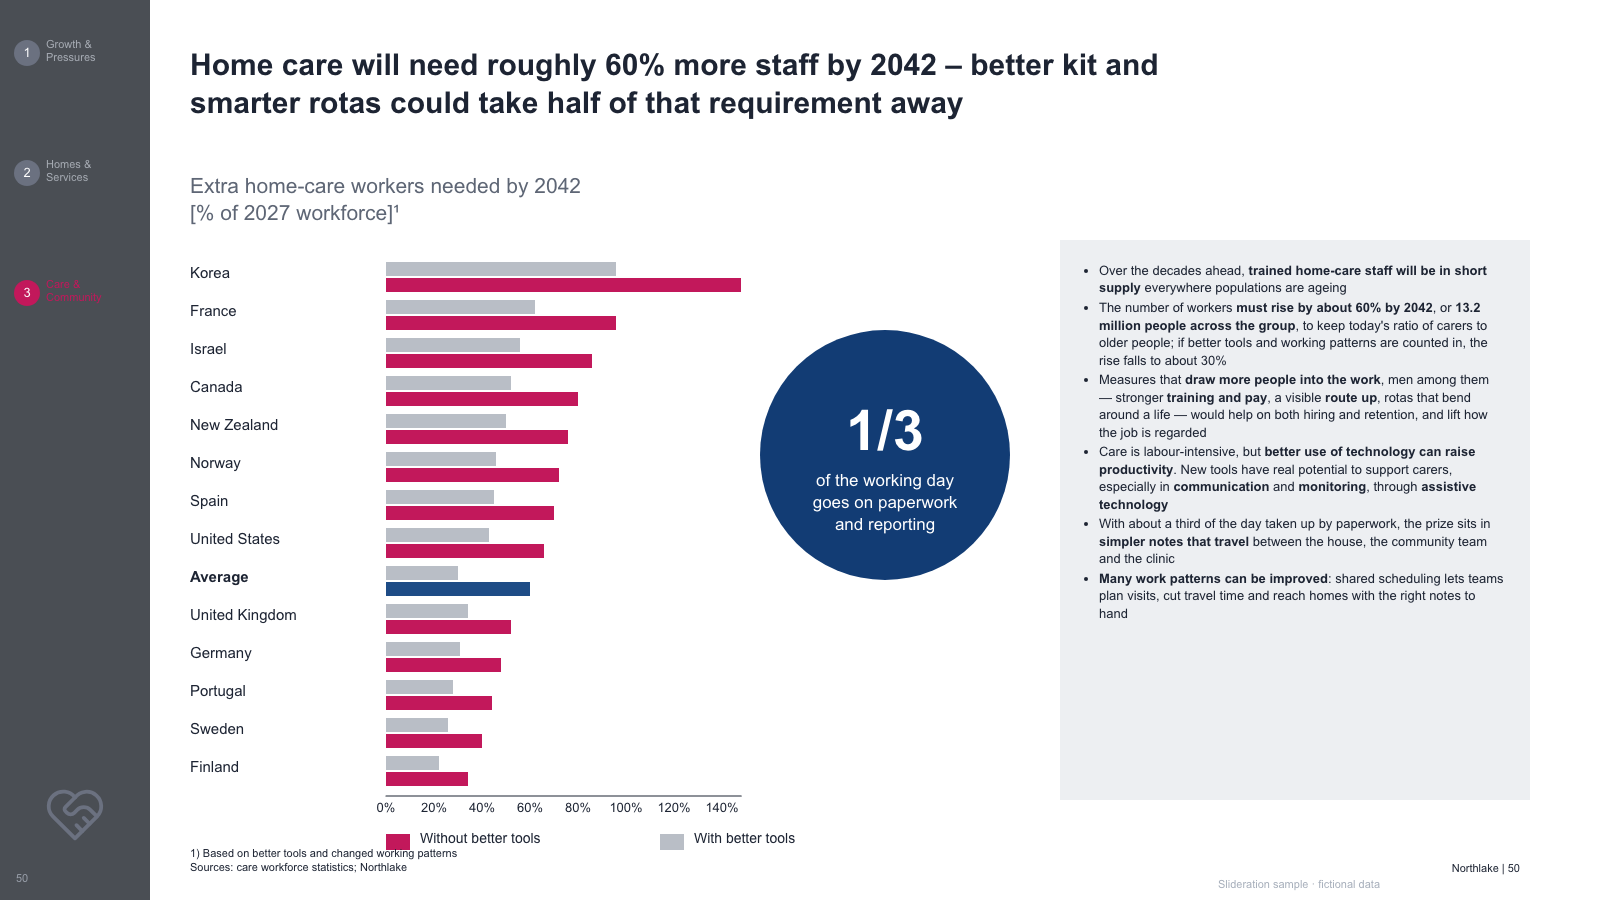
Rail, paired horizontal bars by country with a circular stat badge and a bullet column
1 slides · 1 credit
Check inputs & editing effort →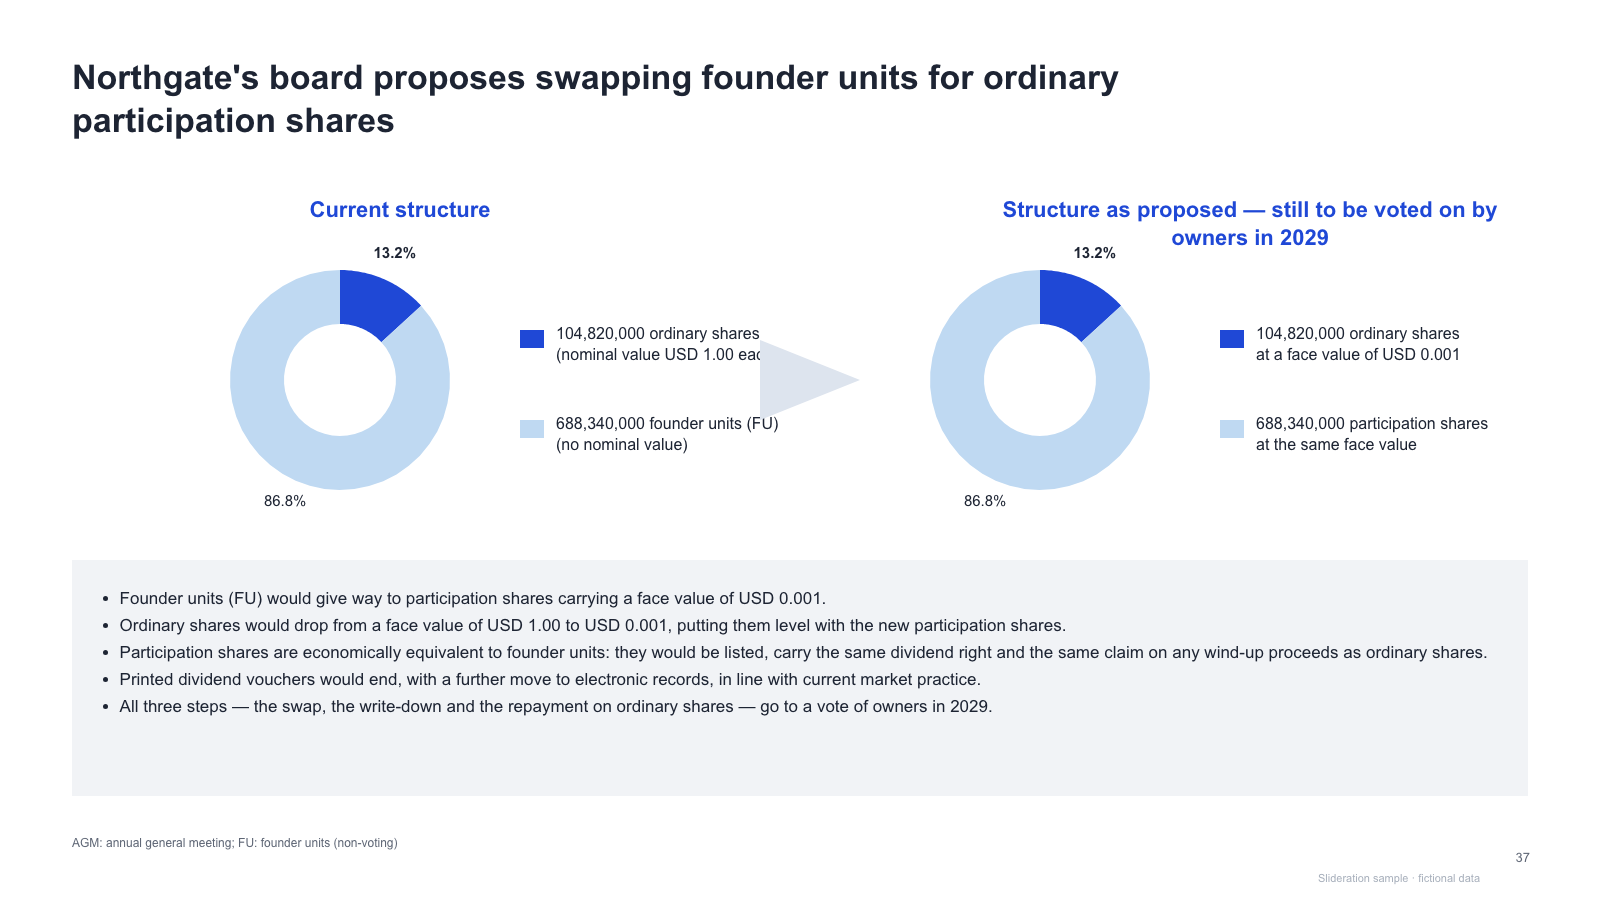
Two donut charts (current vs proposed) with legends, a wedge arrow between and bullet notes
1 slides · 1 credit
Check inputs & editing effort →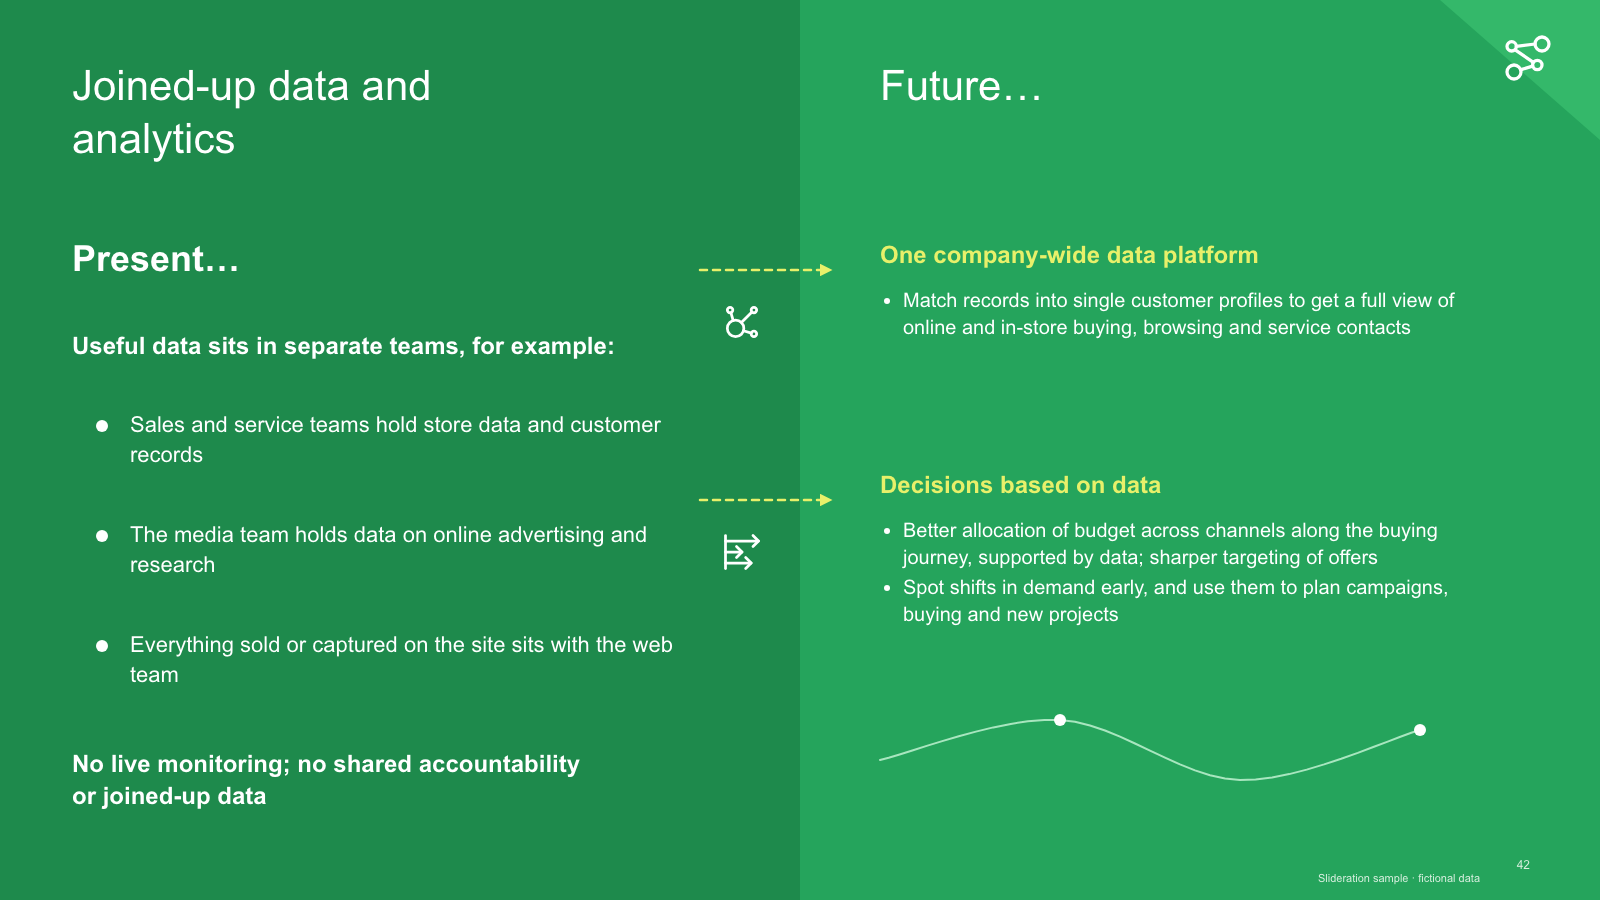
Full-colour split — present-state bullets and future-state blocks joined by dashed arrows
1 slides · 1 credit
Check inputs & editing effort →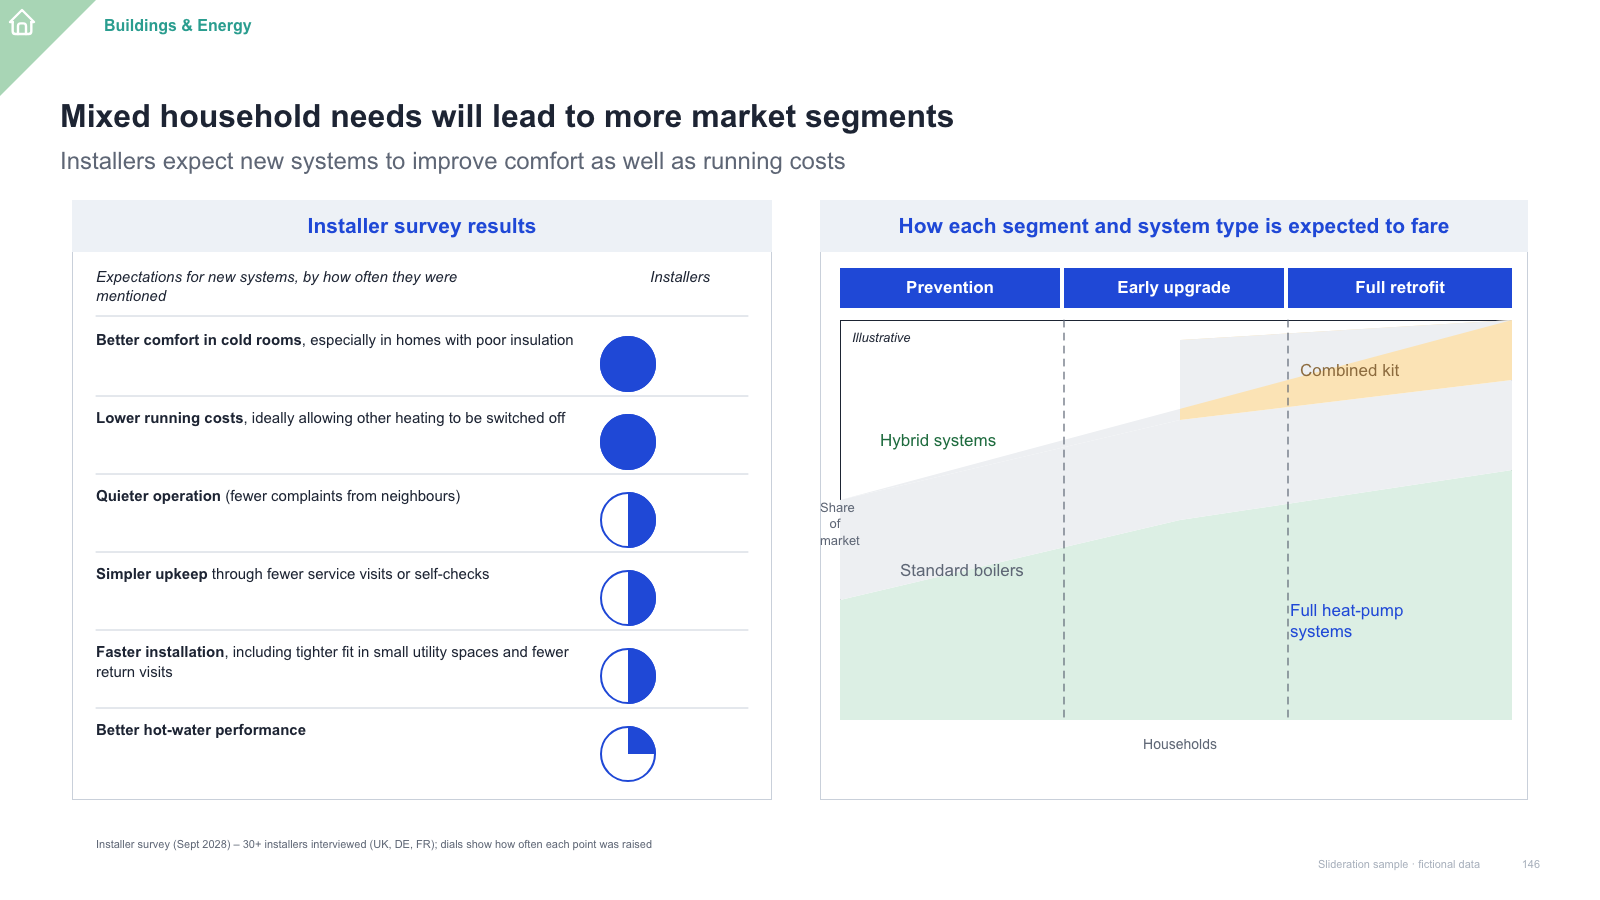
Two bordered panels — survey rows with quarter-filled dials, and a stacked area outlook chart
1 slides · 1 credit
Check inputs & editing effort →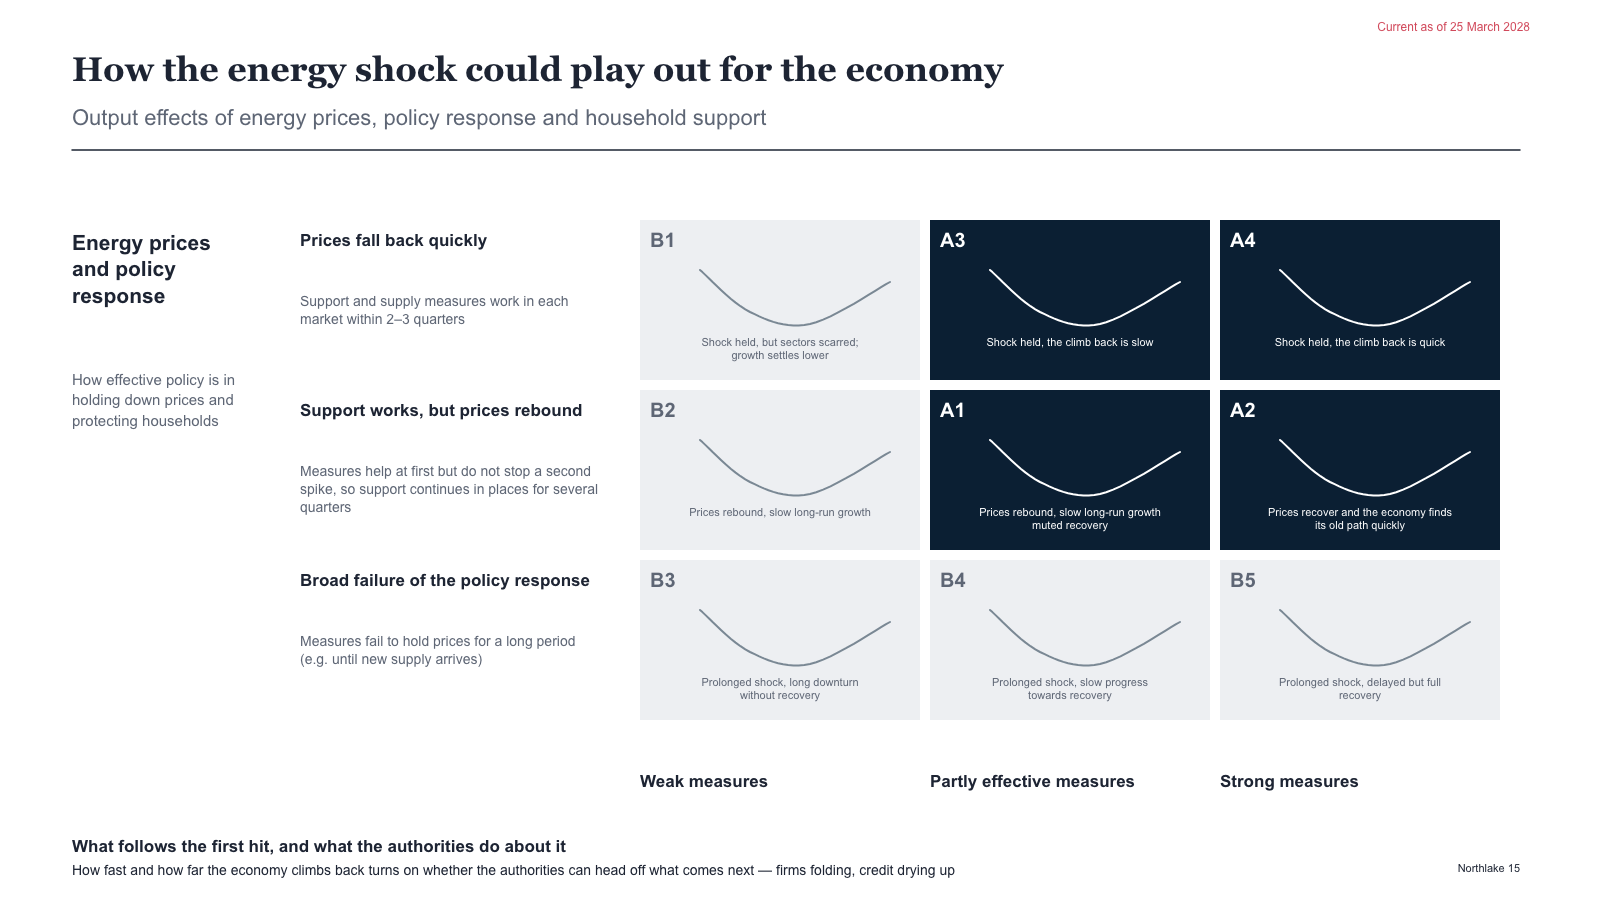
Scenario matrix — row descriptions beside a 3x3 grid of mini curve cards with column headings
1 slides · 1 credit
Check inputs & editing effort →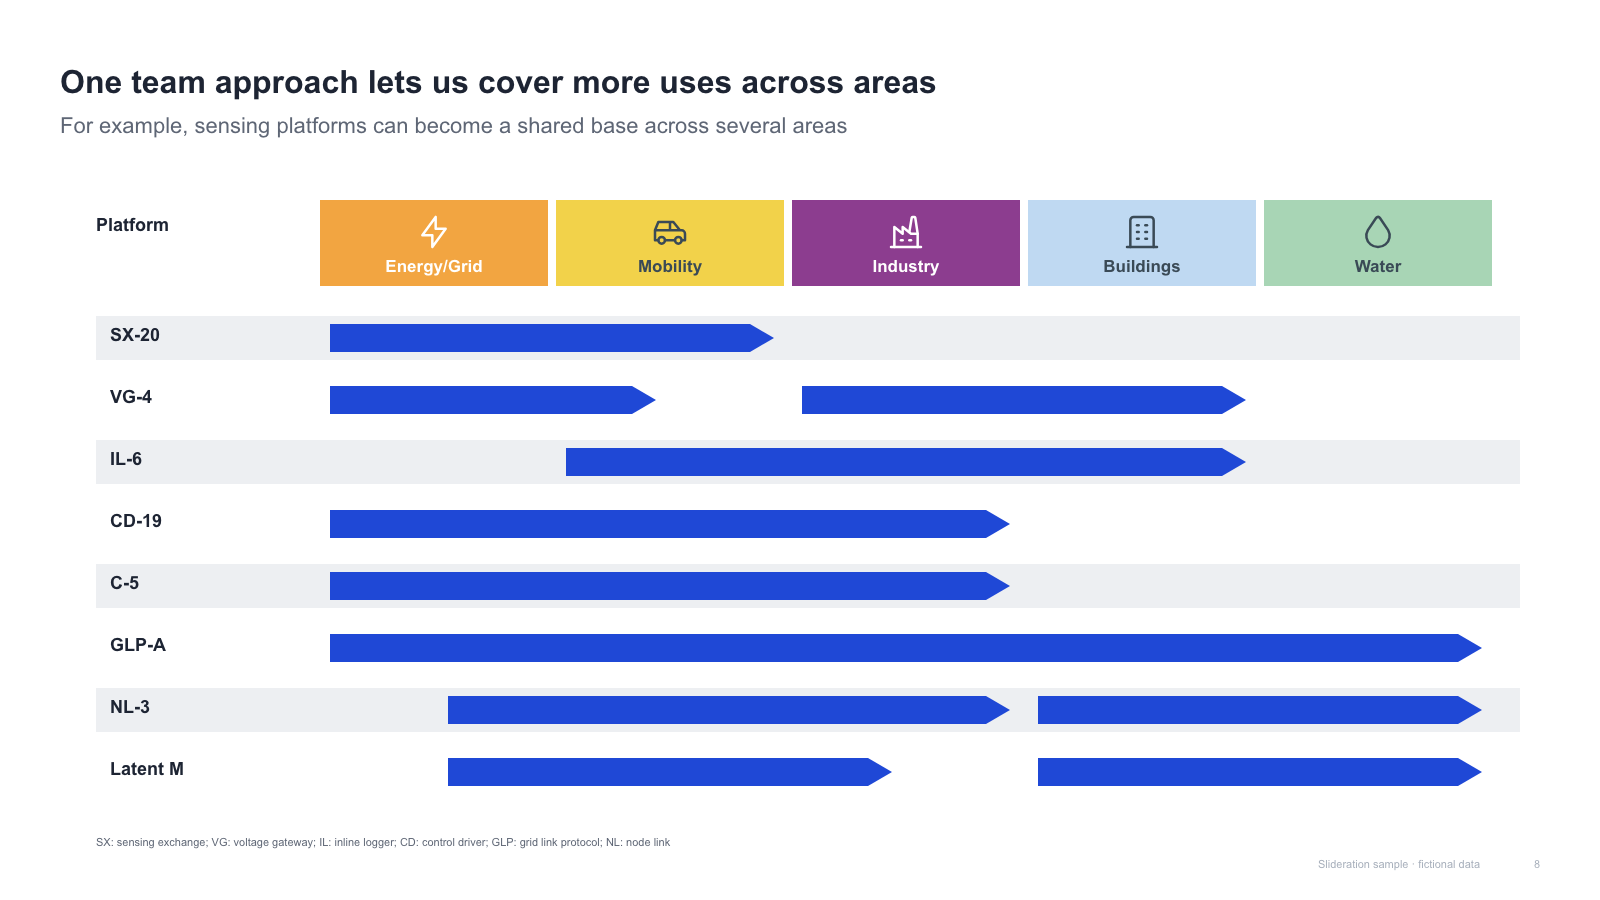
Target-by-area matrix — coloured area headers with icons and bar ranges per target row
1 slides · 1 credit
Check inputs & editing effort →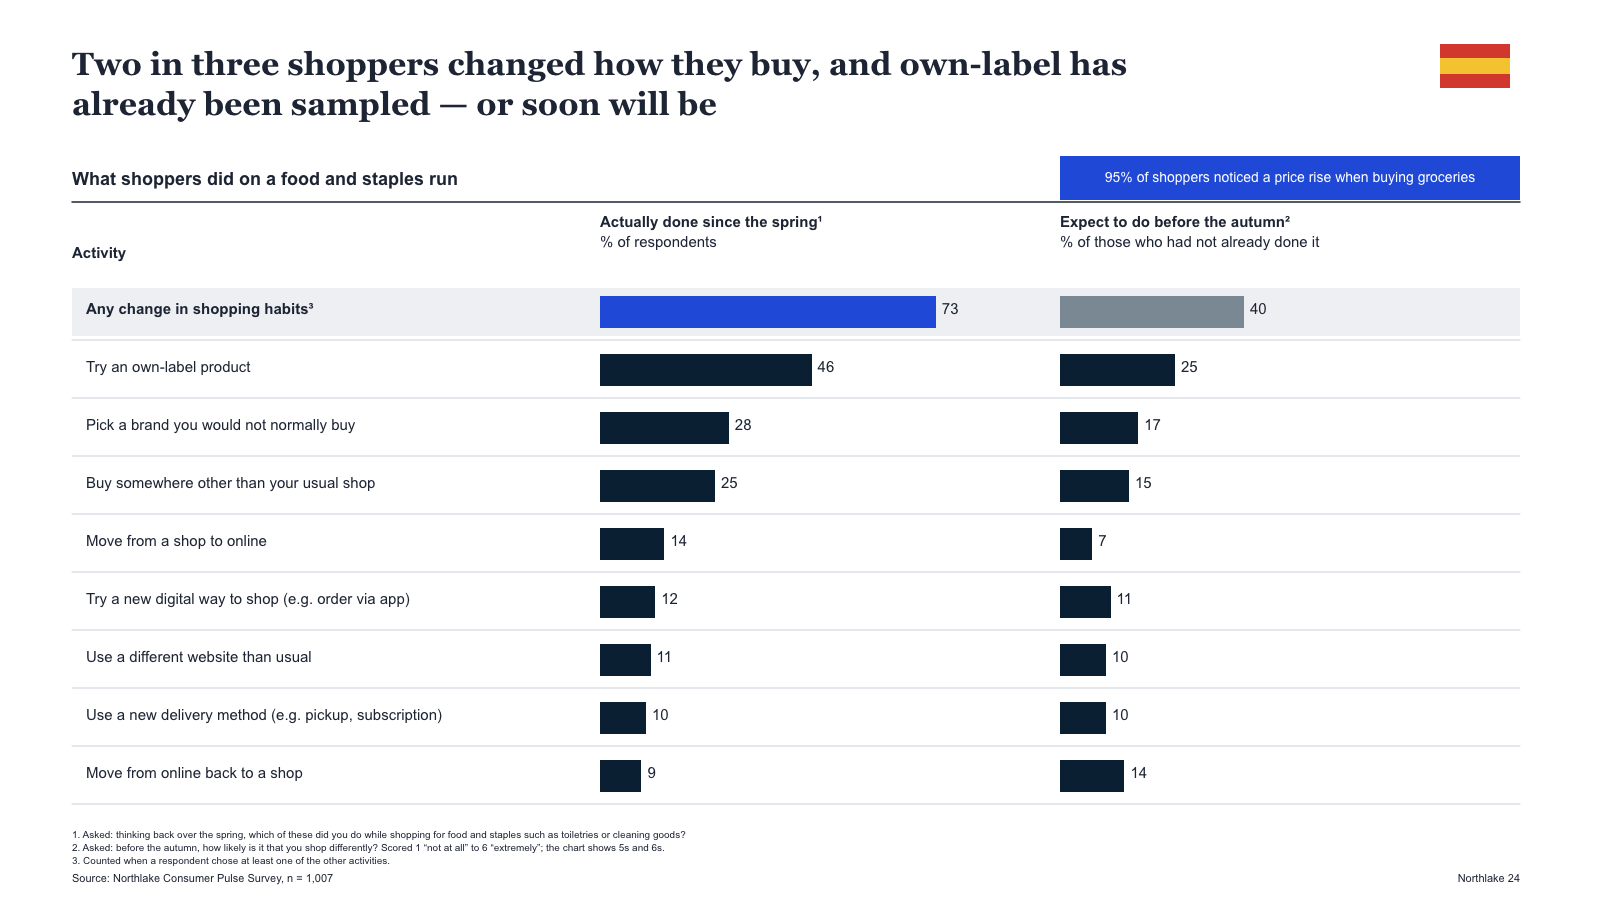
Activity table with two bar columns (done vs planned), a highlight row and a callout box
1 slides · 1 credit
Check inputs & editing effort →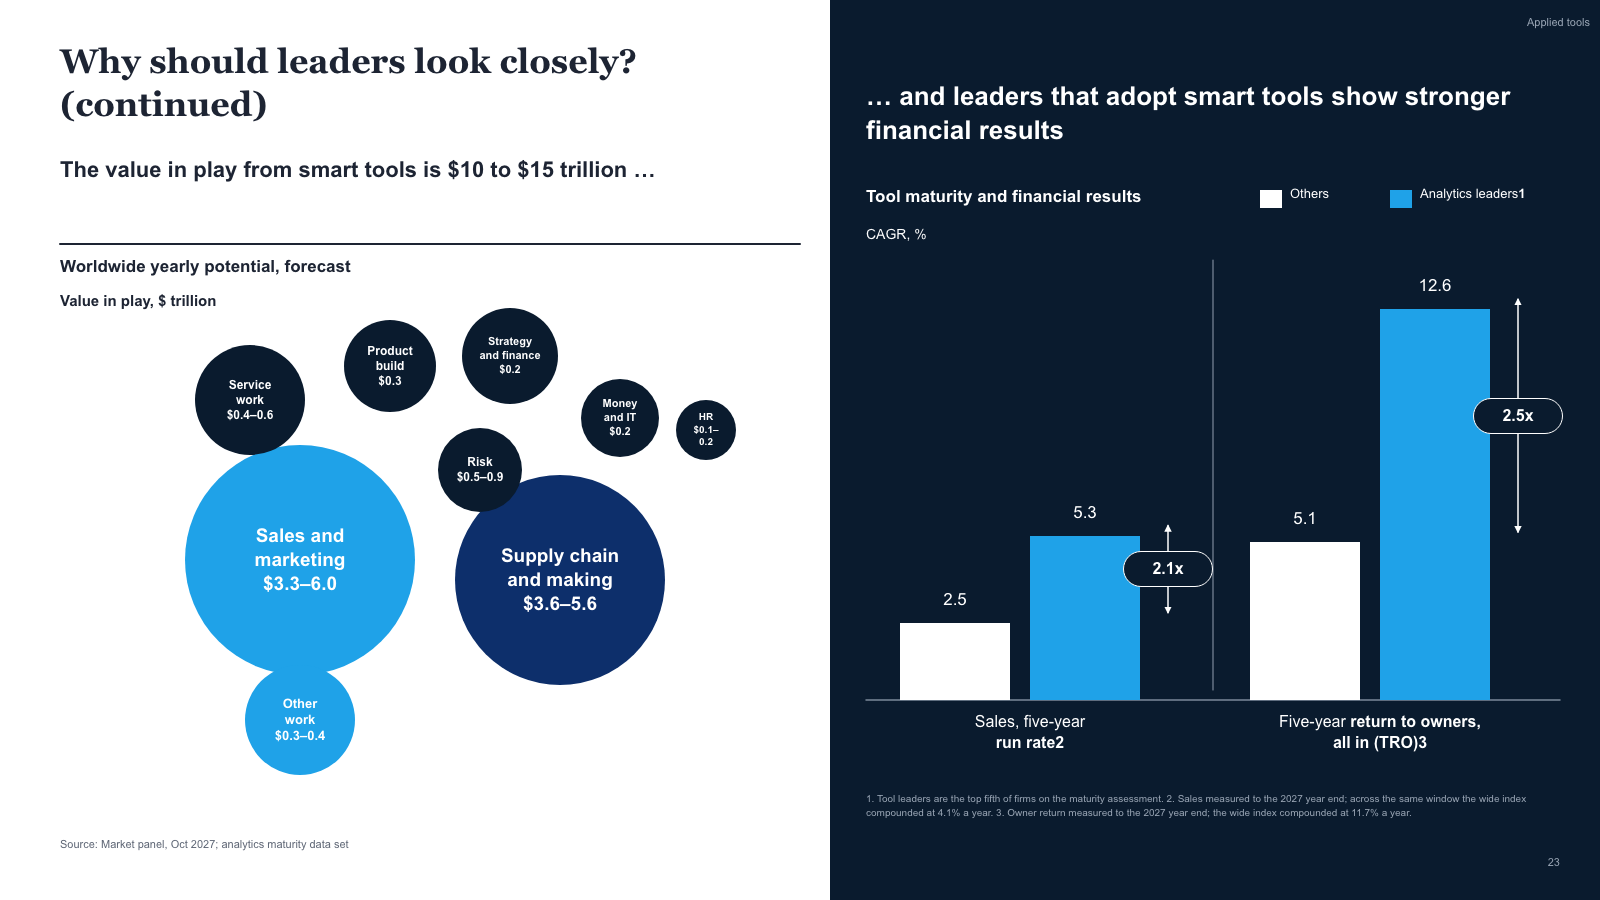
White bubble-chart panel on the left, dark panel on the right with paired bars and multiple brackets
1 slides · 1 credit
Check inputs & editing effort →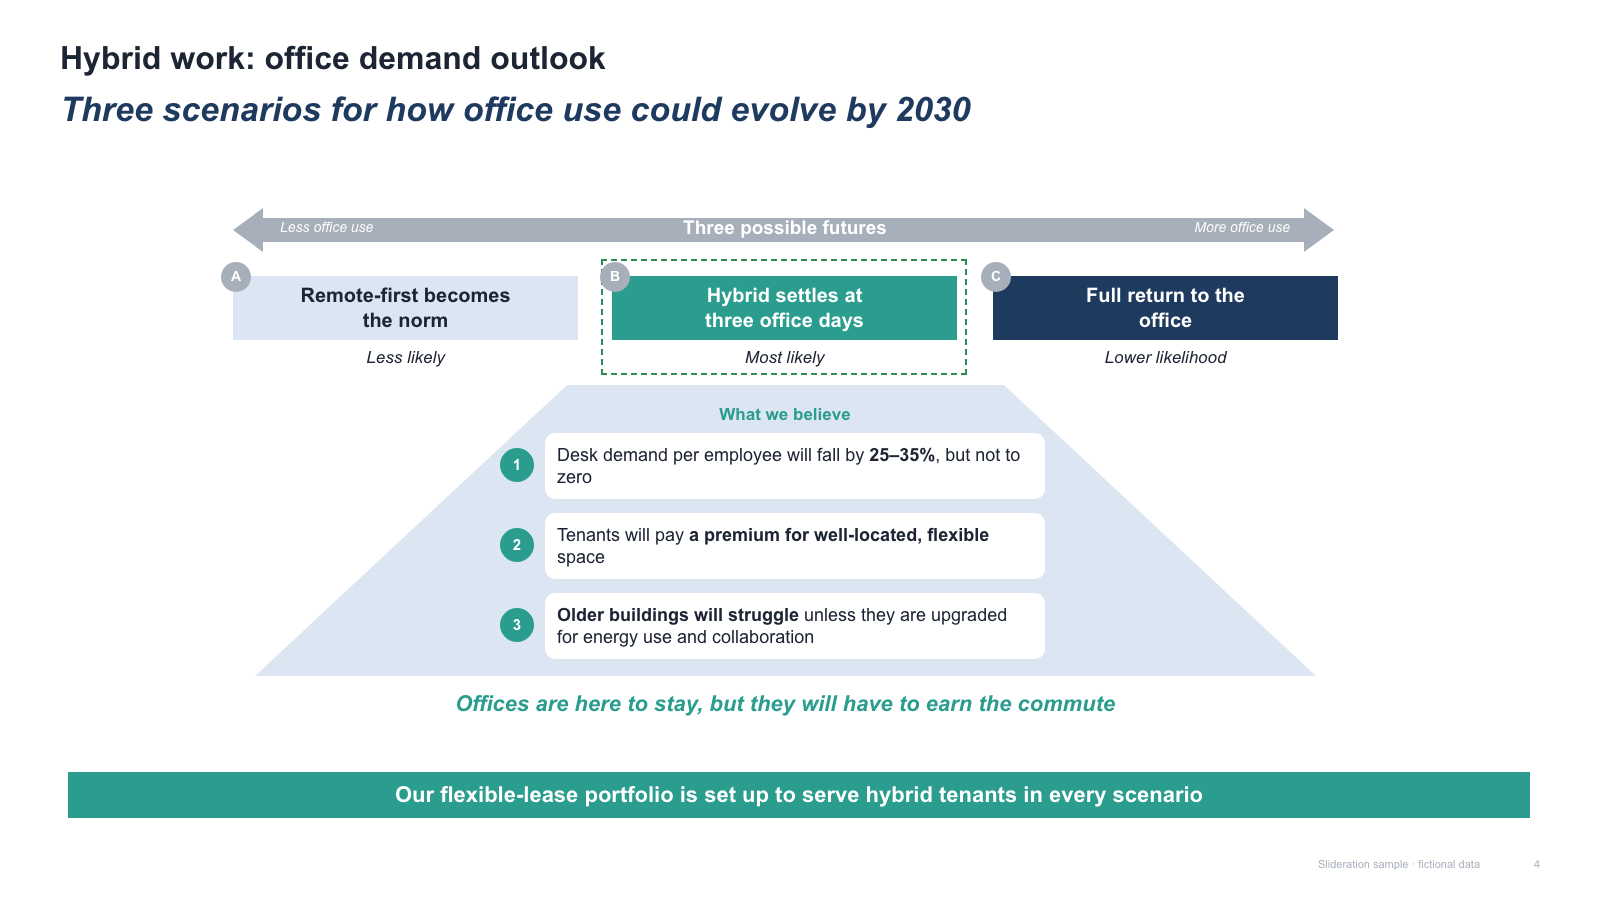
Scenario spectrum (A/B/C) + trapezoid of core beliefs + banner
1 slides · 1 credit
Check inputs & editing effort →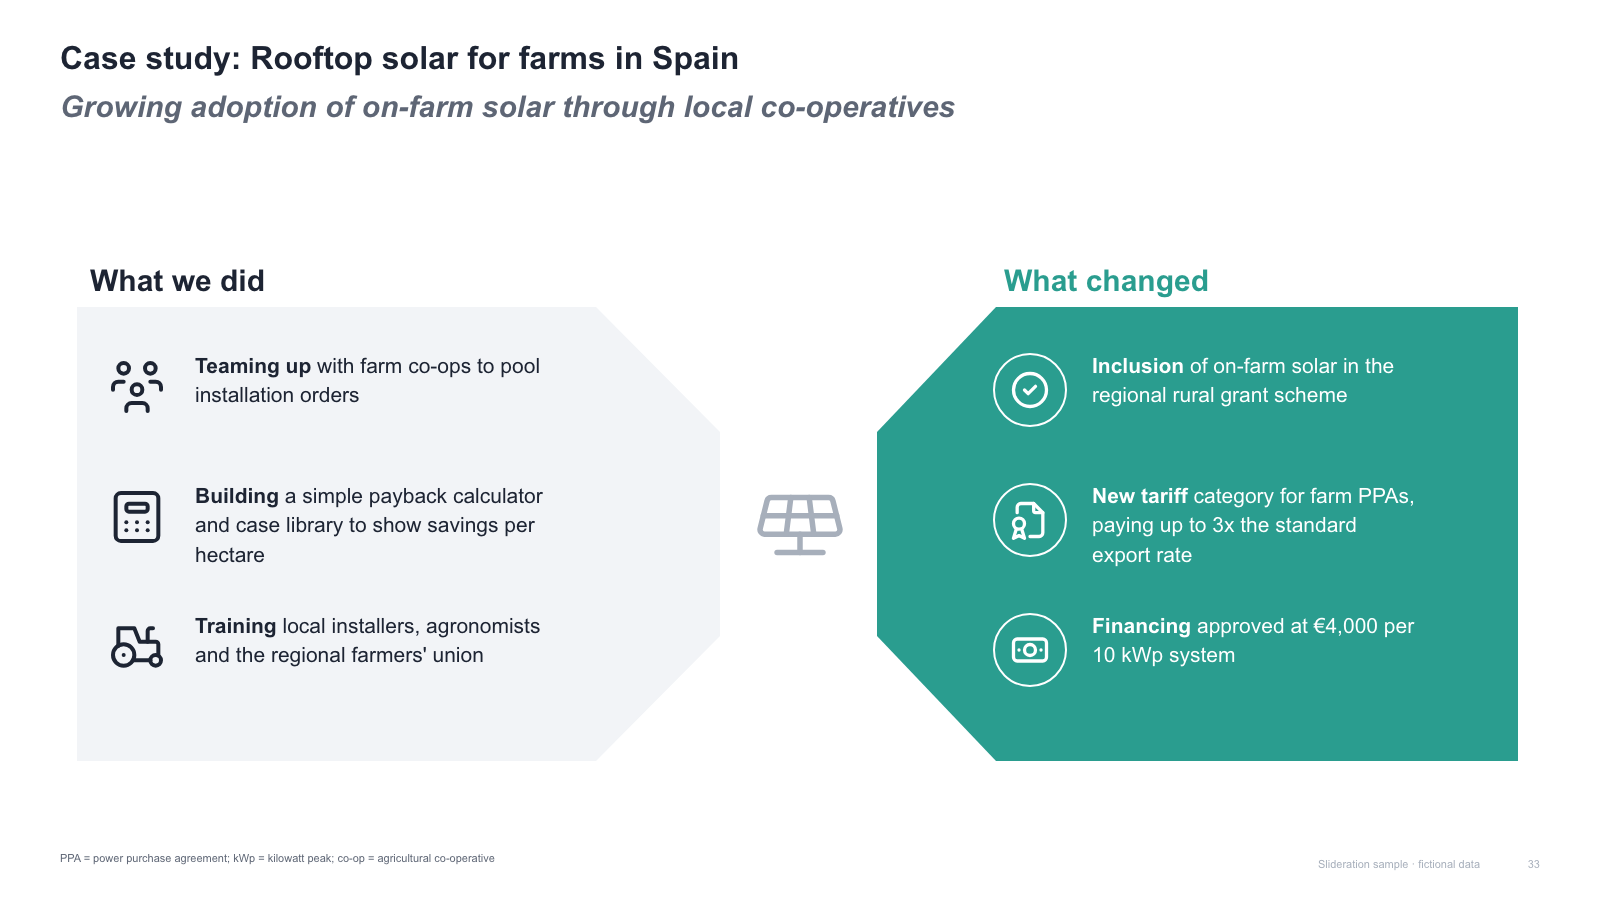
Actions vs results — two opposing arrow panels with icon rows
1 slides · 1 credit
Check inputs & editing effort →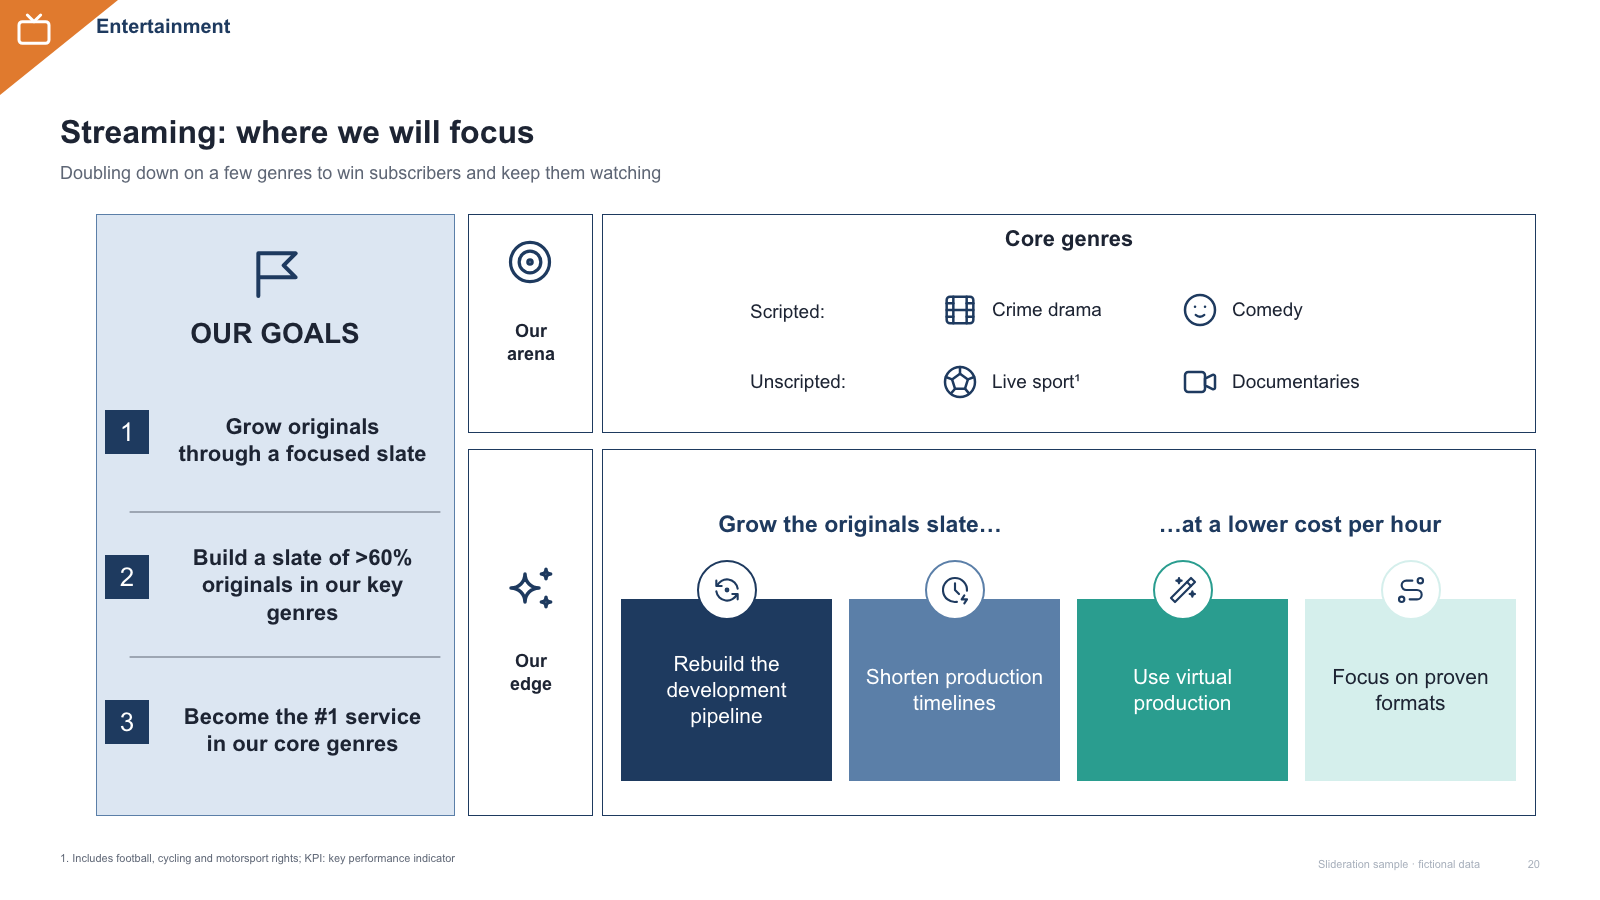
Ambition column + where-we-play / how-we-win matrix with 4 tiles
1 slides · 1 credit
Check inputs & editing effort →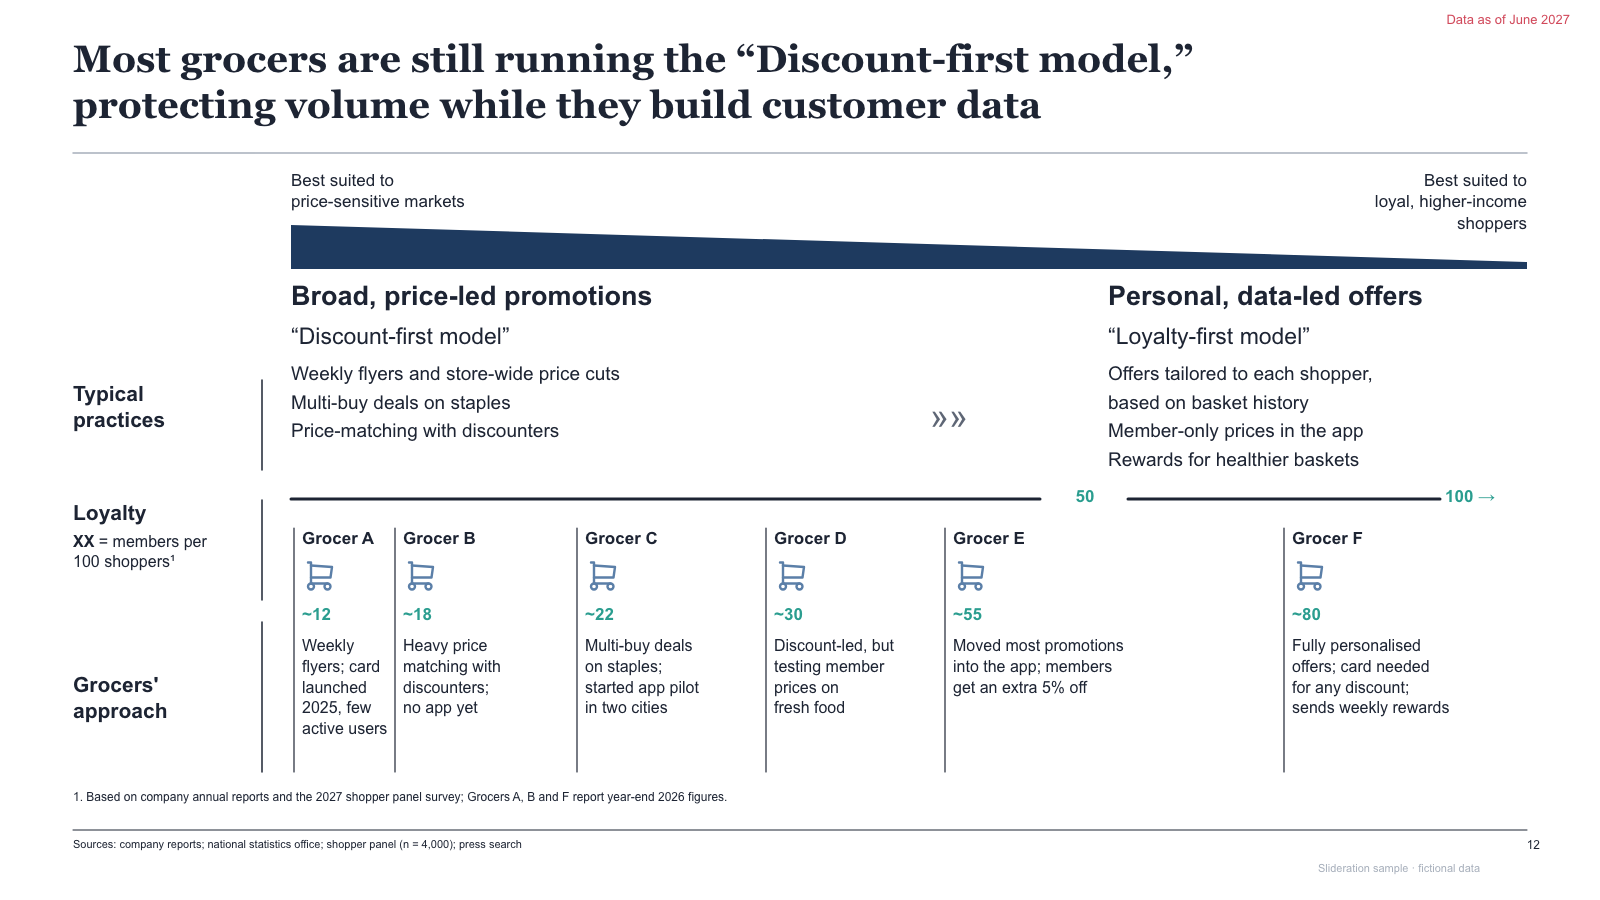
Two-model spectrum wedge + comparison columns with scale axis
1 slides · 1 credit
Check inputs & editing effort →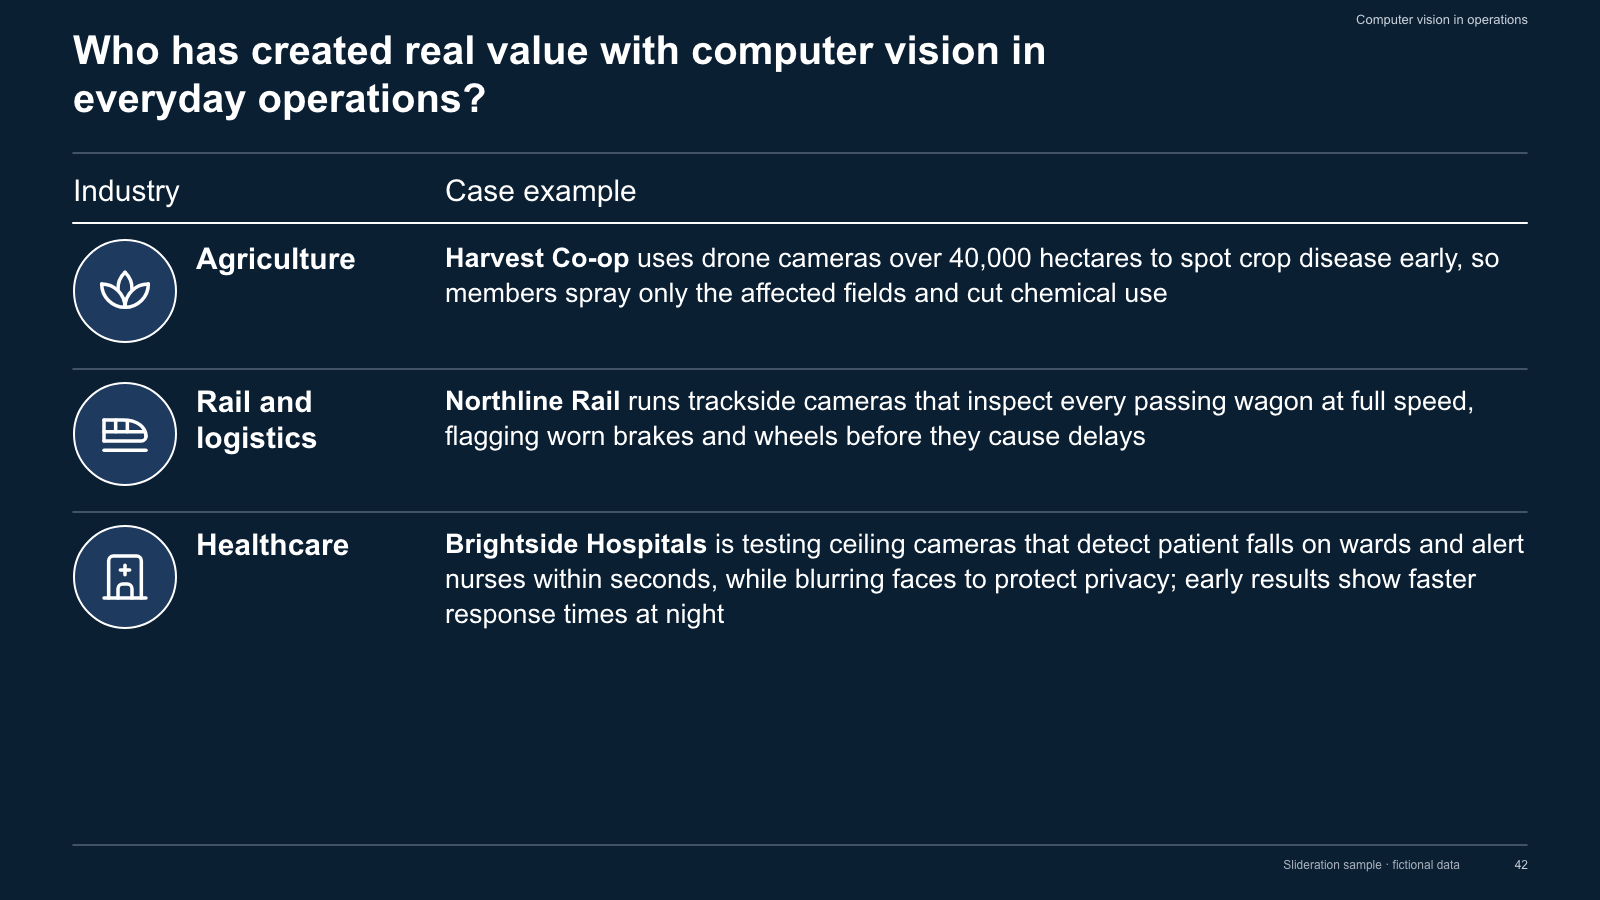
Dark two-column case table with round icons per row
1 slides · 1 credit
Check inputs & editing effort →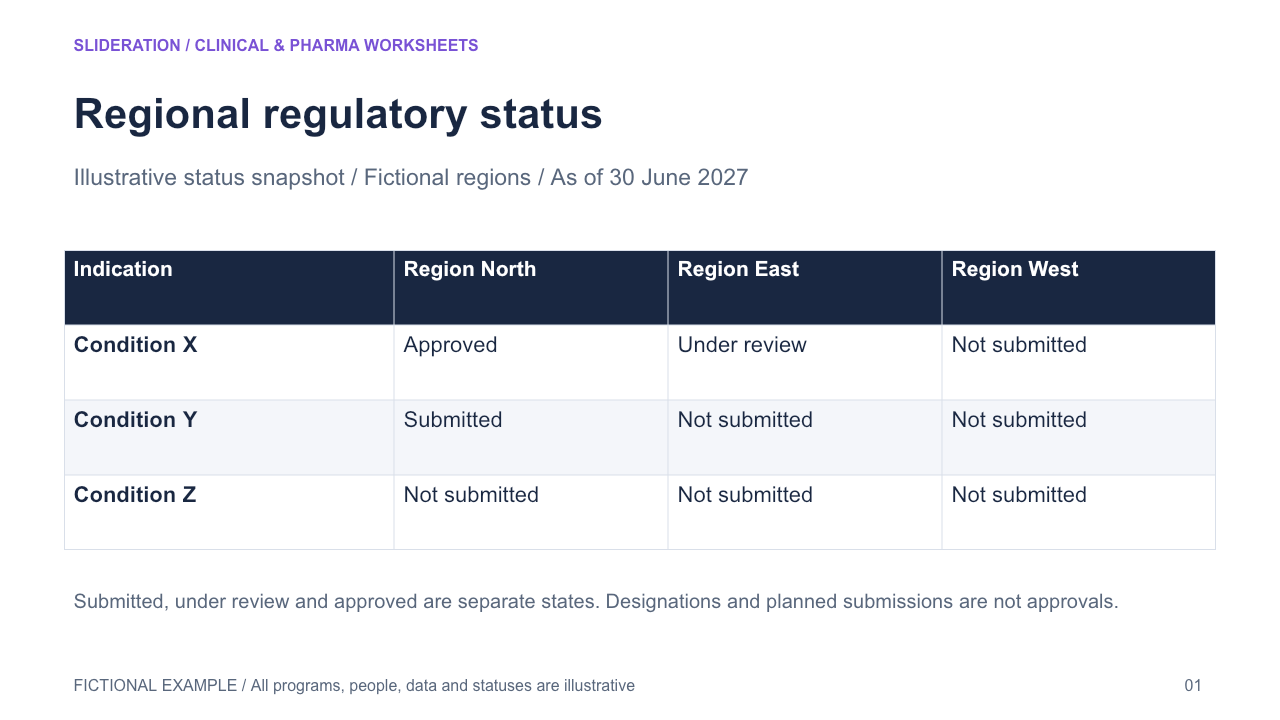
Regional regulatory status — Indication by region matrix separates submission, review and approval states
2 slides · 1 credit
Check inputs & editing effort →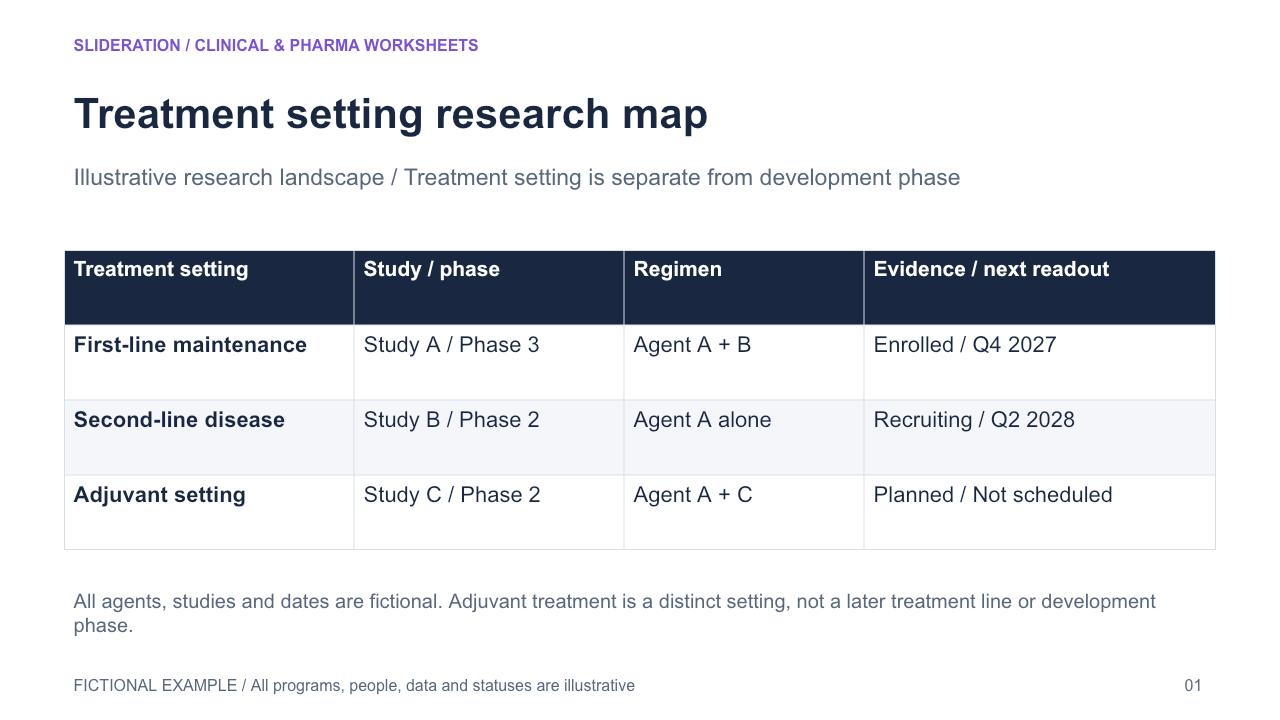
Treatment setting research map — Treatment setting axis linked to study, regimen, evidence status and next readout
2 slides · 1 credit
Check inputs & editing effort →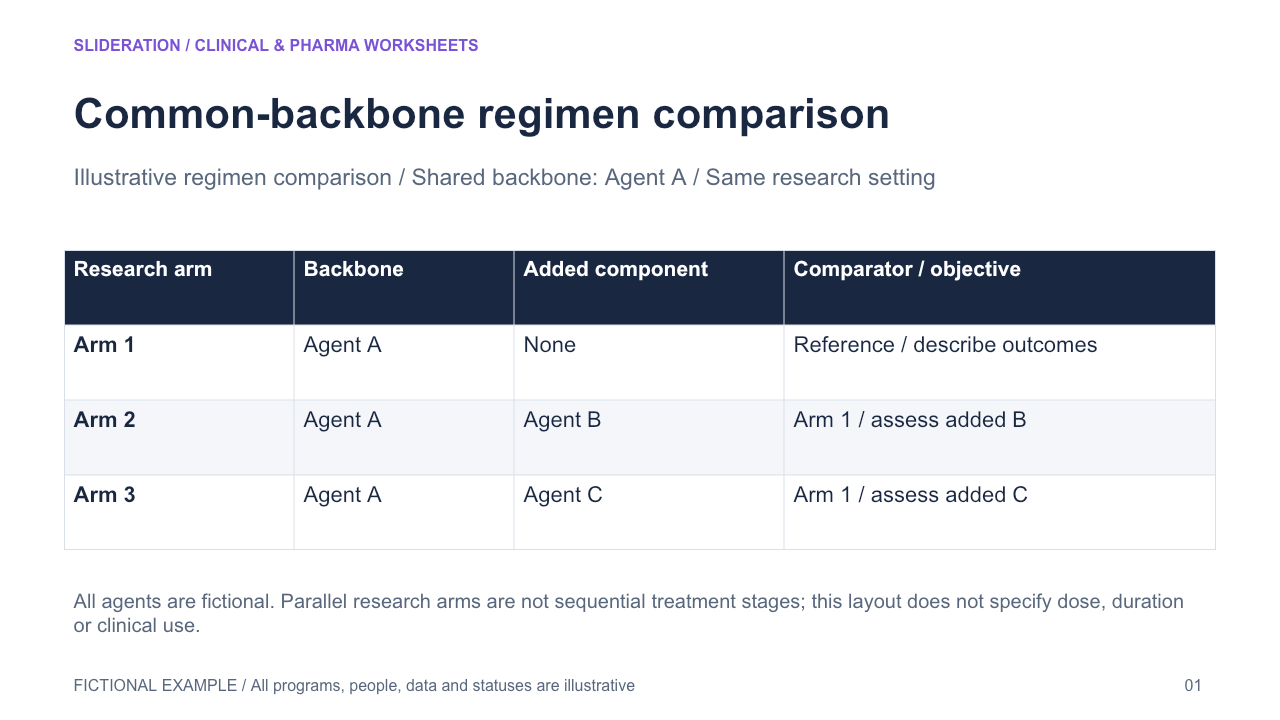
Common-backbone regimen comparison — Shared backbone and added components mapped to comparator, setting and study objective
2 slides · 1 credit
Check inputs & editing effort →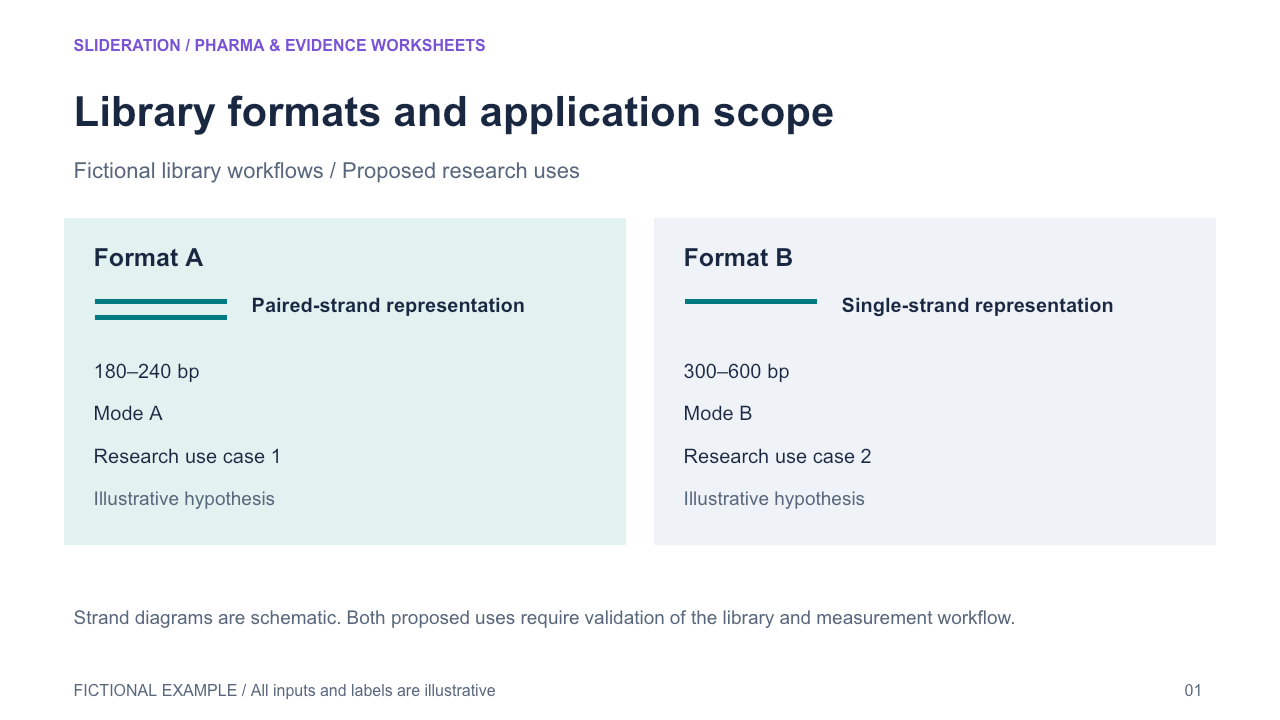
Library formats and application scope — Input-library format, read-length range, measurement mode and proposed application scope remain associated by workflow option, with demonstrated versus future-use evidence status explicit.
2 slides · 1 credit
Check inputs & editing effort →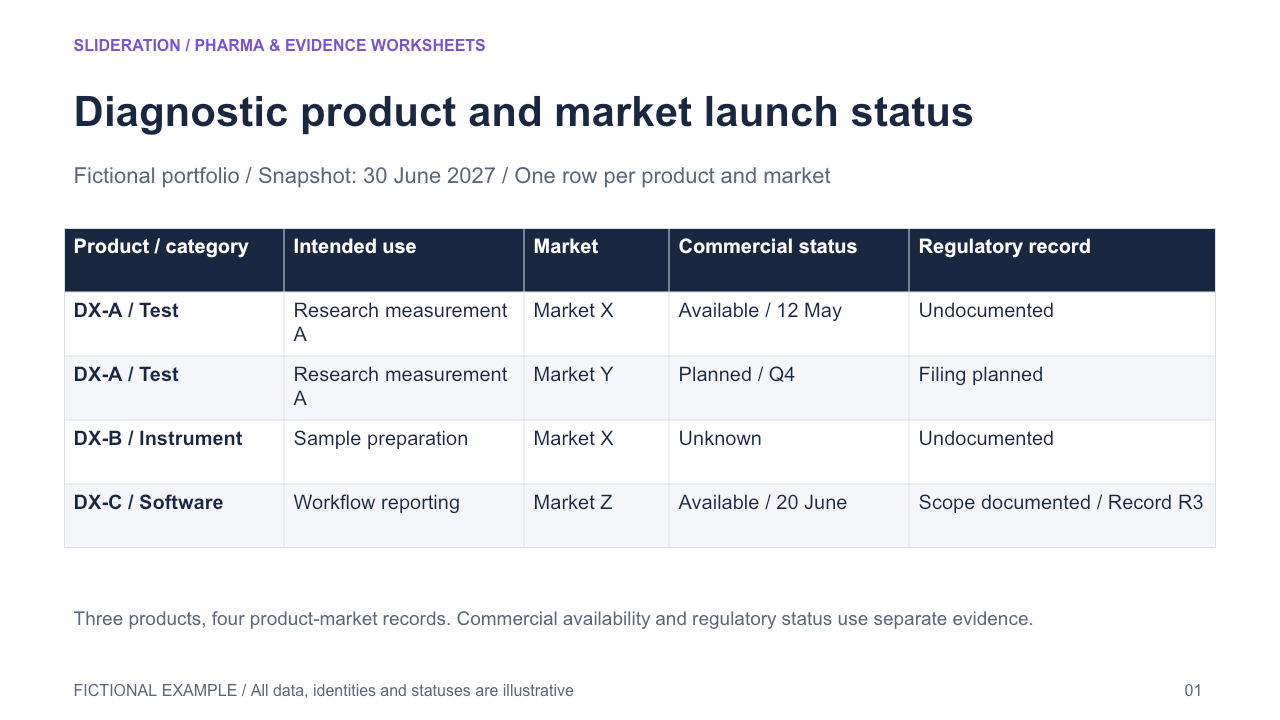
Diagnostic product and market launch status — Product identifier and category link the intended-use summary, market, dated commercial availability and separately evidenced regulatory status. One record per product-market pair makes staggered launches visible.
2 slides · 1 credit
Check inputs & editing effort →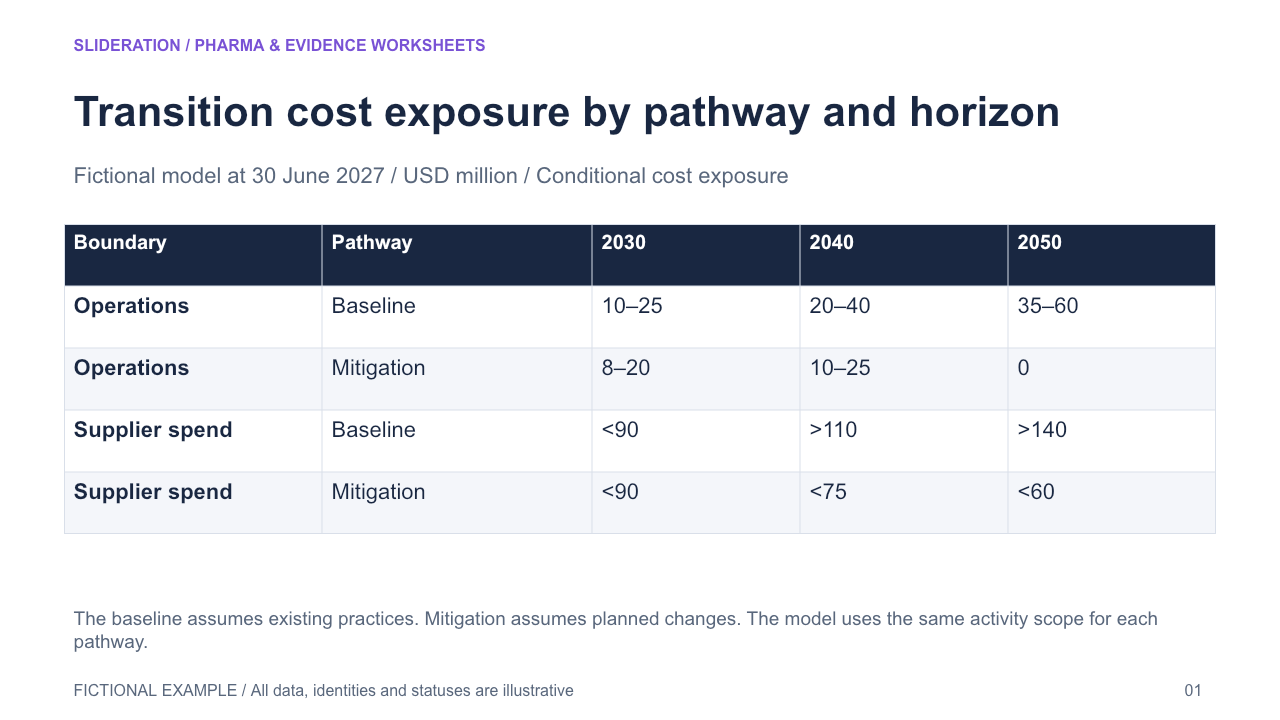
Transition cost exposure by pathway and horizon — Compare modeled cost exposure by operating boundary, baseline or mitigation pathway, and horizon while retaining point, interval and one-sided bounds as different data types.
2 slides · 1 credit
Check inputs & editing effort →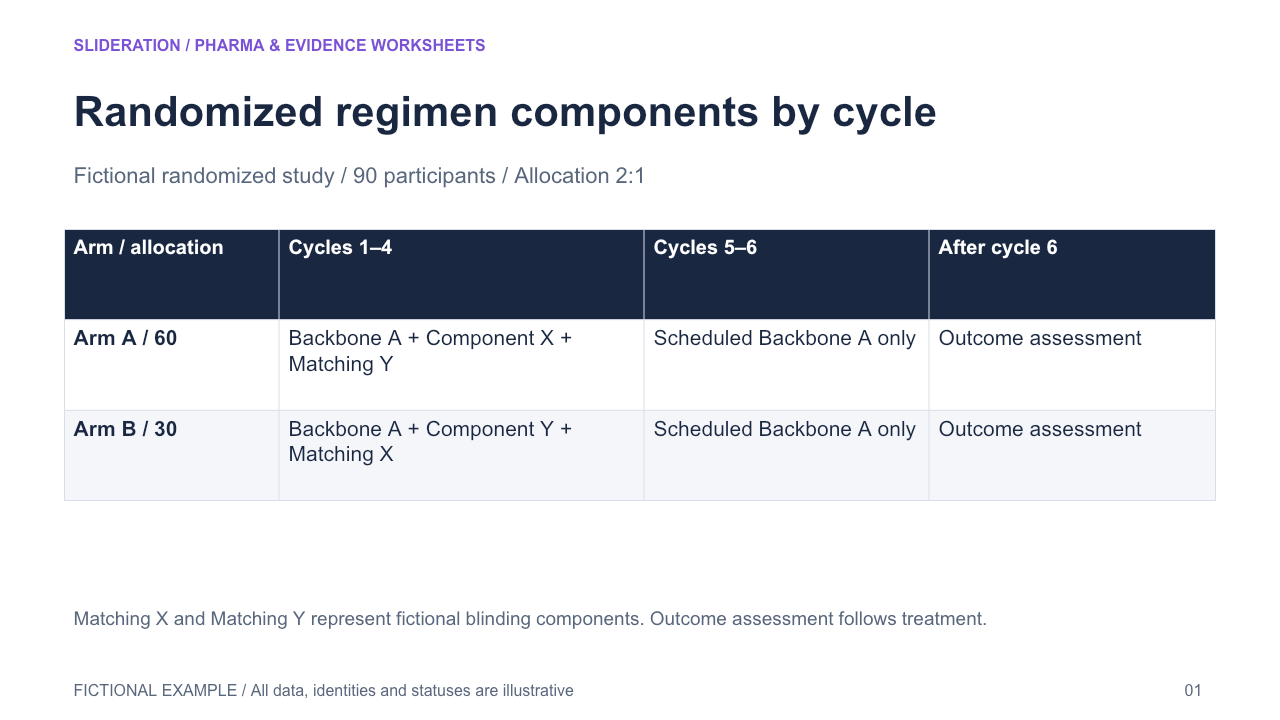
Randomized regimen components by cycle — Map randomized arms to the active, matching and shared components in each treatment-cycle window, then show whether the arms converge on a shared component or have different scheduled endings.
2 slides · 1 credit
Check inputs & editing effort →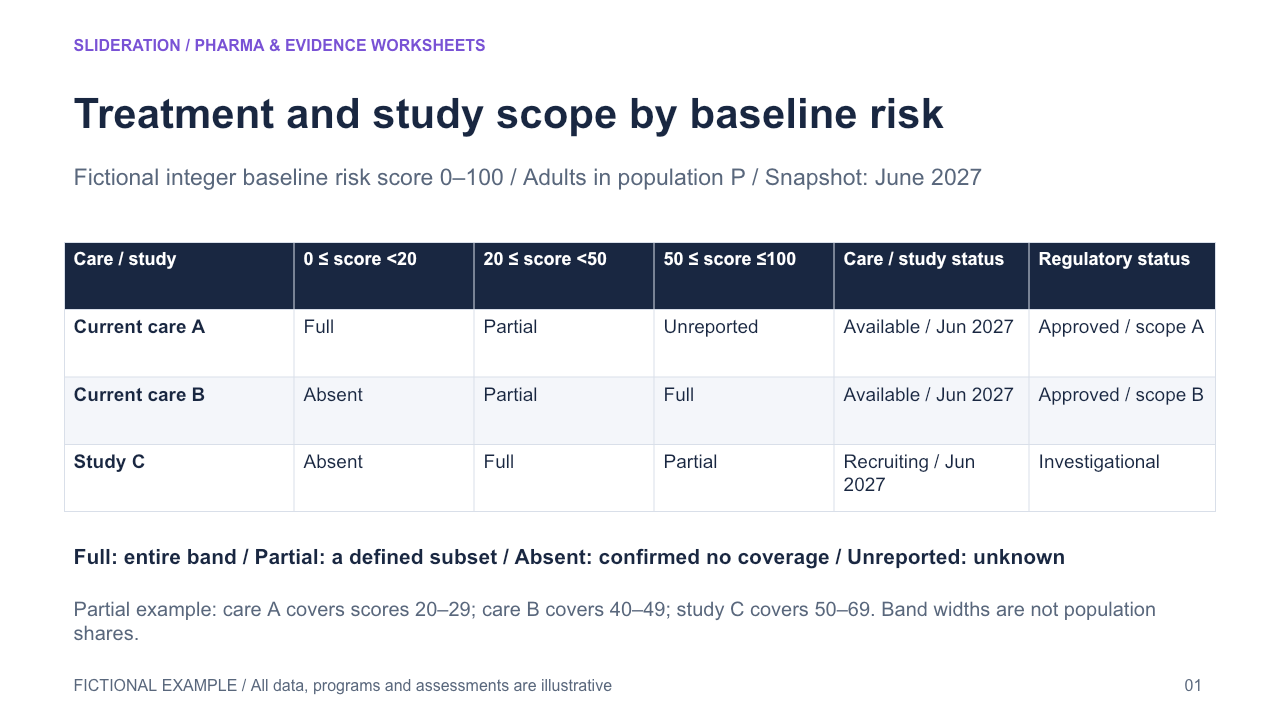
Treatment and study scope by baseline risk — Compare current care and investigational study populations against the same ordered baseline-risk bands. Show exact or partial coverage independently for each row, and attach regulatory or study status as separate evidence. The care-stage map spans chronological steps, and eligibility cards do not align several treatment or study scopes against common risk bands.
2 slides · 1 credit
Check inputs & editing effort →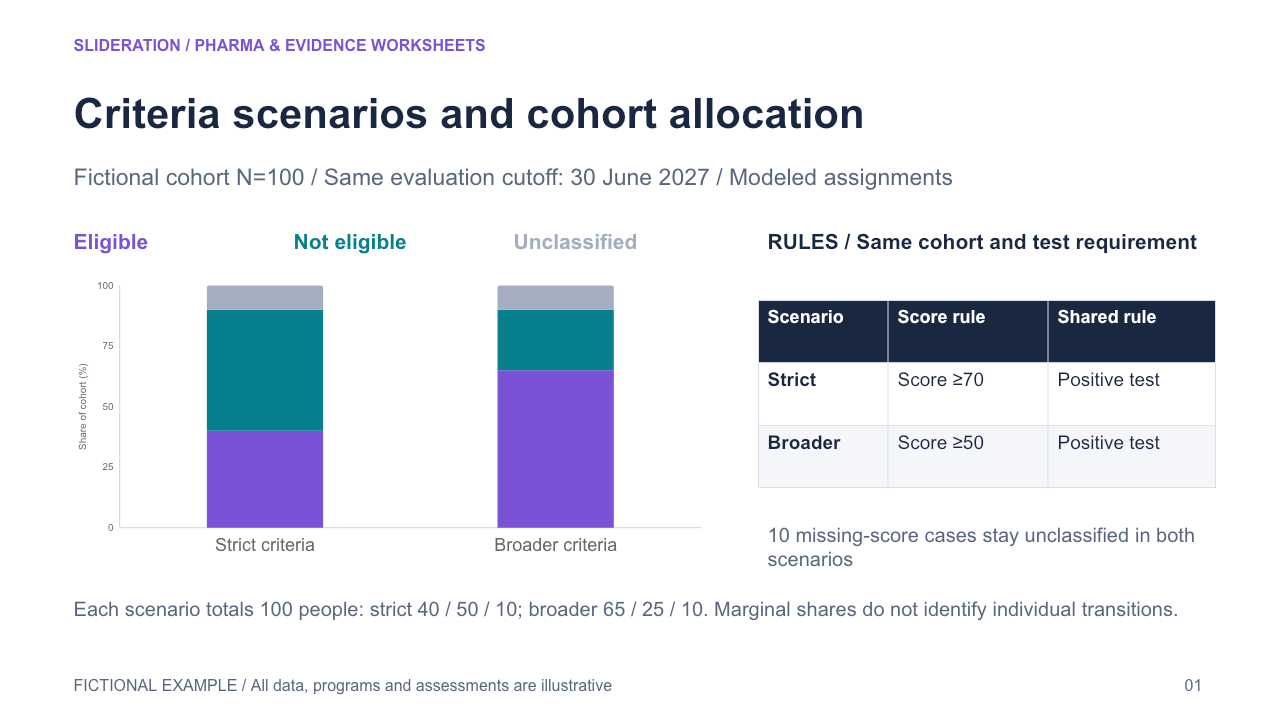
Criteria scenarios and cohort allocation — Compare stricter and broader criteria applied to the same evaluation cohort, tying each rule set to resulting assignment shares. Existing criteria cards describe rules, and coverage templates show a single scenario; this exhibit links alternative rules to population allocation.
2 slides · 1 credit
Check inputs & editing effort →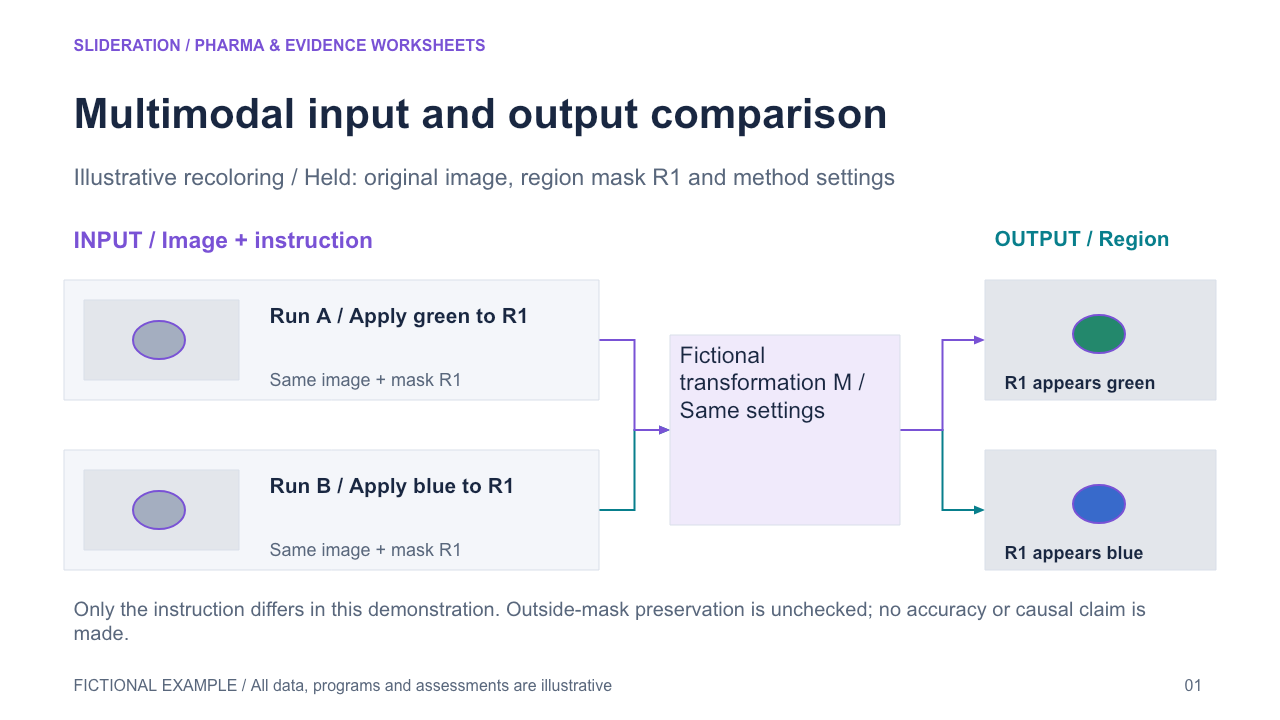
Multimodal input and output comparison — Show two matched runs with input annotations aligned to output evidence, a common method block and an explicit changed field or region. Existing before-and-after tables document changes in records, and process flows show transformation stages without matching changed and held inputs across two runs.
2 slides · 1 credit
Check inputs & editing effort →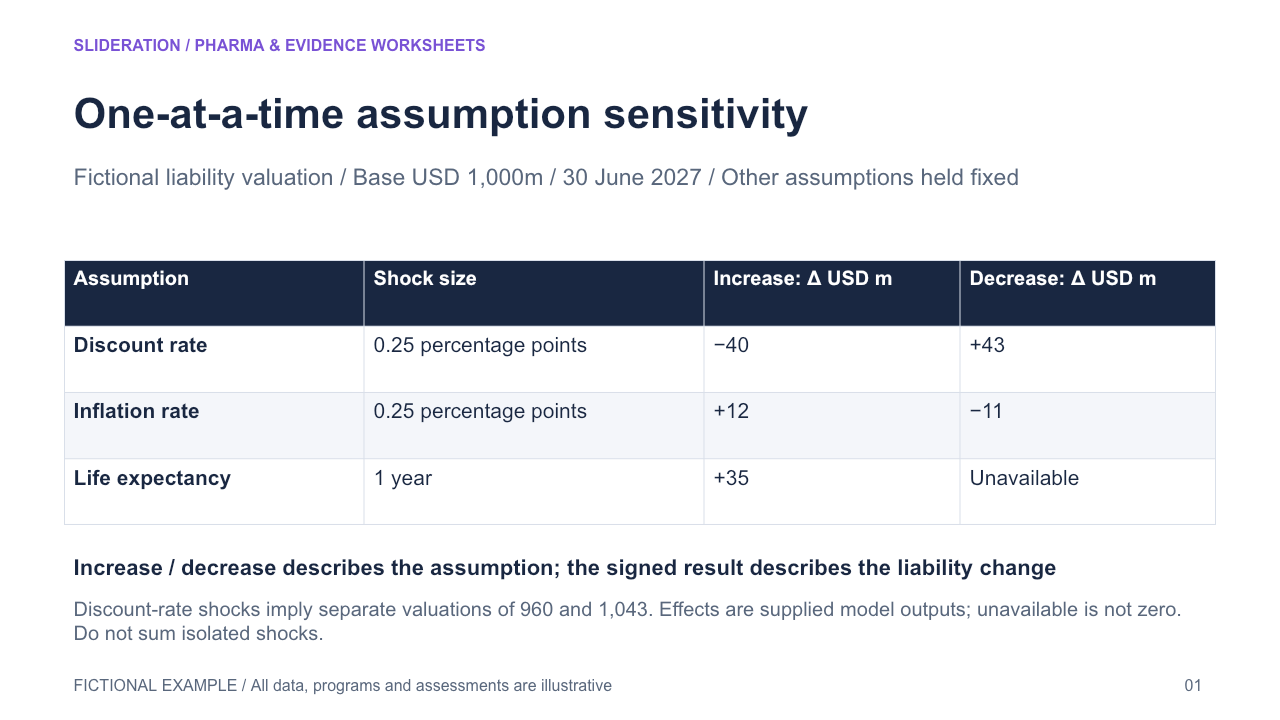
One-at-a-time assumption sensitivity — Keep the valuation baseline and one-assumption-at-a-time method with a shock unit for each assumption and separate increase/decrease responses. Preserve asymmetry and unavailable directions. Paired comparison bars do not identify perturbation sizes; FX scenarios change paths over time; observed/model evidence distinguishes uncertainty rather than isolated input shocks.
2 slides · 1 credit
Check inputs & editing effort →